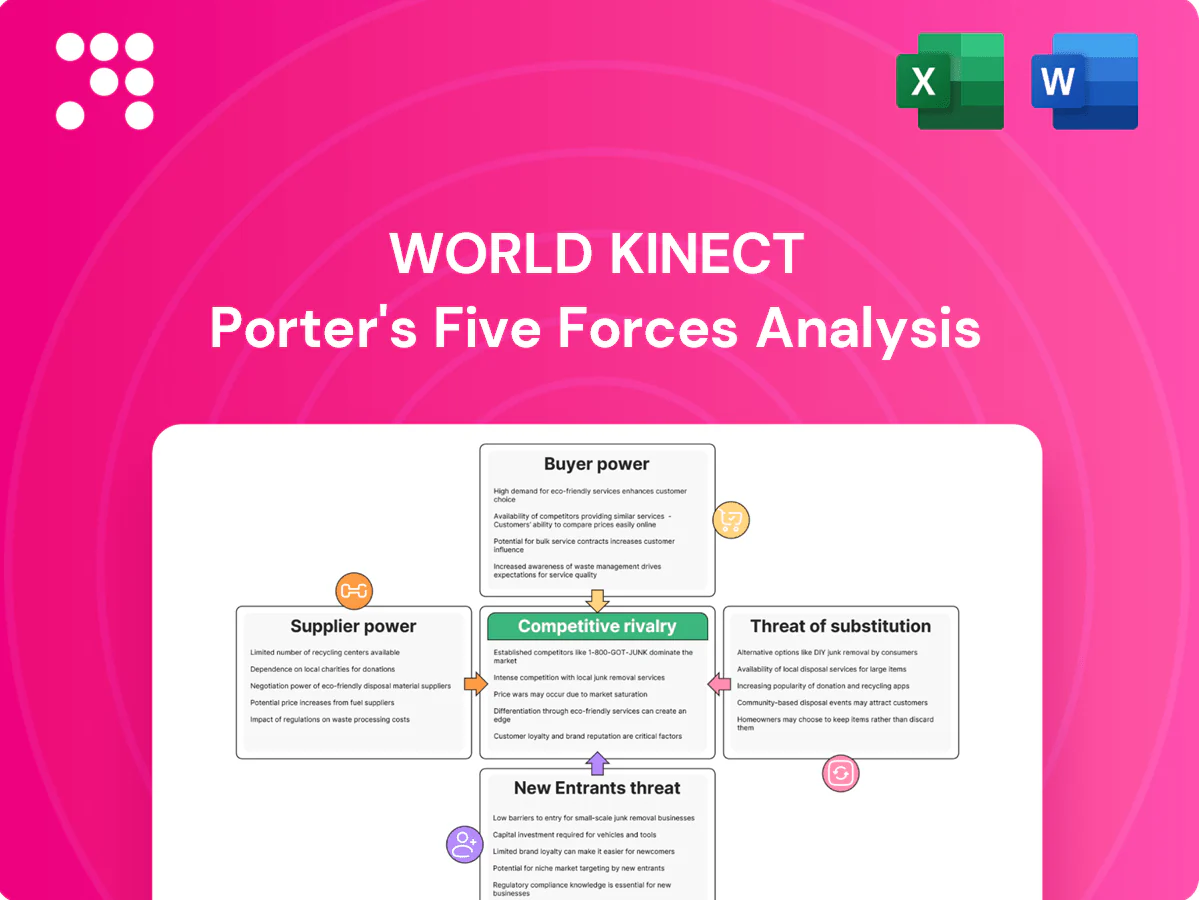
World Kinect Porter's Five Forces Analysis

Go Beyond the Preview—Access the Full Strategic Report
World Kinect faces a dynamic mix of supplier concentration, moderate buyer bargaining power, and rising regulatory and substitute pressures that shape its margin and growth prospects. Competitive intensity from integrated energy players and niche disruptors tests scale advantages and pricing power. This brief snapshot highlights key strategic tensions—unlock the full Porter's Five Forces Analysis to access force-by-force ratings, visuals, and actionable recommendations tailored to World Kinect.
Suppliers Bargaining Power

Concentrated fuel producers
Refiners and oil majors, with OPEC+ accounting for roughly 45% of global crude output in 2024, exert strong pricing leverage across aviation, marine and diesel markets; refinery outages removing about 1 mb/d of capacity in 2024 tightened supplies and lifted product spreads. World Kinect limits exposure via multi-sourcing and long-term supply agreements covering a majority of its contracted volumes, but scarcity in key regional hubs can still push local premiums higher and elevate supplier power.
Infrastructure gatekeepers
Pipeline operators, storage terminals and airport hydrant systems act as chokepoints; in the US pipelines moved about 68% of crude and petroleum product volumes per EIA (2023), cementing access and fee-setting power. Access fees and allocation priorities often favor incumbents, trimming World Kinect’s negotiating room despite its logistics strengths. Local monopoly assets in constrained hubs further amplify supplier leverage.

ESG and compliance constraints
Limited global SAF and renewable diesel supply—roughly 0.5 billion liters SAF production in 2024—plus tight ASTM and ICAO CORSIA specs raise certification and credit costs, increasing switching costs for buyers. Suppliers holding certified molecules command premiums typically 20–60%, and carbon credit regimes concentrate value with few producers. This dynamic elevates supplier bargaining power in World Kinect’s decarbonizing segments.

Price volatility and credit terms
Crude volatility in 2024 (roughly $70–$120/bbl swings) shifted margin risk onto distributors, prompting suppliers to tighten credit or demand prepayment in stressed windows. World Kinect’s strong balance sheet improves negotiation, but higher spot swings increase supplier leverage and raise risk premiums that can compress intermediary margins.
- Supplier leverage up: tighter credit/prepay
- 2024 price swings erode distributor margins
- Balance-sheet strength = better but not immune
- Risk premiums compress intermediary spreads
Regional and geopolitical exposure
Sanctions, extreme weather and port disruptions concentrate supplier options, elevating supplier leverage for World Kinect; in 2024 Red Sea route attacks and regional sanctions narrowed compliant supplier pools in some corridors. In affected geographies often only a handful of compliant suppliers remain, increasing dependence and pushing up input costs and lead-time risk. Global diversification reduced exposure but only partially offset localized shocks in 2024.
- 2024: Red Sea/strait disruptions increased reroute costs for maritime freight
- Few compliant suppliers in sanctioned regions, raising supplier bargaining power
- Diversified sourcing reduces but does not eliminate localized concentration risk
OPEC+, refinery outages and pipeline bottlenecks tighten fuels; SAF scarcity boosts supplier power
Refiners and OPEC+ (≈45% of global crude in 2024) plus ~1 mb/d refinery outages tightened product markets, boosting supplier pricing power. US pipelines moved ~68% of volumes (EIA 2023), creating access fees and local monopolies that constrain World Kinect. SAF/renewable diesel supply remained scarce (~0.5bn L in 2024), with certified molecules commanding 20–60% premiums, raising switching costs.
| Metric | 2024 |
|---|---|
| OPEC+ share | ≈45% |
| Refinery outages | ~1 mb/d |
| US pipeline share | 68% (EIA 2023) |
| SAF supply | ~0.5 bn L |
| SAF premium | 20–60% |
What is included in the product
 Detailed Word Document
Comprehensive Porter's Five Forces assessment tailored to World Kinect, examining competitive rivalry, supplier and buyer power, threat of substitutes, and entry barriers to reveal pricing pressures, profitability levers, and strategic risks for informed decision-making.

 Customizable Excel Spreadsheet
A concise one-sheet Porter's Five Forces for World Kinect that visualizes competitive pressure with a spider chart and customizable inputs—ideal for quick decisions and pitch decks; no macros, easy to swap in your data and duplicate tabs for scenario testing.
Customers Bargaining Power

Large, sophisticated customers
Airlines, shipping lines and large industrials run competitive RFPs with clear benchmarks, with fuel budgets often in the tens to hundreds of millions annually; jet fuel has historically represented about 20–30% of airline operating costs. Their purchasing scale and concentrated fuel spend allow them to press for tougher pricing and service terms and to split awards among vendors to retain leverage. This behavior compresses supplier margins and elevates buyer power.
High price transparency
Platts and OPIS publish daily assessed commodity benchmarks, making fuel prices transparent to customers and enabling index-linked quoting with minimal premiums. This transparency compresses wholesale-retail spreads and has driven more frequent contract renegotiations and spot switching. As margins narrow, buyers wield greater bargaining power. World Kinect must compete on logistics efficiency, delivery reliability, and value-added risk-management services to retain pricing flexibility.

Switching costs are moderate
Fuel itself is standardized so price is a primary lever, but delivery, credit terms and data integration create friction that raised customer retention in 2024 as multi-hub service and consolidated invoicing increased operational stickiness.

Decarbonization procurement leverage
Corporate net-zero commitments (over 2,000 firms by 2024 per Net Zero Tracker) let buyers bundle SAF, RECs and PPAs in tenders, extracting value via guarantees of origin and enhanced reporting; suppliers lacking verifiable low-carbon volumes have ceded share in large RFPs, strengthening buyer leverage in energy solutions.
- Buyers bundle: SAF+REC+PPA
- 2024: >2,000 net-zero firms
- Guarantees of origin drive pricing
- Vendors without verified low-carbon lose share
Demand cyclicality
Demand cyclicality magnifies customer bargaining power when downturns in travel, freight, or industry cut volumes and intensify bidding; excess supplier capacity chases fewer gallons and buyers secure deeper discounts and flexible terms. IMF projected global GDP growth of 3.1% in 2024, yet sectoral weakness kept fuel and logistics demand uneven, pushing buyer leverage highest in weak cycles.
- More suppliers than demand → tougher bids
- Buyers extract discounts, flexible terms
- Buyer power peaks in weak demand cycles
Buyers squeeze margins; airlines face 20-30% jet fuel opex, SAF verified
Large buyers (airlines, shippers, industrials) leverage scale—jet fuel is ~20–30% of airline opex—and run competitive RFPs, compressing supplier margins. Price transparency from Platts/OPIS and index-linked contracts elevate buyer power; spot switching rose in 2024. Corporate net-zero (>2,000 firms in 2024) bundles SAF+REC+PPA, shifting share to verified suppliers.
| Metric | 2024 |
|---|---|
| Jet fuel share of airline opex | 20–30% |
| Net-zero firms | >2,000 |
| IMF global GDP growth | 3.1% |
Same Document Delivered
World Kinect Porter's Five Forces Analysis
This preview shows the exact World Kinect Porter's Five Forces Analysis you'll receive immediately after purchase—no placeholders or samples. The file is the fully formatted, final report ready for download and use the moment you buy. No mockups or edits required; what you see here is the deliverable.

Go Beyond the Preview—Access the Full Strategic Report
World Kinect faces a dynamic mix of supplier concentration, moderate buyer bargaining power, and rising regulatory and substitute pressures that shape its margin and growth prospects. Competitive intensity from integrated energy players and niche disruptors tests scale advantages and pricing power. This brief snapshot highlights key strategic tensions—unlock the full Porter's Five Forces Analysis to access force-by-force ratings, visuals, and actionable recommendations tailored to World Kinect.
Suppliers Bargaining Power
Concentrated fuel producers
Refiners and oil majors, with OPEC+ accounting for roughly 45% of global crude output in 2024, exert strong pricing leverage across aviation, marine and diesel markets; refinery outages removing about 1 mb/d of capacity in 2024 tightened supplies and lifted product spreads. World Kinect limits exposure via multi-sourcing and long-term supply agreements covering a majority of its contracted volumes, but scarcity in key regional hubs can still push local premiums higher and elevate supplier power.
Infrastructure gatekeepers
Pipeline operators, storage terminals and airport hydrant systems act as chokepoints; in the US pipelines moved about 68% of crude and petroleum product volumes per EIA (2023), cementing access and fee-setting power. Access fees and allocation priorities often favor incumbents, trimming World Kinect’s negotiating room despite its logistics strengths. Local monopoly assets in constrained hubs further amplify supplier leverage.
ESG and compliance constraints
Limited global SAF and renewable diesel supply—roughly 0.5 billion liters SAF production in 2024—plus tight ASTM and ICAO CORSIA specs raise certification and credit costs, increasing switching costs for buyers. Suppliers holding certified molecules command premiums typically 20–60%, and carbon credit regimes concentrate value with few producers. This dynamic elevates supplier bargaining power in World Kinect’s decarbonizing segments.
Price volatility and credit terms
Crude volatility in 2024 (roughly $70–$120/bbl swings) shifted margin risk onto distributors, prompting suppliers to tighten credit or demand prepayment in stressed windows. World Kinect’s strong balance sheet improves negotiation, but higher spot swings increase supplier leverage and raise risk premiums that can compress intermediary margins.
- Supplier leverage up: tighter credit/prepay
- 2024 price swings erode distributor margins
- Balance-sheet strength = better but not immune
- Risk premiums compress intermediary spreads
Regional and geopolitical exposure
Sanctions, extreme weather and port disruptions concentrate supplier options, elevating supplier leverage for World Kinect; in 2024 Red Sea route attacks and regional sanctions narrowed compliant supplier pools in some corridors. In affected geographies often only a handful of compliant suppliers remain, increasing dependence and pushing up input costs and lead-time risk. Global diversification reduced exposure but only partially offset localized shocks in 2024.
- 2024: Red Sea/strait disruptions increased reroute costs for maritime freight
- Few compliant suppliers in sanctioned regions, raising supplier bargaining power
- Diversified sourcing reduces but does not eliminate localized concentration risk
OPEC+, refinery outages and pipeline bottlenecks tighten fuels; SAF scarcity boosts supplier power
Refiners and OPEC+ (≈45% of global crude in 2024) plus ~1 mb/d refinery outages tightened product markets, boosting supplier pricing power. US pipelines moved ~68% of volumes (EIA 2023), creating access fees and local monopolies that constrain World Kinect. SAF/renewable diesel supply remained scarce (~0.5bn L in 2024), with certified molecules commanding 20–60% premiums, raising switching costs.
| Metric | 2024 |
|---|---|
| OPEC+ share | ≈45% |
| Refinery outages | ~1 mb/d |
| US pipeline share | 68% (EIA 2023) |
| SAF supply | ~0.5 bn L |
| SAF premium | 20–60% |
What is included in the product
Detailed Word Document
Comprehensive Porter's Five Forces assessment tailored to World Kinect, examining competitive rivalry, supplier and buyer power, threat of substitutes, and entry barriers to reveal pricing pressures, profitability levers, and strategic risks for informed decision-making.
Customizable Excel Spreadsheet
A concise one-sheet Porter's Five Forces for World Kinect that visualizes competitive pressure with a spider chart and customizable inputs—ideal for quick decisions and pitch decks; no macros, easy to swap in your data and duplicate tabs for scenario testing.
Customers Bargaining Power
Large, sophisticated customers
Airlines, shipping lines and large industrials run competitive RFPs with clear benchmarks, with fuel budgets often in the tens to hundreds of millions annually; jet fuel has historically represented about 20–30% of airline operating costs. Their purchasing scale and concentrated fuel spend allow them to press for tougher pricing and service terms and to split awards among vendors to retain leverage. This behavior compresses supplier margins and elevates buyer power.
High price transparency
Platts and OPIS publish daily assessed commodity benchmarks, making fuel prices transparent to customers and enabling index-linked quoting with minimal premiums. This transparency compresses wholesale-retail spreads and has driven more frequent contract renegotiations and spot switching. As margins narrow, buyers wield greater bargaining power. World Kinect must compete on logistics efficiency, delivery reliability, and value-added risk-management services to retain pricing flexibility.
Switching costs are moderate
Fuel itself is standardized so price is a primary lever, but delivery, credit terms and data integration create friction that raised customer retention in 2024 as multi-hub service and consolidated invoicing increased operational stickiness.
Decarbonization procurement leverage
Corporate net-zero commitments (over 2,000 firms by 2024 per Net Zero Tracker) let buyers bundle SAF, RECs and PPAs in tenders, extracting value via guarantees of origin and enhanced reporting; suppliers lacking verifiable low-carbon volumes have ceded share in large RFPs, strengthening buyer leverage in energy solutions.
- Buyers bundle: SAF+REC+PPA
- 2024: >2,000 net-zero firms
- Guarantees of origin drive pricing
- Vendors without verified low-carbon lose share
Demand cyclicality
Demand cyclicality magnifies customer bargaining power when downturns in travel, freight, or industry cut volumes and intensify bidding; excess supplier capacity chases fewer gallons and buyers secure deeper discounts and flexible terms. IMF projected global GDP growth of 3.1% in 2024, yet sectoral weakness kept fuel and logistics demand uneven, pushing buyer leverage highest in weak cycles.
- More suppliers than demand → tougher bids
- Buyers extract discounts, flexible terms
- Buyer power peaks in weak demand cycles
Buyers squeeze margins; airlines face 20-30% jet fuel opex, SAF verified
Large buyers (airlines, shippers, industrials) leverage scale—jet fuel is ~20–30% of airline opex—and run competitive RFPs, compressing supplier margins. Price transparency from Platts/OPIS and index-linked contracts elevate buyer power; spot switching rose in 2024. Corporate net-zero (>2,000 firms in 2024) bundles SAF+REC+PPA, shifting share to verified suppliers.
| Metric | 2024 |
|---|---|
| Jet fuel share of airline opex | 20–30% |
| Net-zero firms | >2,000 |
| IMF global GDP growth | 3.1% |
Same Document Delivered
World Kinect Porter's Five Forces Analysis
This preview shows the exact World Kinect Porter's Five Forces Analysis you'll receive immediately after purchase—no placeholders or samples. The file is the fully formatted, final report ready for download and use the moment you buy. No mockups or edits required; what you see here is the deliverable.
Original: $10.00
-65%$10.00
$3.50Description
Go Beyond the Preview—Access the Full Strategic Report
World Kinect faces a dynamic mix of supplier concentration, moderate buyer bargaining power, and rising regulatory and substitute pressures that shape its margin and growth prospects. Competitive intensity from integrated energy players and niche disruptors tests scale advantages and pricing power. This brief snapshot highlights key strategic tensions—unlock the full Porter's Five Forces Analysis to access force-by-force ratings, visuals, and actionable recommendations tailored to World Kinect.
Suppliers Bargaining Power
Concentrated fuel producers
Refiners and oil majors, with OPEC+ accounting for roughly 45% of global crude output in 2024, exert strong pricing leverage across aviation, marine and diesel markets; refinery outages removing about 1 mb/d of capacity in 2024 tightened supplies and lifted product spreads. World Kinect limits exposure via multi-sourcing and long-term supply agreements covering a majority of its contracted volumes, but scarcity in key regional hubs can still push local premiums higher and elevate supplier power.
Infrastructure gatekeepers
Pipeline operators, storage terminals and airport hydrant systems act as chokepoints; in the US pipelines moved about 68% of crude and petroleum product volumes per EIA (2023), cementing access and fee-setting power. Access fees and allocation priorities often favor incumbents, trimming World Kinect’s negotiating room despite its logistics strengths. Local monopoly assets in constrained hubs further amplify supplier leverage.
ESG and compliance constraints
Limited global SAF and renewable diesel supply—roughly 0.5 billion liters SAF production in 2024—plus tight ASTM and ICAO CORSIA specs raise certification and credit costs, increasing switching costs for buyers. Suppliers holding certified molecules command premiums typically 20–60%, and carbon credit regimes concentrate value with few producers. This dynamic elevates supplier bargaining power in World Kinect’s decarbonizing segments.
Price volatility and credit terms
Crude volatility in 2024 (roughly $70–$120/bbl swings) shifted margin risk onto distributors, prompting suppliers to tighten credit or demand prepayment in stressed windows. World Kinect’s strong balance sheet improves negotiation, but higher spot swings increase supplier leverage and raise risk premiums that can compress intermediary margins.
- Supplier leverage up: tighter credit/prepay
- 2024 price swings erode distributor margins
- Balance-sheet strength = better but not immune
- Risk premiums compress intermediary spreads
Regional and geopolitical exposure
Sanctions, extreme weather and port disruptions concentrate supplier options, elevating supplier leverage for World Kinect; in 2024 Red Sea route attacks and regional sanctions narrowed compliant supplier pools in some corridors. In affected geographies often only a handful of compliant suppliers remain, increasing dependence and pushing up input costs and lead-time risk. Global diversification reduced exposure but only partially offset localized shocks in 2024.
- 2024: Red Sea/strait disruptions increased reroute costs for maritime freight
- Few compliant suppliers in sanctioned regions, raising supplier bargaining power
- Diversified sourcing reduces but does not eliminate localized concentration risk
OPEC+, refinery outages and pipeline bottlenecks tighten fuels; SAF scarcity boosts supplier power
Refiners and OPEC+ (≈45% of global crude in 2024) plus ~1 mb/d refinery outages tightened product markets, boosting supplier pricing power. US pipelines moved ~68% of volumes (EIA 2023), creating access fees and local monopolies that constrain World Kinect. SAF/renewable diesel supply remained scarce (~0.5bn L in 2024), with certified molecules commanding 20–60% premiums, raising switching costs.
| Metric | 2024 |
|---|---|
| OPEC+ share | ≈45% |
| Refinery outages | ~1 mb/d |
| US pipeline share | 68% (EIA 2023) |
| SAF supply | ~0.5 bn L |
| SAF premium | 20–60% |
What is included in the product
Detailed Word Document
Comprehensive Porter's Five Forces assessment tailored to World Kinect, examining competitive rivalry, supplier and buyer power, threat of substitutes, and entry barriers to reveal pricing pressures, profitability levers, and strategic risks for informed decision-making.
Customizable Excel Spreadsheet
A concise one-sheet Porter's Five Forces for World Kinect that visualizes competitive pressure with a spider chart and customizable inputs—ideal for quick decisions and pitch decks; no macros, easy to swap in your data and duplicate tabs for scenario testing.
Customers Bargaining Power
Large, sophisticated customers
Airlines, shipping lines and large industrials run competitive RFPs with clear benchmarks, with fuel budgets often in the tens to hundreds of millions annually; jet fuel has historically represented about 20–30% of airline operating costs. Their purchasing scale and concentrated fuel spend allow them to press for tougher pricing and service terms and to split awards among vendors to retain leverage. This behavior compresses supplier margins and elevates buyer power.
High price transparency
Platts and OPIS publish daily assessed commodity benchmarks, making fuel prices transparent to customers and enabling index-linked quoting with minimal premiums. This transparency compresses wholesale-retail spreads and has driven more frequent contract renegotiations and spot switching. As margins narrow, buyers wield greater bargaining power. World Kinect must compete on logistics efficiency, delivery reliability, and value-added risk-management services to retain pricing flexibility.
Switching costs are moderate
Fuel itself is standardized so price is a primary lever, but delivery, credit terms and data integration create friction that raised customer retention in 2024 as multi-hub service and consolidated invoicing increased operational stickiness.
Decarbonization procurement leverage
Corporate net-zero commitments (over 2,000 firms by 2024 per Net Zero Tracker) let buyers bundle SAF, RECs and PPAs in tenders, extracting value via guarantees of origin and enhanced reporting; suppliers lacking verifiable low-carbon volumes have ceded share in large RFPs, strengthening buyer leverage in energy solutions.
- Buyers bundle: SAF+REC+PPA
- 2024: >2,000 net-zero firms
- Guarantees of origin drive pricing
- Vendors without verified low-carbon lose share
Demand cyclicality
Demand cyclicality magnifies customer bargaining power when downturns in travel, freight, or industry cut volumes and intensify bidding; excess supplier capacity chases fewer gallons and buyers secure deeper discounts and flexible terms. IMF projected global GDP growth of 3.1% in 2024, yet sectoral weakness kept fuel and logistics demand uneven, pushing buyer leverage highest in weak cycles.
- More suppliers than demand → tougher bids
- Buyers extract discounts, flexible terms
- Buyer power peaks in weak demand cycles
Buyers squeeze margins; airlines face 20-30% jet fuel opex, SAF verified
Large buyers (airlines, shippers, industrials) leverage scale—jet fuel is ~20–30% of airline opex—and run competitive RFPs, compressing supplier margins. Price transparency from Platts/OPIS and index-linked contracts elevate buyer power; spot switching rose in 2024. Corporate net-zero (>2,000 firms in 2024) bundles SAF+REC+PPA, shifting share to verified suppliers.
| Metric | 2024 |
|---|---|
| Jet fuel share of airline opex | 20–30% |
| Net-zero firms | >2,000 |
| IMF global GDP growth | 3.1% |
Same Document Delivered
World Kinect Porter's Five Forces Analysis
This preview shows the exact World Kinect Porter's Five Forces Analysis you'll receive immediately after purchase—no placeholders or samples. The file is the fully formatted, final report ready for download and use the moment you buy. No mockups or edits required; what you see here is the deliverable.











