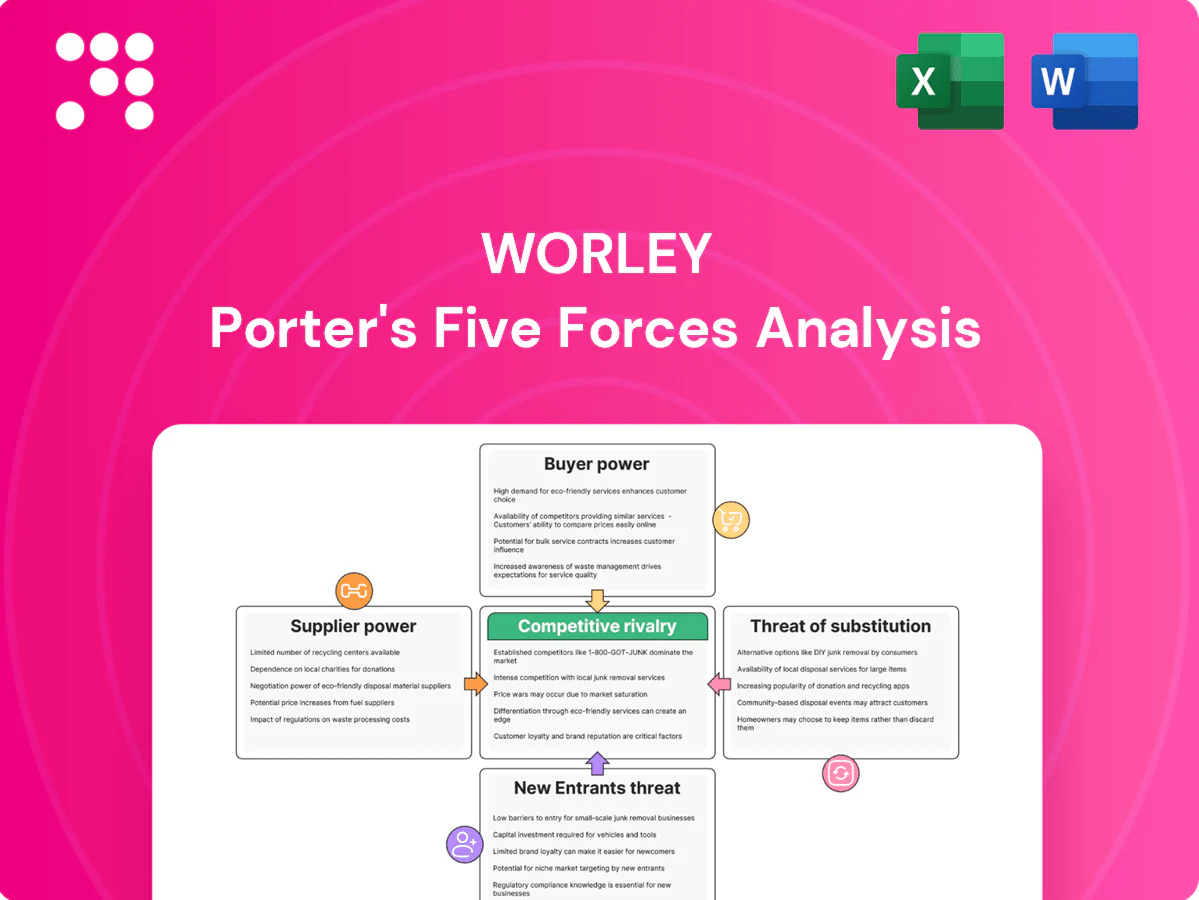
Worley Porter's Five Forces Analysis

Go Beyond the Preview—Access the Full Strategic Report
Worley faces intense supplier and buyer pressures, evolving substitute threats, and moderate entry barriers that shape its strategic outlook; this snapshot highlights key tensions and opportunities. Ready to move beyond the basics? Unlock the full Porter's Five Forces Analysis to see force-by-force ratings, visuals, and actionable insights tailored to Worley.
Suppliers Bargaining Power

Scarce specialist talent
Highly skilled engineers, process designers and project managers are scarce, giving recruiters leverage and driving wage inflation and retention bonuses that can reach double-digit percentages of base pay; Worley reported employee-related cost pressures in 2024 tied to talent retention.
Critical OEMs and tech vendors
Specialized compressors, subsea kits and design suites are concentrated among a few global OEMs, creating tight supply pools with lead times often 6–24 months and IP/certification lock‑ins that raise dependence. Strategic vendor alliances improve delivery but constrain bid flexibility and commercial terms. Dual‑sourcing and component standardization can reduce supplier power, but are frequently infeasible for bespoke, project‑specific systems.

Subcontractor and fabricator leverage
Local fabricators, construction firms and niche consultants can acquire leverage in regional booms as capacity utilization often exceeds 85%, driving rate inflation and schedule risk; subcontractor dayrates have been reported to rise 20–40% in peak regions. Local-content rules in some jurisdictions mandate 30–60% domestic sourcing, forcing supplier selection. Framework agreements and early contractor involvement reduce variability and cap contingency premiums.

Data, permits, and site access
Geotech data, permits, and site access controlled by local authorities greatly influence Worley project execution; industry benchmarks in 2024 put site investigation at roughly 0.5–1.5% of capex and permit timelines from weeks to over a year depending on jurisdiction.
Delays or restrictive terms frequently raise costs and schedule risk; reported cost uplifts from permitting delays range broadly but commonly add single- to low-double-digit percent to capex.
Partnerships with authorities and communities become quasi-supply dependencies, so early engagement and contingency planning are essential to mitigate 2024-era regulatory and logistical bottlenecks.
- Geotech data: 0.5–1.5% of capex (2024 industry benchmark)
- Permit timelines: weeks to >1 year (jurisdiction-dependent)
- Cost uplift: common single- to low-double-digit percent from delays
- Mitigation: early engagement + contingency planning
ESG-compliant inputs
- Limited availability -> higher supplier leverage
- Premiums ~5–15% in 2024
- ~60% of large clients require ESG credentials (2024)
- Supplier development and verified procurement lower exposure
Supplier power raises costs: subcontractor 20–40%, ESG premiums 5–15%, ~60% ESG mandates
Supplier power is high: scarce engineering talent and certified OEMs drive wage inflation and long lead times, with Worley noting 2024 employee cost pressures and subcontractor dayrate rises of 20–40% in peaks. ESG inputs carry 5–15% premiums and ~60% client ESG procurement mandates in 2024, while permits and geotech (0.5–1.5% of capex) create schedule risk and single- to low-double-digit capex uplifts.
| Metric | 2024 Benchmark |
|---|---|
| Geotech share of capex | 0.5–1.5% |
| Permit timelines | weeks to >1 year |
| Subcontractor rate rise | 20–40% (peaks) |
| ESG input premium | 5–15% |
| Clients requiring ESG creds | ~60% |
What is included in the product
 Detailed Word Document
Tailored Porter’s Five Forces analysis for Worley, uncovering competitive intensity, supplier and buyer power, entry barriers, and substitute threats, with strategic commentary to inform investor and management decisions.

 Customizable Excel Spreadsheet
Worley Porter’s Five Forces Analysis condenses competitive pressures into a single, actionable one-sheet so teams can quickly pinpoint strategic pain points and prioritize fixes. Toggle scenarios, swap in live data, and export clean visuals for decks—no complex setup required.
Customers Bargaining Power

Concentrated blue-chip clients
IOCs, NOCs, chemical majors and large miners wield concentrated buying power with sophisticated procurement teams that demand competitive pricing, robust risk transfer and stringent KPIs; top clients often hold more than 50% of near-term project pipelines. Their brand and pipeline control translate into strong bargaining leverage, compressing margins on single projects. Multi-year frameworks (typically 3–5 years) are used to trade volume for price concessions, stabilizing revenues and procurement cycles in 2024.
Competitive tendering norms
Open tenders, panel rosters and bid benchmarking (typically 3–5 shortlisted bidders) intensify price pressure and drive margins down, with buyers regularly splitting scopes to keep competitive tension. Differentiation via safety records, digital delivery and sustainability credentials helps defend margins by shifting selection criteria beyond price. Securing pre-FEED to EPC continuity reduces re-bid risk by limiting scope rebids across project phases.

Switching costs moderate
Design handovers and common data standards in 2024 enable clients to switch between EPC/EPCM providers, reducing barriers; however late-stage transitions carry schedule and warranty risks and can jeopardize project timelines. Strong project controls and proprietary know-how raise client stickiness, and warranty periods commonly range 1–5 years. Performance history remains the dominant factor in renewals.

Outcome and risk allocation
Buyers increasingly demand lump-sum and performance guarantees, shifting construction and delivery risk onto EPC contractors and pressuring margins; industry notes lump-sum projects often drive single-digit EPC margins in recent years. Alliance or reimbursable models mitigate margin compression but require high trust and transparency, with owners demanding detailed cost visibility. Robust risk management and precise pricing of transfered risks are pivotal to avoid margin erosion and dispute escalation.
- Buyers: push lump-sum & performance guarantees
- Risk: transfers can compress margins to single digits
- Models: alliance/reimbursable ease pressure but need trust
- Negotiations: robust risk management is essential
Energy-transition mandates
Clients increasingly tie awards to decarbonization pathways and measurable ESG outcomes, raising qualification hurdles and compliance costs as firms must meet taxonomy and reporting demands such as the EU CSRD affecting ~50,000 companies from 2024; those compliant win clear preference. Advisory-to-delivery integration boosts win probability and pricing power by aligning strategy with on-the-ground execution.
- Clients: awards conditional on decarbonization
- Compliance: CSRD ~50,000 firms (2024)
- Barrier: higher qualification and reporting costs
- Advantage: advisory-to-delivery = better wins/pricing
Top clients hold >50% pipeline, 3-5 bidders, EPC margins single-digit; CSRD ~50,000 firms
Major IOCs/NOCs/majors hold concentrated buying power (>50% of near-term pipeline), driving tight pricing, strict KPIs and multi-year frameworks (3–5y) that compress single-project margins. Open tenders (3–5 shortlisted) and lump-sum demands have pushed EPC margins to single digits in 2024. ESG/CSRD compliance (~50,000 firms) raises qualification costs but boosts award probability for compliant firms.
| Metric | 2024 |
|---|---|
| Top-client pipeline share | >50% |
| Shortlisted bidders | 3–5 |
| Typical warranties | 1–5 yrs |
| Typical EPC margins | Single-digit |
| CSRD scope | ~50,000 firms |
Full Version Awaits
Worley Porter's Five Forces Analysis
This Worley Porter's Five Forces Analysis preview is the exact document you'll receive immediately after purchase—no placeholders or mockups. It contains the full, professionally formatted assessment ready for download and use the moment you buy. What you see here is precisely the deliverable you'll get.

Go Beyond the Preview—Access the Full Strategic Report
Worley faces intense supplier and buyer pressures, evolving substitute threats, and moderate entry barriers that shape its strategic outlook; this snapshot highlights key tensions and opportunities. Ready to move beyond the basics? Unlock the full Porter's Five Forces Analysis to see force-by-force ratings, visuals, and actionable insights tailored to Worley.
Suppliers Bargaining Power
Scarce specialist talent
Highly skilled engineers, process designers and project managers are scarce, giving recruiters leverage and driving wage inflation and retention bonuses that can reach double-digit percentages of base pay; Worley reported employee-related cost pressures in 2024 tied to talent retention.
Critical OEMs and tech vendors
Specialized compressors, subsea kits and design suites are concentrated among a few global OEMs, creating tight supply pools with lead times often 6–24 months and IP/certification lock‑ins that raise dependence. Strategic vendor alliances improve delivery but constrain bid flexibility and commercial terms. Dual‑sourcing and component standardization can reduce supplier power, but are frequently infeasible for bespoke, project‑specific systems.
Subcontractor and fabricator leverage
Local fabricators, construction firms and niche consultants can acquire leverage in regional booms as capacity utilization often exceeds 85%, driving rate inflation and schedule risk; subcontractor dayrates have been reported to rise 20–40% in peak regions. Local-content rules in some jurisdictions mandate 30–60% domestic sourcing, forcing supplier selection. Framework agreements and early contractor involvement reduce variability and cap contingency premiums.
Data, permits, and site access
Geotech data, permits, and site access controlled by local authorities greatly influence Worley project execution; industry benchmarks in 2024 put site investigation at roughly 0.5–1.5% of capex and permit timelines from weeks to over a year depending on jurisdiction.
Delays or restrictive terms frequently raise costs and schedule risk; reported cost uplifts from permitting delays range broadly but commonly add single- to low-double-digit percent to capex.
Partnerships with authorities and communities become quasi-supply dependencies, so early engagement and contingency planning are essential to mitigate 2024-era regulatory and logistical bottlenecks.
- Geotech data: 0.5–1.5% of capex (2024 industry benchmark)
- Permit timelines: weeks to >1 year (jurisdiction-dependent)
- Cost uplift: common single- to low-double-digit percent from delays
- Mitigation: early engagement + contingency planning
ESG-compliant inputs
- Limited availability -> higher supplier leverage
- Premiums ~5–15% in 2024
- ~60% of large clients require ESG credentials (2024)
- Supplier development and verified procurement lower exposure
Supplier power raises costs: subcontractor 20–40%, ESG premiums 5–15%, ~60% ESG mandates
Supplier power is high: scarce engineering talent and certified OEMs drive wage inflation and long lead times, with Worley noting 2024 employee cost pressures and subcontractor dayrate rises of 20–40% in peaks. ESG inputs carry 5–15% premiums and ~60% client ESG procurement mandates in 2024, while permits and geotech (0.5–1.5% of capex) create schedule risk and single- to low-double-digit capex uplifts.
| Metric | 2024 Benchmark |
|---|---|
| Geotech share of capex | 0.5–1.5% |
| Permit timelines | weeks to >1 year |
| Subcontractor rate rise | 20–40% (peaks) |
| ESG input premium | 5–15% |
| Clients requiring ESG creds | ~60% |
What is included in the product
Detailed Word Document
Tailored Porter’s Five Forces analysis for Worley, uncovering competitive intensity, supplier and buyer power, entry barriers, and substitute threats, with strategic commentary to inform investor and management decisions.
Customizable Excel Spreadsheet
Worley Porter’s Five Forces Analysis condenses competitive pressures into a single, actionable one-sheet so teams can quickly pinpoint strategic pain points and prioritize fixes. Toggle scenarios, swap in live data, and export clean visuals for decks—no complex setup required.
Customers Bargaining Power
Concentrated blue-chip clients
IOCs, NOCs, chemical majors and large miners wield concentrated buying power with sophisticated procurement teams that demand competitive pricing, robust risk transfer and stringent KPIs; top clients often hold more than 50% of near-term project pipelines. Their brand and pipeline control translate into strong bargaining leverage, compressing margins on single projects. Multi-year frameworks (typically 3–5 years) are used to trade volume for price concessions, stabilizing revenues and procurement cycles in 2024.
Competitive tendering norms
Open tenders, panel rosters and bid benchmarking (typically 3–5 shortlisted bidders) intensify price pressure and drive margins down, with buyers regularly splitting scopes to keep competitive tension. Differentiation via safety records, digital delivery and sustainability credentials helps defend margins by shifting selection criteria beyond price. Securing pre-FEED to EPC continuity reduces re-bid risk by limiting scope rebids across project phases.
Switching costs moderate
Design handovers and common data standards in 2024 enable clients to switch between EPC/EPCM providers, reducing barriers; however late-stage transitions carry schedule and warranty risks and can jeopardize project timelines. Strong project controls and proprietary know-how raise client stickiness, and warranty periods commonly range 1–5 years. Performance history remains the dominant factor in renewals.
Outcome and risk allocation
Buyers increasingly demand lump-sum and performance guarantees, shifting construction and delivery risk onto EPC contractors and pressuring margins; industry notes lump-sum projects often drive single-digit EPC margins in recent years. Alliance or reimbursable models mitigate margin compression but require high trust and transparency, with owners demanding detailed cost visibility. Robust risk management and precise pricing of transfered risks are pivotal to avoid margin erosion and dispute escalation.
- Buyers: push lump-sum & performance guarantees
- Risk: transfers can compress margins to single digits
- Models: alliance/reimbursable ease pressure but need trust
- Negotiations: robust risk management is essential
Energy-transition mandates
Clients increasingly tie awards to decarbonization pathways and measurable ESG outcomes, raising qualification hurdles and compliance costs as firms must meet taxonomy and reporting demands such as the EU CSRD affecting ~50,000 companies from 2024; those compliant win clear preference. Advisory-to-delivery integration boosts win probability and pricing power by aligning strategy with on-the-ground execution.
- Clients: awards conditional on decarbonization
- Compliance: CSRD ~50,000 firms (2024)
- Barrier: higher qualification and reporting costs
- Advantage: advisory-to-delivery = better wins/pricing
Top clients hold >50% pipeline, 3-5 bidders, EPC margins single-digit; CSRD ~50,000 firms
Major IOCs/NOCs/majors hold concentrated buying power (>50% of near-term pipeline), driving tight pricing, strict KPIs and multi-year frameworks (3–5y) that compress single-project margins. Open tenders (3–5 shortlisted) and lump-sum demands have pushed EPC margins to single digits in 2024. ESG/CSRD compliance (~50,000 firms) raises qualification costs but boosts award probability for compliant firms.
| Metric | 2024 |
|---|---|
| Top-client pipeline share | >50% |
| Shortlisted bidders | 3–5 |
| Typical warranties | 1–5 yrs |
| Typical EPC margins | Single-digit |
| CSRD scope | ~50,000 firms |
Full Version Awaits
Worley Porter's Five Forces Analysis
This Worley Porter's Five Forces Analysis preview is the exact document you'll receive immediately after purchase—no placeholders or mockups. It contains the full, professionally formatted assessment ready for download and use the moment you buy. What you see here is precisely the deliverable you'll get.
Original: $10.00
-65%$10.00
$3.50Description
Go Beyond the Preview—Access the Full Strategic Report
Worley faces intense supplier and buyer pressures, evolving substitute threats, and moderate entry barriers that shape its strategic outlook; this snapshot highlights key tensions and opportunities. Ready to move beyond the basics? Unlock the full Porter's Five Forces Analysis to see force-by-force ratings, visuals, and actionable insights tailored to Worley.
Suppliers Bargaining Power
Scarce specialist talent
Highly skilled engineers, process designers and project managers are scarce, giving recruiters leverage and driving wage inflation and retention bonuses that can reach double-digit percentages of base pay; Worley reported employee-related cost pressures in 2024 tied to talent retention.
Critical OEMs and tech vendors
Specialized compressors, subsea kits and design suites are concentrated among a few global OEMs, creating tight supply pools with lead times often 6–24 months and IP/certification lock‑ins that raise dependence. Strategic vendor alliances improve delivery but constrain bid flexibility and commercial terms. Dual‑sourcing and component standardization can reduce supplier power, but are frequently infeasible for bespoke, project‑specific systems.
Subcontractor and fabricator leverage
Local fabricators, construction firms and niche consultants can acquire leverage in regional booms as capacity utilization often exceeds 85%, driving rate inflation and schedule risk; subcontractor dayrates have been reported to rise 20–40% in peak regions. Local-content rules in some jurisdictions mandate 30–60% domestic sourcing, forcing supplier selection. Framework agreements and early contractor involvement reduce variability and cap contingency premiums.
Data, permits, and site access
Geotech data, permits, and site access controlled by local authorities greatly influence Worley project execution; industry benchmarks in 2024 put site investigation at roughly 0.5–1.5% of capex and permit timelines from weeks to over a year depending on jurisdiction.
Delays or restrictive terms frequently raise costs and schedule risk; reported cost uplifts from permitting delays range broadly but commonly add single- to low-double-digit percent to capex.
Partnerships with authorities and communities become quasi-supply dependencies, so early engagement and contingency planning are essential to mitigate 2024-era regulatory and logistical bottlenecks.
- Geotech data: 0.5–1.5% of capex (2024 industry benchmark)
- Permit timelines: weeks to >1 year (jurisdiction-dependent)
- Cost uplift: common single- to low-double-digit percent from delays
- Mitigation: early engagement + contingency planning
ESG-compliant inputs
- Limited availability -> higher supplier leverage
- Premiums ~5–15% in 2024
- ~60% of large clients require ESG credentials (2024)
- Supplier development and verified procurement lower exposure
Supplier power raises costs: subcontractor 20–40%, ESG premiums 5–15%, ~60% ESG mandates
Supplier power is high: scarce engineering talent and certified OEMs drive wage inflation and long lead times, with Worley noting 2024 employee cost pressures and subcontractor dayrate rises of 20–40% in peaks. ESG inputs carry 5–15% premiums and ~60% client ESG procurement mandates in 2024, while permits and geotech (0.5–1.5% of capex) create schedule risk and single- to low-double-digit capex uplifts.
| Metric | 2024 Benchmark |
|---|---|
| Geotech share of capex | 0.5–1.5% |
| Permit timelines | weeks to >1 year |
| Subcontractor rate rise | 20–40% (peaks) |
| ESG input premium | 5–15% |
| Clients requiring ESG creds | ~60% |
What is included in the product
Detailed Word Document
Tailored Porter’s Five Forces analysis for Worley, uncovering competitive intensity, supplier and buyer power, entry barriers, and substitute threats, with strategic commentary to inform investor and management decisions.
Customizable Excel Spreadsheet
Worley Porter’s Five Forces Analysis condenses competitive pressures into a single, actionable one-sheet so teams can quickly pinpoint strategic pain points and prioritize fixes. Toggle scenarios, swap in live data, and export clean visuals for decks—no complex setup required.
Customers Bargaining Power
Concentrated blue-chip clients
IOCs, NOCs, chemical majors and large miners wield concentrated buying power with sophisticated procurement teams that demand competitive pricing, robust risk transfer and stringent KPIs; top clients often hold more than 50% of near-term project pipelines. Their brand and pipeline control translate into strong bargaining leverage, compressing margins on single projects. Multi-year frameworks (typically 3–5 years) are used to trade volume for price concessions, stabilizing revenues and procurement cycles in 2024.
Competitive tendering norms
Open tenders, panel rosters and bid benchmarking (typically 3–5 shortlisted bidders) intensify price pressure and drive margins down, with buyers regularly splitting scopes to keep competitive tension. Differentiation via safety records, digital delivery and sustainability credentials helps defend margins by shifting selection criteria beyond price. Securing pre-FEED to EPC continuity reduces re-bid risk by limiting scope rebids across project phases.
Switching costs moderate
Design handovers and common data standards in 2024 enable clients to switch between EPC/EPCM providers, reducing barriers; however late-stage transitions carry schedule and warranty risks and can jeopardize project timelines. Strong project controls and proprietary know-how raise client stickiness, and warranty periods commonly range 1–5 years. Performance history remains the dominant factor in renewals.
Outcome and risk allocation
Buyers increasingly demand lump-sum and performance guarantees, shifting construction and delivery risk onto EPC contractors and pressuring margins; industry notes lump-sum projects often drive single-digit EPC margins in recent years. Alliance or reimbursable models mitigate margin compression but require high trust and transparency, with owners demanding detailed cost visibility. Robust risk management and precise pricing of transfered risks are pivotal to avoid margin erosion and dispute escalation.
- Buyers: push lump-sum & performance guarantees
- Risk: transfers can compress margins to single digits
- Models: alliance/reimbursable ease pressure but need trust
- Negotiations: robust risk management is essential
Energy-transition mandates
Clients increasingly tie awards to decarbonization pathways and measurable ESG outcomes, raising qualification hurdles and compliance costs as firms must meet taxonomy and reporting demands such as the EU CSRD affecting ~50,000 companies from 2024; those compliant win clear preference. Advisory-to-delivery integration boosts win probability and pricing power by aligning strategy with on-the-ground execution.
- Clients: awards conditional on decarbonization
- Compliance: CSRD ~50,000 firms (2024)
- Barrier: higher qualification and reporting costs
- Advantage: advisory-to-delivery = better wins/pricing
Top clients hold >50% pipeline, 3-5 bidders, EPC margins single-digit; CSRD ~50,000 firms
Major IOCs/NOCs/majors hold concentrated buying power (>50% of near-term pipeline), driving tight pricing, strict KPIs and multi-year frameworks (3–5y) that compress single-project margins. Open tenders (3–5 shortlisted) and lump-sum demands have pushed EPC margins to single digits in 2024. ESG/CSRD compliance (~50,000 firms) raises qualification costs but boosts award probability for compliant firms.
| Metric | 2024 |
|---|---|
| Top-client pipeline share | >50% |
| Shortlisted bidders | 3–5 |
| Typical warranties | 1–5 yrs |
| Typical EPC margins | Single-digit |
| CSRD scope | ~50,000 firms |
Full Version Awaits
Worley Porter's Five Forces Analysis
This Worley Porter's Five Forces Analysis preview is the exact document you'll receive immediately after purchase—no placeholders or mockups. It contains the full, professionally formatted assessment ready for download and use the moment you buy. What you see here is precisely the deliverable you'll get.











