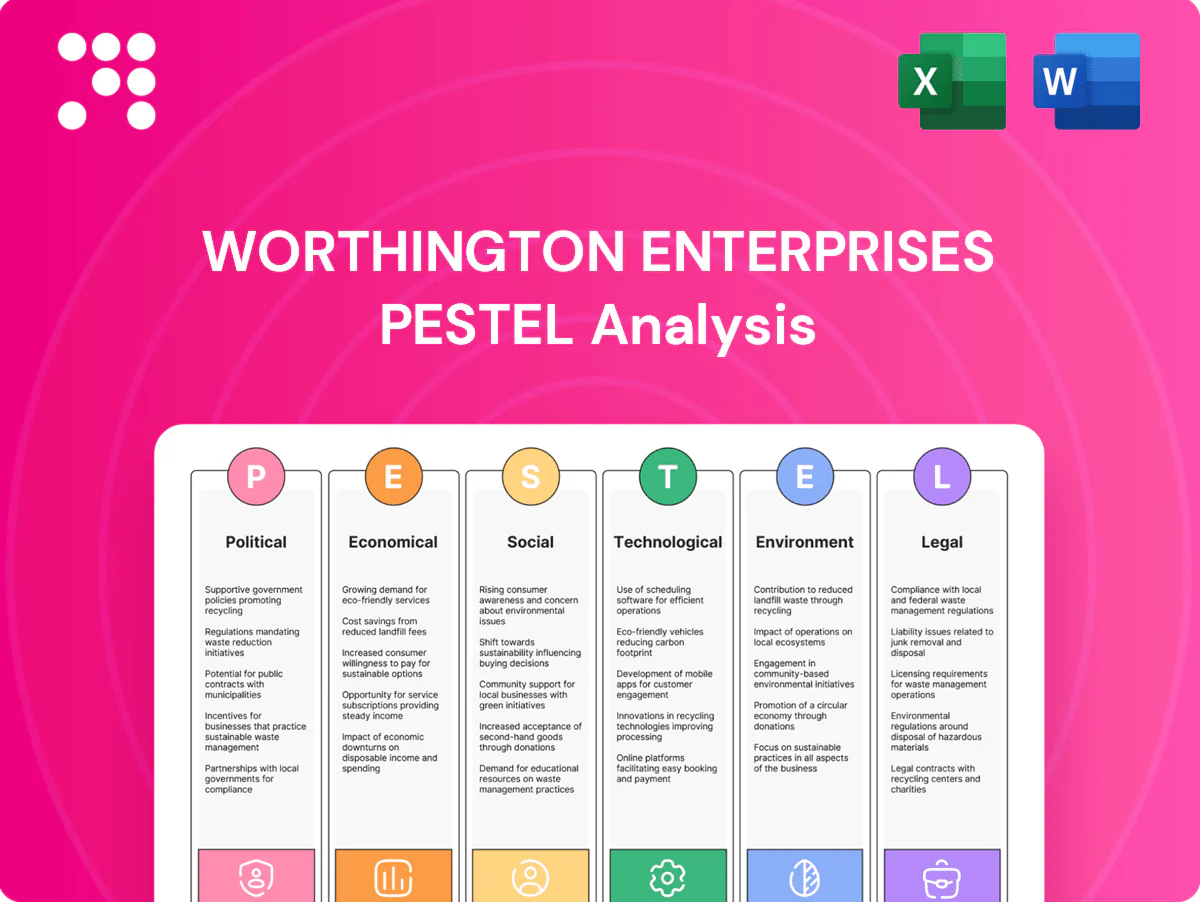
Worthington Enterprises PESTLE Analysis

Your Competitive Advantage Starts with This Report
Gain competitive clarity with our PESTLE analysis of Worthington Enterprises—concise examination of political, economic, social, technological, legal and environmental forces shaping the company’s strategy. Ideal for investors, strategists and consultants, it highlights regulatory risks, market opportunities and technology drivers you can act on immediately. Purchase the full, fully editable report to access data-driven recommendations and ready-to-use slides for boardrooms and pitches.
Political factors

Infrastructure spending
Government-funded infrastructure and housing programs can boost demand for Worthington’s water systems and architectural products as the Bipartisan Infrastructure Law committed roughly 550 billion in new federal investment and the Inflation Reduction Act adds about 369 billion for climate and clean infrastructure. Stimulus and green public-works funding accelerate project pipelines with billions flowing to water and building projects. Shifts in budget priorities or election cycles can delay orders, so monitoring federal, state and municipal allocations is essential.
Trade policy and tariffs
Tariffs such as US Section 232 measures (25% on steel, 10% on aluminum) materially raise input costs and compress margins for Worthington Enterprises’ metal-intensive products. Trade disputes (US‑China tariffs, ongoing since 2018) have repeatedly disrupted cross‑border supply chains for both components and finished goods. Preferential deals like USMCA expand tariff‑free North American access, enabling market growth. Diversifying suppliers across North America and Southeast Asia reduces exposure to tariff shocks and single‑country disruption.

Buy American incentives
Domestic content rules under Executive Order 14005 and Build America Buy America (IIJA: $1.2 trillion total, $550 billion new) tilt public projects toward U.S.-made building products, potentially boosting Worthington’s domestic sales. Compliance and certification (Buy American waivers, origin documentation) add administrative overhead and cost. Local manufacturing increases bid competitiveness and can cut lead times by weeks; federal contracting topped roughly $665 billion in 2023, so policy shifts could materially expand or narrow eligibility.

Local permitting and codes
Regional permitting, zoning, and procurement practices directly shape Worthington Enterprises project starts by defining allowable scopes and tender windows; municipal standards for water systems and mobility infrastructure dictate technical specifications and materials. Fragmentation across jurisdictions raises customization and compliance costs and extends timelines, while strong local relationships and pre-submission engagement consistently speed approvals and reduce change orders.
- Regional permitting impacts project timing
- Municipal standards drive specs
- Fragmentation increases costs
- Local relationships accelerate approvals
Geopolitical supply risks
Conflict, sanctions, and export controls can curtail access to critical inputs and markets, forcing Worthington to reroute supply lines; Drewry reported container freight rates averaged about 35% above 2019 levels in 2024. Logistics corridors face bottlenecks and security premiums, with war-risk insurance spikes—Lloyd's noted premiums rose up to 300% in Black Sea routes in 2022. Inventory buffers, dual-sourcing, and insurance/hedging strategies are therefore essential to limit revenue and production volatility.
- Supply cuts from sanctions
- Logistics bottlenecks & premiums
- Inventory & dual-sourcing critical
- Insurance/hedging mitigates losses
IIJA $550B & IRA $369B lift demand; tariffs 25%/10% and +35% logistics add costs
Federal funding (IIJA ~$550B, IRA ~$369B) and $665B federal contracting in 2023 boost demand for Worthington’s water/building products, though election and budget shifts can delay orders. Tariffs (Section 232: 25% steel, 10% aluminum) plus sanctions raise input costs; 2024 container rates ~35% above 2019. Buy America favors domestic suppliers, increasing compliance costs but improving bid competitiveness.
| Factor | Metric | Impact |
|---|---|---|
| Federal funding | IIJA $550B; IRA $369B | Demand up |
| Tariffs | 25% steel; 10% Al | Cost pressure |
| Logistics | +35% rates vs 2019 (2024) | Supply risk |
What is included in the product
 Detailed Word Document
Explores how Political, Economic, Social, Technological, Environmental and Legal forces uniquely impact Worthington Enterprises, with data-backed trends and region- and industry-specific examples. Designed for executives and investors, it delivers forward-looking insights to spot risks, opportunities and inform strategic planning.

 Customizable Excel Spreadsheet
A concise, visually segmented PESTLE summary for Worthington Enterprises that streamlines external risk review and market positioning, easily editable for local context and drop‑in ready for presentations or team alignment.
Economic factors

Housing cycle sensitivity
Residential new builds and renovations drive Worthington Enterprises' volumes: US housing starts averaged about 1.3 million units annualized in 2024 (US Census Bureau), so downturns cut orders while recoveries amplify demand.
Regional housing dynamics (Sun Belt strength vs. Northeast softness in 2024) create mixed market performance for Worthington's distribution footprint.
Aftermarket repair and replace activity helps cushion cyclicality, supporting steady revenues even when starts dip.
Interest rates and credit
Higher policy rates (Fed funds around 5.25–5.50% in 2024) and a 30-year mortgage average of 7.07% in 2024 (Freddie Mac) raise homeowner borrowing costs and slow construction activity. Higher consumer financing costs suppress big-ticket outdoor and home purchases. Tight credit increases working capital needs as inventory and receivables rise. Rate cuts historically revive demand within months.

Input commodity volatility
Steel, aluminum, resins and energy experienced double‑digit price swings across 2023–24, exerting margin pressure on Worthington Enterprises as input costs intermittently rose by 10–40% in some feedstocks. Surcharges, hedging programs and dynamic pricing have partly protected profitability, with indexed supplier contracts smoothing pass‑throughs. Long or static contracts and indexation reduce volatility exposure, but rapid commodity moves still risk timing mismatches between cost increases and price realization.

Labor availability and wages
Retail channel dynamics
Retail-channel dynamics for Worthington hinge on big-box, e-commerce and seasonal sell-through; US e-commerce comprised about 16% of retail sales in 2023 (US Census Bureau), amplifying online exposure. Retailer inventory resets drive short-term volatility in orders and revenue, while rising private-label penetration pressures pricing and margins. Strong omni-channel execution sustains steady velocities and customer retention.
- Channel mix: big-box/e-comm/seasonal
- Inventory resets: short-term volatility
- Private-label: pricing pressure
- Omni-channel: steadier velocities
IIJA $550B & IRA $369B lift demand; tariffs 25%/10% and +35% logistics add costs
Housing starts ~1.3M (2024) drive volumes; regional Sun Belt strength vs Northeast softness creates mixed demand. Fed funds 5.25–5.50% and 30‑yr mortgage 7.07% (2024) raise borrowing costs, dampening construction and big‑ticket sales. Input costs swung 10–40% (2023–24), squeezing margins despite surcharges and hedges. Unemployment ~3.9% (2024) lifts wages and installation premiums.
| Metric | Value (2024) |
|---|---|
| Housing starts | ~1.3M |
| Fed funds | 5.25–5.50% |
| 30‑yr mortgage | 7.07% |
| Unemployment | 3.9% |
| Input swings | 10–40% |
Full Version Awaits
Worthington Enterprises PESTLE Analysis
The Worthington Enterprises PESTLE Analysis preview shown here is the exact document you’ll receive after purchase—fully formatted and ready to use. It includes political, economic, social, technological, legal, and environmental insights with professional structure and no placeholders.

Your Competitive Advantage Starts with This Report
Gain competitive clarity with our PESTLE analysis of Worthington Enterprises—concise examination of political, economic, social, technological, legal and environmental forces shaping the company’s strategy. Ideal for investors, strategists and consultants, it highlights regulatory risks, market opportunities and technology drivers you can act on immediately. Purchase the full, fully editable report to access data-driven recommendations and ready-to-use slides for boardrooms and pitches.
Political factors
Infrastructure spending
Government-funded infrastructure and housing programs can boost demand for Worthington’s water systems and architectural products as the Bipartisan Infrastructure Law committed roughly 550 billion in new federal investment and the Inflation Reduction Act adds about 369 billion for climate and clean infrastructure. Stimulus and green public-works funding accelerate project pipelines with billions flowing to water and building projects. Shifts in budget priorities or election cycles can delay orders, so monitoring federal, state and municipal allocations is essential.
Trade policy and tariffs
Tariffs such as US Section 232 measures (25% on steel, 10% on aluminum) materially raise input costs and compress margins for Worthington Enterprises’ metal-intensive products. Trade disputes (US‑China tariffs, ongoing since 2018) have repeatedly disrupted cross‑border supply chains for both components and finished goods. Preferential deals like USMCA expand tariff‑free North American access, enabling market growth. Diversifying suppliers across North America and Southeast Asia reduces exposure to tariff shocks and single‑country disruption.
Buy American incentives
Domestic content rules under Executive Order 14005 and Build America Buy America (IIJA: $1.2 trillion total, $550 billion new) tilt public projects toward U.S.-made building products, potentially boosting Worthington’s domestic sales. Compliance and certification (Buy American waivers, origin documentation) add administrative overhead and cost. Local manufacturing increases bid competitiveness and can cut lead times by weeks; federal contracting topped roughly $665 billion in 2023, so policy shifts could materially expand or narrow eligibility.
Local permitting and codes
Regional permitting, zoning, and procurement practices directly shape Worthington Enterprises project starts by defining allowable scopes and tender windows; municipal standards for water systems and mobility infrastructure dictate technical specifications and materials. Fragmentation across jurisdictions raises customization and compliance costs and extends timelines, while strong local relationships and pre-submission engagement consistently speed approvals and reduce change orders.
- Regional permitting impacts project timing
- Municipal standards drive specs
- Fragmentation increases costs
- Local relationships accelerate approvals
Geopolitical supply risks
Conflict, sanctions, and export controls can curtail access to critical inputs and markets, forcing Worthington to reroute supply lines; Drewry reported container freight rates averaged about 35% above 2019 levels in 2024. Logistics corridors face bottlenecks and security premiums, with war-risk insurance spikes—Lloyd's noted premiums rose up to 300% in Black Sea routes in 2022. Inventory buffers, dual-sourcing, and insurance/hedging strategies are therefore essential to limit revenue and production volatility.
- Supply cuts from sanctions
- Logistics bottlenecks & premiums
- Inventory & dual-sourcing critical
- Insurance/hedging mitigates losses
IIJA $550B & IRA $369B lift demand; tariffs 25%/10% and +35% logistics add costs
Federal funding (IIJA ~$550B, IRA ~$369B) and $665B federal contracting in 2023 boost demand for Worthington’s water/building products, though election and budget shifts can delay orders. Tariffs (Section 232: 25% steel, 10% aluminum) plus sanctions raise input costs; 2024 container rates ~35% above 2019. Buy America favors domestic suppliers, increasing compliance costs but improving bid competitiveness.
| Factor | Metric | Impact |
|---|---|---|
| Federal funding | IIJA $550B; IRA $369B | Demand up |
| Tariffs | 25% steel; 10% Al | Cost pressure |
| Logistics | +35% rates vs 2019 (2024) | Supply risk |
What is included in the product
Detailed Word Document
Explores how Political, Economic, Social, Technological, Environmental and Legal forces uniquely impact Worthington Enterprises, with data-backed trends and region- and industry-specific examples. Designed for executives and investors, it delivers forward-looking insights to spot risks, opportunities and inform strategic planning.
Customizable Excel Spreadsheet
A concise, visually segmented PESTLE summary for Worthington Enterprises that streamlines external risk review and market positioning, easily editable for local context and drop‑in ready for presentations or team alignment.
Economic factors
Housing cycle sensitivity
Residential new builds and renovations drive Worthington Enterprises' volumes: US housing starts averaged about 1.3 million units annualized in 2024 (US Census Bureau), so downturns cut orders while recoveries amplify demand.
Regional housing dynamics (Sun Belt strength vs. Northeast softness in 2024) create mixed market performance for Worthington's distribution footprint.
Aftermarket repair and replace activity helps cushion cyclicality, supporting steady revenues even when starts dip.
Interest rates and credit
Higher policy rates (Fed funds around 5.25–5.50% in 2024) and a 30-year mortgage average of 7.07% in 2024 (Freddie Mac) raise homeowner borrowing costs and slow construction activity. Higher consumer financing costs suppress big-ticket outdoor and home purchases. Tight credit increases working capital needs as inventory and receivables rise. Rate cuts historically revive demand within months.
Input commodity volatility
Steel, aluminum, resins and energy experienced double‑digit price swings across 2023–24, exerting margin pressure on Worthington Enterprises as input costs intermittently rose by 10–40% in some feedstocks. Surcharges, hedging programs and dynamic pricing have partly protected profitability, with indexed supplier contracts smoothing pass‑throughs. Long or static contracts and indexation reduce volatility exposure, but rapid commodity moves still risk timing mismatches between cost increases and price realization.
Labor availability and wages
Retail channel dynamics
Retail-channel dynamics for Worthington hinge on big-box, e-commerce and seasonal sell-through; US e-commerce comprised about 16% of retail sales in 2023 (US Census Bureau), amplifying online exposure. Retailer inventory resets drive short-term volatility in orders and revenue, while rising private-label penetration pressures pricing and margins. Strong omni-channel execution sustains steady velocities and customer retention.
- Channel mix: big-box/e-comm/seasonal
- Inventory resets: short-term volatility
- Private-label: pricing pressure
- Omni-channel: steadier velocities
IIJA $550B & IRA $369B lift demand; tariffs 25%/10% and +35% logistics add costs
Housing starts ~1.3M (2024) drive volumes; regional Sun Belt strength vs Northeast softness creates mixed demand. Fed funds 5.25–5.50% and 30‑yr mortgage 7.07% (2024) raise borrowing costs, dampening construction and big‑ticket sales. Input costs swung 10–40% (2023–24), squeezing margins despite surcharges and hedges. Unemployment ~3.9% (2024) lifts wages and installation premiums.
| Metric | Value (2024) |
|---|---|
| Housing starts | ~1.3M |
| Fed funds | 5.25–5.50% |
| 30‑yr mortgage | 7.07% |
| Unemployment | 3.9% |
| Input swings | 10–40% |
Full Version Awaits
Worthington Enterprises PESTLE Analysis
The Worthington Enterprises PESTLE Analysis preview shown here is the exact document you’ll receive after purchase—fully formatted and ready to use. It includes political, economic, social, technological, legal, and environmental insights with professional structure and no placeholders.
Description
Your Competitive Advantage Starts with This Report
Gain competitive clarity with our PESTLE analysis of Worthington Enterprises—concise examination of political, economic, social, technological, legal and environmental forces shaping the company’s strategy. Ideal for investors, strategists and consultants, it highlights regulatory risks, market opportunities and technology drivers you can act on immediately. Purchase the full, fully editable report to access data-driven recommendations and ready-to-use slides for boardrooms and pitches.
Political factors
Infrastructure spending
Government-funded infrastructure and housing programs can boost demand for Worthington’s water systems and architectural products as the Bipartisan Infrastructure Law committed roughly 550 billion in new federal investment and the Inflation Reduction Act adds about 369 billion for climate and clean infrastructure. Stimulus and green public-works funding accelerate project pipelines with billions flowing to water and building projects. Shifts in budget priorities or election cycles can delay orders, so monitoring federal, state and municipal allocations is essential.
Trade policy and tariffs
Tariffs such as US Section 232 measures (25% on steel, 10% on aluminum) materially raise input costs and compress margins for Worthington Enterprises’ metal-intensive products. Trade disputes (US‑China tariffs, ongoing since 2018) have repeatedly disrupted cross‑border supply chains for both components and finished goods. Preferential deals like USMCA expand tariff‑free North American access, enabling market growth. Diversifying suppliers across North America and Southeast Asia reduces exposure to tariff shocks and single‑country disruption.
Buy American incentives
Domestic content rules under Executive Order 14005 and Build America Buy America (IIJA: $1.2 trillion total, $550 billion new) tilt public projects toward U.S.-made building products, potentially boosting Worthington’s domestic sales. Compliance and certification (Buy American waivers, origin documentation) add administrative overhead and cost. Local manufacturing increases bid competitiveness and can cut lead times by weeks; federal contracting topped roughly $665 billion in 2023, so policy shifts could materially expand or narrow eligibility.
Local permitting and codes
Regional permitting, zoning, and procurement practices directly shape Worthington Enterprises project starts by defining allowable scopes and tender windows; municipal standards for water systems and mobility infrastructure dictate technical specifications and materials. Fragmentation across jurisdictions raises customization and compliance costs and extends timelines, while strong local relationships and pre-submission engagement consistently speed approvals and reduce change orders.
- Regional permitting impacts project timing
- Municipal standards drive specs
- Fragmentation increases costs
- Local relationships accelerate approvals
Geopolitical supply risks
Conflict, sanctions, and export controls can curtail access to critical inputs and markets, forcing Worthington to reroute supply lines; Drewry reported container freight rates averaged about 35% above 2019 levels in 2024. Logistics corridors face bottlenecks and security premiums, with war-risk insurance spikes—Lloyd's noted premiums rose up to 300% in Black Sea routes in 2022. Inventory buffers, dual-sourcing, and insurance/hedging strategies are therefore essential to limit revenue and production volatility.
- Supply cuts from sanctions
- Logistics bottlenecks & premiums
- Inventory & dual-sourcing critical
- Insurance/hedging mitigates losses
IIJA $550B & IRA $369B lift demand; tariffs 25%/10% and +35% logistics add costs
Federal funding (IIJA ~$550B, IRA ~$369B) and $665B federal contracting in 2023 boost demand for Worthington’s water/building products, though election and budget shifts can delay orders. Tariffs (Section 232: 25% steel, 10% aluminum) plus sanctions raise input costs; 2024 container rates ~35% above 2019. Buy America favors domestic suppliers, increasing compliance costs but improving bid competitiveness.
| Factor | Metric | Impact |
|---|---|---|
| Federal funding | IIJA $550B; IRA $369B | Demand up |
| Tariffs | 25% steel; 10% Al | Cost pressure |
| Logistics | +35% rates vs 2019 (2024) | Supply risk |
What is included in the product
Detailed Word Document
Explores how Political, Economic, Social, Technological, Environmental and Legal forces uniquely impact Worthington Enterprises, with data-backed trends and region- and industry-specific examples. Designed for executives and investors, it delivers forward-looking insights to spot risks, opportunities and inform strategic planning.
Customizable Excel Spreadsheet
A concise, visually segmented PESTLE summary for Worthington Enterprises that streamlines external risk review and market positioning, easily editable for local context and drop‑in ready for presentations or team alignment.
Economic factors
Housing cycle sensitivity
Residential new builds and renovations drive Worthington Enterprises' volumes: US housing starts averaged about 1.3 million units annualized in 2024 (US Census Bureau), so downturns cut orders while recoveries amplify demand.
Regional housing dynamics (Sun Belt strength vs. Northeast softness in 2024) create mixed market performance for Worthington's distribution footprint.
Aftermarket repair and replace activity helps cushion cyclicality, supporting steady revenues even when starts dip.
Interest rates and credit
Higher policy rates (Fed funds around 5.25–5.50% in 2024) and a 30-year mortgage average of 7.07% in 2024 (Freddie Mac) raise homeowner borrowing costs and slow construction activity. Higher consumer financing costs suppress big-ticket outdoor and home purchases. Tight credit increases working capital needs as inventory and receivables rise. Rate cuts historically revive demand within months.
Input commodity volatility
Steel, aluminum, resins and energy experienced double‑digit price swings across 2023–24, exerting margin pressure on Worthington Enterprises as input costs intermittently rose by 10–40% in some feedstocks. Surcharges, hedging programs and dynamic pricing have partly protected profitability, with indexed supplier contracts smoothing pass‑throughs. Long or static contracts and indexation reduce volatility exposure, but rapid commodity moves still risk timing mismatches between cost increases and price realization.
Labor availability and wages
Retail channel dynamics
Retail-channel dynamics for Worthington hinge on big-box, e-commerce and seasonal sell-through; US e-commerce comprised about 16% of retail sales in 2023 (US Census Bureau), amplifying online exposure. Retailer inventory resets drive short-term volatility in orders and revenue, while rising private-label penetration pressures pricing and margins. Strong omni-channel execution sustains steady velocities and customer retention.
- Channel mix: big-box/e-comm/seasonal
- Inventory resets: short-term volatility
- Private-label: pricing pressure
- Omni-channel: steadier velocities
IIJA $550B & IRA $369B lift demand; tariffs 25%/10% and +35% logistics add costs
Housing starts ~1.3M (2024) drive volumes; regional Sun Belt strength vs Northeast softness creates mixed demand. Fed funds 5.25–5.50% and 30‑yr mortgage 7.07% (2024) raise borrowing costs, dampening construction and big‑ticket sales. Input costs swung 10–40% (2023–24), squeezing margins despite surcharges and hedges. Unemployment ~3.9% (2024) lifts wages and installation premiums.
| Metric | Value (2024) |
|---|---|
| Housing starts | ~1.3M |
| Fed funds | 5.25–5.50% |
| 30‑yr mortgage | 7.07% |
| Unemployment | 3.9% |
| Input swings | 10–40% |
Full Version Awaits
Worthington Enterprises PESTLE Analysis
The Worthington Enterprises PESTLE Analysis preview shown here is the exact document you’ll receive after purchase—fully formatted and ready to use. It includes political, economic, social, technological, legal, and environmental insights with professional structure and no placeholders.











