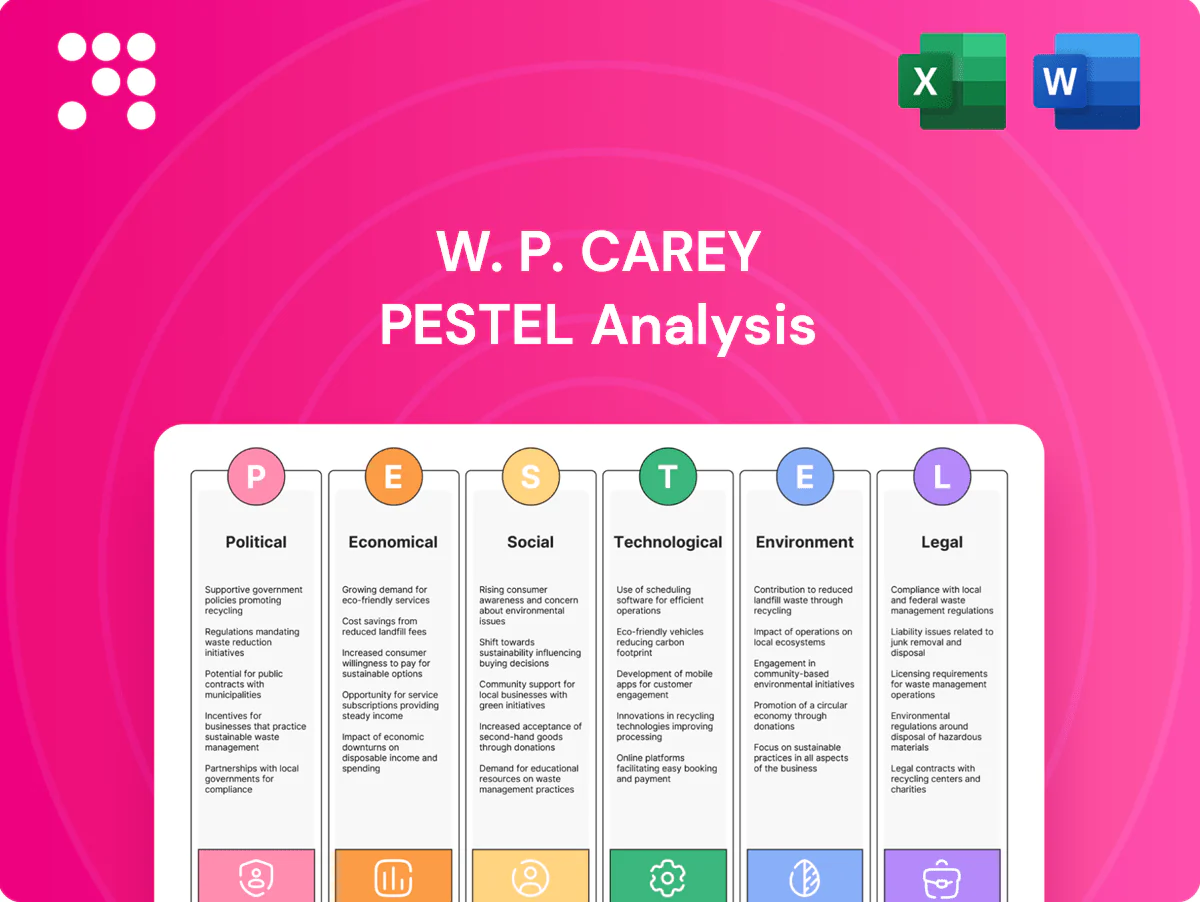
W. P. Carey PESTLE Analysis

Skip the Research. Get the Strategy.
Our W. P. Carey PESTLE Analysis reveals how political, economic, social, technological, legal, and environmental forces are reshaping the REIT’s strategy and risk profile. It highlights regulatory risks, interest-rate sensitivity, sustainability trends, and tech-driven asset management shifts. Purchase the full report for detailed, actionable insights and ready-to-use slides to inform investment or strategy decisions.
Political factors

REIT tax and fiscal policy stability
Changes to REIT-specific rules or shifts in the US federal corporate tax rate (currently 21%) and the OECD 15% global minimum tax can materially affect W. P. Carey’s after-tax returns and dividend capacity. Stable pass-through treatment supports investor demand and its roughly 6% dividend yield (mid-2025). Fiscal incentives for capital investment, such as targeted tax credits, can boost sale-leaseback pipelines. Deficit-driven tax hikes could narrow REIT advantages.
Zoning, permitting, and land-use governance
Municipal zoning and permitting regimes determine where W. P. Carey can place build-to-suit and industrial assets, with approvals often taking 6–18 months and delaying rent commencement. Protracted approvals raise carrying costs and can erode yields; in top logistics markets vacancy rates under 4% (2024) heighten political pressure and tighter siting rules. Differing local priorities force flexible site selection and proactive stakeholder engagement.

Cross-border investment and FDI controls
As a global portfolio owner with over 1,000 properties across about 25 countries, W. P. Carey faces policy shifts on foreign direct investment that materially influence acquisition timing and cost.
More than 150 jurisdictions maintain FDI screening or national security reviews, which can slow deals in sensitive sectors and delay closings.
Stable bilateral relations support predictable leasing, while political frictions raise compliance overhead, execution risk and transaction uncertainty.

Trade policy and industrial policy
Tariffs such as the ongoing Section 301 levies on roughly 350 billion dollars of China imports and pro-reshoring policies including the CHIPS Act (about 280 billion dollars) and IRA incentives (about 369 billion dollars) reshape tenant footprints, boosting demand for U.S. manufacturing and logistics real estate and supporting long-term net lease stability. Trade tensions can compress tenant revenues and covenant strength, raising credit and vacancy risk for W. P. Carey.
- Tariffs: Section 301 on ~350B imports
- Reshoring incentives: CHIPS ~$280B; IRA ~$369B
- Effect: uplifts demand for industrial/logistics space
- Risk: trade tensions can weaken tenant covenants
Infrastructure and public investment
Government spending on ports, highways and power grids enhances asset accessibility and tenant productivity; the 2021 Infrastructure Investment and Jobs Act (IIJA) mobilized about 1.2 trillion USD in federal infrastructure funding, underpinning logistics upgrades that can raise market rents and tenant retention. Underinvestment strains nodes and raises downtime risk, so location strategy must anticipate policy-driven infrastructure cycles.
- IIJA: 1.2 trillion USD national framework
- Better connectivity → higher rents/retention
- Underinvestment → increased logistics downtime
- Strategy must align with policy cycles
US 21% tax, OECD 15%, REIT pass-through backs ~6% yield; FDI 150+ juris, 6-18m delays
US 21% federal rate and OECD 15% minimum, plus pass-through REIT status, support W. P. Carey’s ~6% dividend (mid-2025) and after-tax returns. FDI screening in 150+ jurisdictions and 6–18 month local permits delay deals across 1,000+ properties in ~25 countries. Tariffs/reshoring (Section 301 ~$350B; CHIPS ~$280B; IRA ~$369B) boost US logistics demand.
| Risk | Metric |
|---|---|
| Tax | US21%/OECD15% |
| FDI/Permits | 150+ jurisdictions / 6–18m |
| Policy | Section301~$350B; CHIPS~$280B; IRA~$369B |
What is included in the product
 Detailed Word Document
Explores how macro-environmental factors uniquely affect W. P. Carey across Political, Economic, Social, Technological, Environmental, and Legal dimensions, with data-backed trends and forward-looking insights; designed for executives and investors to identify risks, opportunities, and strategic responses, ready for integration into reports and decks.

 Customizable Excel Spreadsheet
A concise, visually segmented PESTLE summary of W. P. Carey that distills regulatory, economic, and market risks for quick inclusion in presentations or strategy sessions, helping teams align faster and reduce time spent parsing dense external analysis.
Economic factors

Interest rates and cost of capital
REIT valuations and acquisition yields are highly sensitive to benchmark rates: the Fed funds target stood at 5.25–5.50% and the 10-year Treasury near 4.1% in July 2025, which raises WACC and pressures yield spreads toward cap rates, slowing external growth and deal activity. Fixed-rate debt and laddered maturities help mitigate reprice volatility, while cyclical access to equity markets directly constrains pipeline execution.
Inflation and rent escalators
Long-term net leases with CPI or fixed escalators preserve real cash flows; US CPI averaged about 3.4% in 2024, supporting lease income escalation. High inflation benefits CPI-linked clauses but can compress tenant margins, especially for lower-credit operators. Calibrating escalators to tenant credit profiles lowers default risk, and a portfolio's lease mix—share of CPI-linked versus fixed escalators—drives inflation pass-through effectiveness.

Tenant credit cycle and default risk
Economic slowdowns elevate tenant credit risk across retail, office and industrial segments, contributing to higher restructuring and rent relief demands; industry CRE delinquencies rose notably in 2023–24. W. P. Carey’s diversification across roughly 1,350 properties in 27 countries cushions cash flows. Strong underwriting and master leases limit vacancy downtime and their reported portfolio occupancy near 98.6% sustains income. Proactive workouts preserve occupancy and asset value.

FX movements and global cash flows
Foreign-currency revenues and asset values expose W. P. Carey to translation and transaction risk, with its global portfolio of roughly 1,300 properties and ~ $20B of investments (2024) amplifying FX impact; hedging programs stabilize AFFO but carry explicit costs and basis risk. Currency swings alter relative market attractiveness for acquisitions, forcing portfolio allocation tradeoffs between yield and FX volatility.
- Translation/transaction risk: material for ~1,300-property, ~$20B portfolio (2024)
- Hedging: reduces AFFO volatility, adds cost
- Acquisitions: FX swings shift pricing and cap-rate appeal
- Allocation: balance yield vs FX exposure
Sectoral demand shifts
- e-commerce 15.5% (2024)
- industrial cap rate ~5.0% (2024)
- build-to-suit ~20% of deliveries (2024)
- office demand uneven
US 21% tax, OECD 15%, REIT pass-through backs ~6% yield; FDI 150+ juris, 6-18m delays
Higher benchmark rates (Fed 5.25–5.50% Jul 2025; 10y ~4.1%) raise WACC, slowing acquisitions; CPI ~3.4% (2024) supports CPI escalators but pressures tenant margins. Diversification (~1,300 properties, ~$20B 2024) and 98.6% occupancy cushion downturns; FX hedging reduces AFFO volatility. E-commerce 15.5% (2024) fuels industrial demand; industrial cap rates ~5.0% (2024).
| Metric | Value |
|---|---|
| Fed funds (Jul 2025) | 5.25–5.50% |
| 10y | ~4.1% |
| US CPI (2024) | 3.4% |
| Portfolio | ~1,300 props, ~$20B (2024) |
| Occupancy | 98.6% |
| E-commerce (2024) | 15.5% |
| Industrial cap rate (2024) | ~5.0% |
What You See Is What You Get
W. P. Carey PESTLE Analysis
The preview shown here is the exact W. P. Carey PESTLE Analysis you’ll receive after purchase—fully formatted and ready to use. It includes political, economic, social, technological, legal, and environmental insights tailored to W. P. Carey’s business. No placeholders or teasers; this is the final, downloadable file. Purchase delivers this exact document instantly.

Skip the Research. Get the Strategy.
Our W. P. Carey PESTLE Analysis reveals how political, economic, social, technological, legal, and environmental forces are reshaping the REIT’s strategy and risk profile. It highlights regulatory risks, interest-rate sensitivity, sustainability trends, and tech-driven asset management shifts. Purchase the full report for detailed, actionable insights and ready-to-use slides to inform investment or strategy decisions.
Political factors
REIT tax and fiscal policy stability
Changes to REIT-specific rules or shifts in the US federal corporate tax rate (currently 21%) and the OECD 15% global minimum tax can materially affect W. P. Carey’s after-tax returns and dividend capacity. Stable pass-through treatment supports investor demand and its roughly 6% dividend yield (mid-2025). Fiscal incentives for capital investment, such as targeted tax credits, can boost sale-leaseback pipelines. Deficit-driven tax hikes could narrow REIT advantages.
Zoning, permitting, and land-use governance
Municipal zoning and permitting regimes determine where W. P. Carey can place build-to-suit and industrial assets, with approvals often taking 6–18 months and delaying rent commencement. Protracted approvals raise carrying costs and can erode yields; in top logistics markets vacancy rates under 4% (2024) heighten political pressure and tighter siting rules. Differing local priorities force flexible site selection and proactive stakeholder engagement.
Cross-border investment and FDI controls
As a global portfolio owner with over 1,000 properties across about 25 countries, W. P. Carey faces policy shifts on foreign direct investment that materially influence acquisition timing and cost.
More than 150 jurisdictions maintain FDI screening or national security reviews, which can slow deals in sensitive sectors and delay closings.
Stable bilateral relations support predictable leasing, while political frictions raise compliance overhead, execution risk and transaction uncertainty.
Trade policy and industrial policy
Tariffs such as the ongoing Section 301 levies on roughly 350 billion dollars of China imports and pro-reshoring policies including the CHIPS Act (about 280 billion dollars) and IRA incentives (about 369 billion dollars) reshape tenant footprints, boosting demand for U.S. manufacturing and logistics real estate and supporting long-term net lease stability. Trade tensions can compress tenant revenues and covenant strength, raising credit and vacancy risk for W. P. Carey.
- Tariffs: Section 301 on ~350B imports
- Reshoring incentives: CHIPS ~$280B; IRA ~$369B
- Effect: uplifts demand for industrial/logistics space
- Risk: trade tensions can weaken tenant covenants
Infrastructure and public investment
Government spending on ports, highways and power grids enhances asset accessibility and tenant productivity; the 2021 Infrastructure Investment and Jobs Act (IIJA) mobilized about 1.2 trillion USD in federal infrastructure funding, underpinning logistics upgrades that can raise market rents and tenant retention. Underinvestment strains nodes and raises downtime risk, so location strategy must anticipate policy-driven infrastructure cycles.
- IIJA: 1.2 trillion USD national framework
- Better connectivity → higher rents/retention
- Underinvestment → increased logistics downtime
- Strategy must align with policy cycles
US 21% tax, OECD 15%, REIT pass-through backs ~6% yield; FDI 150+ juris, 6-18m delays
US 21% federal rate and OECD 15% minimum, plus pass-through REIT status, support W. P. Carey’s ~6% dividend (mid-2025) and after-tax returns. FDI screening in 150+ jurisdictions and 6–18 month local permits delay deals across 1,000+ properties in ~25 countries. Tariffs/reshoring (Section 301 ~$350B; CHIPS ~$280B; IRA ~$369B) boost US logistics demand.
| Risk | Metric |
|---|---|
| Tax | US21%/OECD15% |
| FDI/Permits | 150+ jurisdictions / 6–18m |
| Policy | Section301~$350B; CHIPS~$280B; IRA~$369B |
What is included in the product
Detailed Word Document
Explores how macro-environmental factors uniquely affect W. P. Carey across Political, Economic, Social, Technological, Environmental, and Legal dimensions, with data-backed trends and forward-looking insights; designed for executives and investors to identify risks, opportunities, and strategic responses, ready for integration into reports and decks.
Customizable Excel Spreadsheet
A concise, visually segmented PESTLE summary of W. P. Carey that distills regulatory, economic, and market risks for quick inclusion in presentations or strategy sessions, helping teams align faster and reduce time spent parsing dense external analysis.
Economic factors
Interest rates and cost of capital
REIT valuations and acquisition yields are highly sensitive to benchmark rates: the Fed funds target stood at 5.25–5.50% and the 10-year Treasury near 4.1% in July 2025, which raises WACC and pressures yield spreads toward cap rates, slowing external growth and deal activity. Fixed-rate debt and laddered maturities help mitigate reprice volatility, while cyclical access to equity markets directly constrains pipeline execution.
Inflation and rent escalators
Long-term net leases with CPI or fixed escalators preserve real cash flows; US CPI averaged about 3.4% in 2024, supporting lease income escalation. High inflation benefits CPI-linked clauses but can compress tenant margins, especially for lower-credit operators. Calibrating escalators to tenant credit profiles lowers default risk, and a portfolio's lease mix—share of CPI-linked versus fixed escalators—drives inflation pass-through effectiveness.
Tenant credit cycle and default risk
Economic slowdowns elevate tenant credit risk across retail, office and industrial segments, contributing to higher restructuring and rent relief demands; industry CRE delinquencies rose notably in 2023–24. W. P. Carey’s diversification across roughly 1,350 properties in 27 countries cushions cash flows. Strong underwriting and master leases limit vacancy downtime and their reported portfolio occupancy near 98.6% sustains income. Proactive workouts preserve occupancy and asset value.
FX movements and global cash flows
Foreign-currency revenues and asset values expose W. P. Carey to translation and transaction risk, with its global portfolio of roughly 1,300 properties and ~ $20B of investments (2024) amplifying FX impact; hedging programs stabilize AFFO but carry explicit costs and basis risk. Currency swings alter relative market attractiveness for acquisitions, forcing portfolio allocation tradeoffs between yield and FX volatility.
- Translation/transaction risk: material for ~1,300-property, ~$20B portfolio (2024)
- Hedging: reduces AFFO volatility, adds cost
- Acquisitions: FX swings shift pricing and cap-rate appeal
- Allocation: balance yield vs FX exposure
Sectoral demand shifts
- e-commerce 15.5% (2024)
- industrial cap rate ~5.0% (2024)
- build-to-suit ~20% of deliveries (2024)
- office demand uneven
US 21% tax, OECD 15%, REIT pass-through backs ~6% yield; FDI 150+ juris, 6-18m delays
Higher benchmark rates (Fed 5.25–5.50% Jul 2025; 10y ~4.1%) raise WACC, slowing acquisitions; CPI ~3.4% (2024) supports CPI escalators but pressures tenant margins. Diversification (~1,300 properties, ~$20B 2024) and 98.6% occupancy cushion downturns; FX hedging reduces AFFO volatility. E-commerce 15.5% (2024) fuels industrial demand; industrial cap rates ~5.0% (2024).
| Metric | Value |
|---|---|
| Fed funds (Jul 2025) | 5.25–5.50% |
| 10y | ~4.1% |
| US CPI (2024) | 3.4% |
| Portfolio | ~1,300 props, ~$20B (2024) |
| Occupancy | 98.6% |
| E-commerce (2024) | 15.5% |
| Industrial cap rate (2024) | ~5.0% |
What You See Is What You Get
W. P. Carey PESTLE Analysis
The preview shown here is the exact W. P. Carey PESTLE Analysis you’ll receive after purchase—fully formatted and ready to use. It includes political, economic, social, technological, legal, and environmental insights tailored to W. P. Carey’s business. No placeholders or teasers; this is the final, downloadable file. Purchase delivers this exact document instantly.
Original: $10.00
-65%$10.00
$3.50Description
Skip the Research. Get the Strategy.
Our W. P. Carey PESTLE Analysis reveals how political, economic, social, technological, legal, and environmental forces are reshaping the REIT’s strategy and risk profile. It highlights regulatory risks, interest-rate sensitivity, sustainability trends, and tech-driven asset management shifts. Purchase the full report for detailed, actionable insights and ready-to-use slides to inform investment or strategy decisions.
Political factors
REIT tax and fiscal policy stability
Changes to REIT-specific rules or shifts in the US federal corporate tax rate (currently 21%) and the OECD 15% global minimum tax can materially affect W. P. Carey’s after-tax returns and dividend capacity. Stable pass-through treatment supports investor demand and its roughly 6% dividend yield (mid-2025). Fiscal incentives for capital investment, such as targeted tax credits, can boost sale-leaseback pipelines. Deficit-driven tax hikes could narrow REIT advantages.
Zoning, permitting, and land-use governance
Municipal zoning and permitting regimes determine where W. P. Carey can place build-to-suit and industrial assets, with approvals often taking 6–18 months and delaying rent commencement. Protracted approvals raise carrying costs and can erode yields; in top logistics markets vacancy rates under 4% (2024) heighten political pressure and tighter siting rules. Differing local priorities force flexible site selection and proactive stakeholder engagement.
Cross-border investment and FDI controls
As a global portfolio owner with over 1,000 properties across about 25 countries, W. P. Carey faces policy shifts on foreign direct investment that materially influence acquisition timing and cost.
More than 150 jurisdictions maintain FDI screening or national security reviews, which can slow deals in sensitive sectors and delay closings.
Stable bilateral relations support predictable leasing, while political frictions raise compliance overhead, execution risk and transaction uncertainty.
Trade policy and industrial policy
Tariffs such as the ongoing Section 301 levies on roughly 350 billion dollars of China imports and pro-reshoring policies including the CHIPS Act (about 280 billion dollars) and IRA incentives (about 369 billion dollars) reshape tenant footprints, boosting demand for U.S. manufacturing and logistics real estate and supporting long-term net lease stability. Trade tensions can compress tenant revenues and covenant strength, raising credit and vacancy risk for W. P. Carey.
- Tariffs: Section 301 on ~350B imports
- Reshoring incentives: CHIPS ~$280B; IRA ~$369B
- Effect: uplifts demand for industrial/logistics space
- Risk: trade tensions can weaken tenant covenants
Infrastructure and public investment
Government spending on ports, highways and power grids enhances asset accessibility and tenant productivity; the 2021 Infrastructure Investment and Jobs Act (IIJA) mobilized about 1.2 trillion USD in federal infrastructure funding, underpinning logistics upgrades that can raise market rents and tenant retention. Underinvestment strains nodes and raises downtime risk, so location strategy must anticipate policy-driven infrastructure cycles.
- IIJA: 1.2 trillion USD national framework
- Better connectivity → higher rents/retention
- Underinvestment → increased logistics downtime
- Strategy must align with policy cycles
US 21% tax, OECD 15%, REIT pass-through backs ~6% yield; FDI 150+ juris, 6-18m delays
US 21% federal rate and OECD 15% minimum, plus pass-through REIT status, support W. P. Carey’s ~6% dividend (mid-2025) and after-tax returns. FDI screening in 150+ jurisdictions and 6–18 month local permits delay deals across 1,000+ properties in ~25 countries. Tariffs/reshoring (Section 301 ~$350B; CHIPS ~$280B; IRA ~$369B) boost US logistics demand.
| Risk | Metric |
|---|---|
| Tax | US21%/OECD15% |
| FDI/Permits | 150+ jurisdictions / 6–18m |
| Policy | Section301~$350B; CHIPS~$280B; IRA~$369B |
What is included in the product
Detailed Word Document
Explores how macro-environmental factors uniquely affect W. P. Carey across Political, Economic, Social, Technological, Environmental, and Legal dimensions, with data-backed trends and forward-looking insights; designed for executives and investors to identify risks, opportunities, and strategic responses, ready for integration into reports and decks.
Customizable Excel Spreadsheet
A concise, visually segmented PESTLE summary of W. P. Carey that distills regulatory, economic, and market risks for quick inclusion in presentations or strategy sessions, helping teams align faster and reduce time spent parsing dense external analysis.
Economic factors
Interest rates and cost of capital
REIT valuations and acquisition yields are highly sensitive to benchmark rates: the Fed funds target stood at 5.25–5.50% and the 10-year Treasury near 4.1% in July 2025, which raises WACC and pressures yield spreads toward cap rates, slowing external growth and deal activity. Fixed-rate debt and laddered maturities help mitigate reprice volatility, while cyclical access to equity markets directly constrains pipeline execution.
Inflation and rent escalators
Long-term net leases with CPI or fixed escalators preserve real cash flows; US CPI averaged about 3.4% in 2024, supporting lease income escalation. High inflation benefits CPI-linked clauses but can compress tenant margins, especially for lower-credit operators. Calibrating escalators to tenant credit profiles lowers default risk, and a portfolio's lease mix—share of CPI-linked versus fixed escalators—drives inflation pass-through effectiveness.
Tenant credit cycle and default risk
Economic slowdowns elevate tenant credit risk across retail, office and industrial segments, contributing to higher restructuring and rent relief demands; industry CRE delinquencies rose notably in 2023–24. W. P. Carey’s diversification across roughly 1,350 properties in 27 countries cushions cash flows. Strong underwriting and master leases limit vacancy downtime and their reported portfolio occupancy near 98.6% sustains income. Proactive workouts preserve occupancy and asset value.
FX movements and global cash flows
Foreign-currency revenues and asset values expose W. P. Carey to translation and transaction risk, with its global portfolio of roughly 1,300 properties and ~ $20B of investments (2024) amplifying FX impact; hedging programs stabilize AFFO but carry explicit costs and basis risk. Currency swings alter relative market attractiveness for acquisitions, forcing portfolio allocation tradeoffs between yield and FX volatility.
- Translation/transaction risk: material for ~1,300-property, ~$20B portfolio (2024)
- Hedging: reduces AFFO volatility, adds cost
- Acquisitions: FX swings shift pricing and cap-rate appeal
- Allocation: balance yield vs FX exposure
Sectoral demand shifts
- e-commerce 15.5% (2024)
- industrial cap rate ~5.0% (2024)
- build-to-suit ~20% of deliveries (2024)
- office demand uneven
US 21% tax, OECD 15%, REIT pass-through backs ~6% yield; FDI 150+ juris, 6-18m delays
Higher benchmark rates (Fed 5.25–5.50% Jul 2025; 10y ~4.1%) raise WACC, slowing acquisitions; CPI ~3.4% (2024) supports CPI escalators but pressures tenant margins. Diversification (~1,300 properties, ~$20B 2024) and 98.6% occupancy cushion downturns; FX hedging reduces AFFO volatility. E-commerce 15.5% (2024) fuels industrial demand; industrial cap rates ~5.0% (2024).
| Metric | Value |
|---|---|
| Fed funds (Jul 2025) | 5.25–5.50% |
| 10y | ~4.1% |
| US CPI (2024) | 3.4% |
| Portfolio | ~1,300 props, ~$20B (2024) |
| Occupancy | 98.6% |
| E-commerce (2024) | 15.5% |
| Industrial cap rate (2024) | ~5.0% |
What You See Is What You Get
W. P. Carey PESTLE Analysis
The preview shown here is the exact W. P. Carey PESTLE Analysis you’ll receive after purchase—fully formatted and ready to use. It includes political, economic, social, technological, legal, and environmental insights tailored to W. P. Carey’s business. No placeholders or teasers; this is the final, downloadable file. Purchase delivers this exact document instantly.











