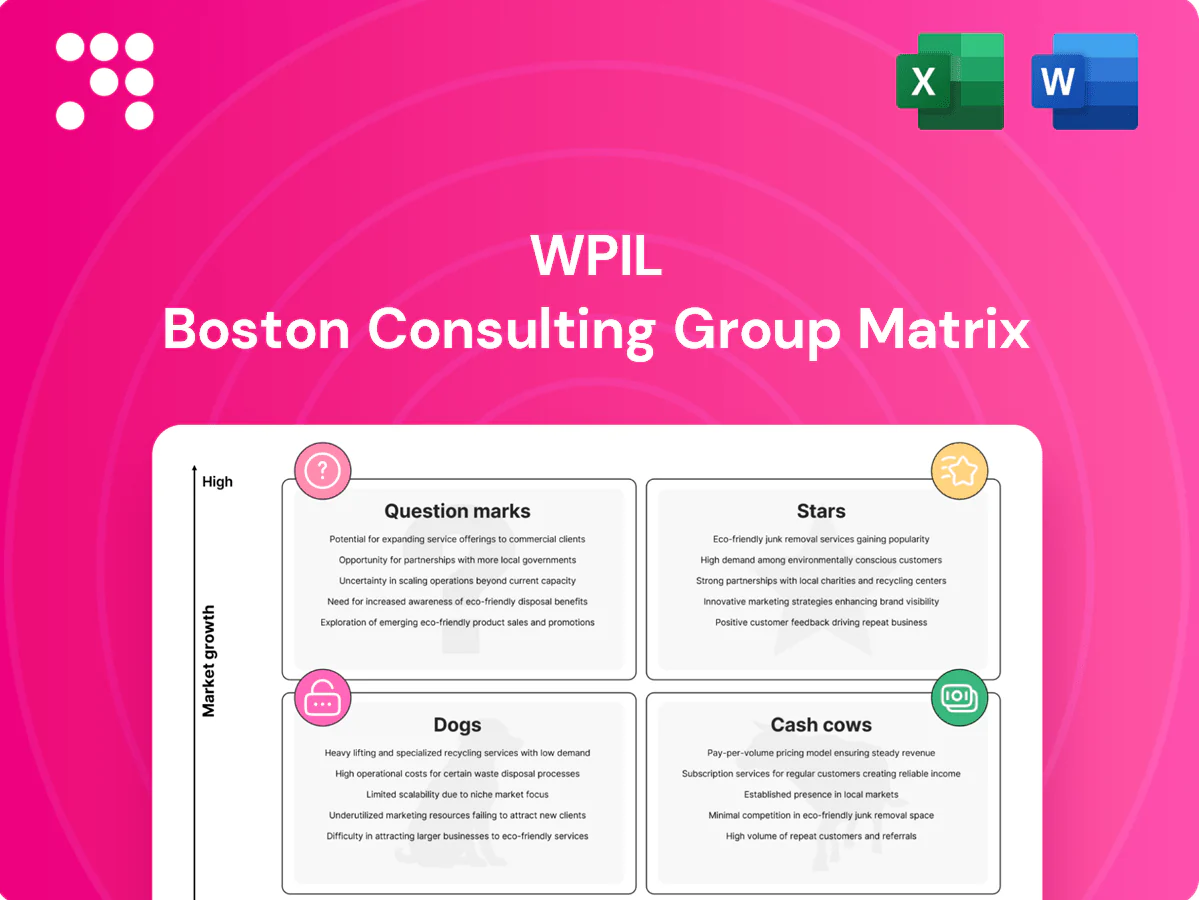
Wpil Boston Consulting Group Matrix

See the Bigger Picture
Want a clear read on where this company's offerings sit—Stars, Cash Cows, Dogs or Question Marks? This preview is just a taste: buy the full BCG Matrix for quadrant-by-quadrant placement, data-backed recommendations and a ready-to-present Word report plus an Excel summary. Get instant strategic clarity and a practical roadmap for investment and product moves.
Stars

Municipal water EPC projects
Municipal water EPC projects are stars as fast-growing public water-infrastructure spending keeps a robust pipeline while WPIL leverages strong references to secure bids. Execution know-how and local sourcing deliver measurable cost and speed advantages versus peers. Maintain aggressive bid flow and site capability investments to defend win rates. Sustained contract wins can convert into stable, cash-rich O&M streams.
Irrigation pump systems for agri corridors
Government-backed irrigation programs are expanding rapidly and WPIL kits are frequently the specified equipment; projects often require 6–9 months of working capital due to high volumes, complex logistics and political timelines. Market share becomes sticky after installation, typically exceeding 70% retention in corridor deployments. Double down on on-ground service fleets now to scale influence; invest to capture volume and milk aftermarket margins later.

Industrial pumps for power and process
Thermal and industrial process revamps have reaccelerated in 2024, lifting capex and demand for engineered pumps; WPIL’s units are on vendor lists and benefit from technical moats that support premium pricing. Protect share through application engineering and uptime guarantees; service and spare parts now convert build-cycle sales into recurring annuity streams, typically representing about 30–35% of lifetime OEM revenues in 2024. As new-build ordering paces normalize, these installed-base service streams mature into stable, high-margin revenue.

Export wins in select emerging markets
Export wins in select emerging markets: WPIL’s distributors and installed base in Southeast Asia and pockets of Africa position the company to capture brisk regional demand as IMF forecasts East Asia & Pacific GDP growth at 4.8% and Sub‑Saharan Africa at 3.8% in 2024; first‑in positioning plus localized financing support outcompetes late entrants, while keeping inventory local and responsive tech support preserves margins and conversion potential.
- SEA/Africa footprints: established distributors + installed base
- Regional tailwinds: EAP growth 4.8% (IMF 2024), SSA 3.8% (IMF 2024)
- Advantages: first‑in positioning, financing support, local inventory, fast tech support
- Near‑term strategy: hold share now to convert footholds into regional anchors
Turnkey water supply schemes
Turnkey water supply schemes deliver design-to-commission simplicity that governments prefer, with WPIL owning the critical pump core in high-growth, high-ticket projects (typical contracts >$5M) and sector CAGR near 6% in 2024 supporting scale.
- End-to-end wins: simplicity for government clients
- High growth/high ticket: contracts often >$5M
- WPIL control: pump core secures margins
- Scale safely: invest in PM and risk controls
- Mature markets: spin-off maintenance/replacement demand
Municipal EPC, irrigation and thermal revamps drive 2024 upside; services 30-35%
WPIL Stars: municipal EPC, irrigation, thermal revamps and targeted exports drive 2024 revenue upside; installed-base services now 30–35% of lifetime OEM revenues. Market tailwinds: water infra CAGR ~6% (2024), EAP GDP 4.8%, SSA 3.8% (IMF 2024). Focus: sustain bid flow, expand field service fleets, lock aftermarket margins.
| Segment | 2024 KPI | Strategy |
|---|---|---|
| Municipal EPC | Contracts >$5M, high growth | Defend bids, local sourcing |
| Irrigation | 70%+ retention, 6–9m WC | Scale service fleets |
| Thermal/Industrial | 30–35% service share | Uptime guarantees |
| Exports (SEA/SSA) | EAP 4.8%, SSA 3.8% | Local inventory/financing |
What is included in the product
 Detailed Word Document
Concise Wpil BCG Matrix review: strategic guidance for Stars, Cash Cows, Question Marks, and Dogs, with clear invest, hold, divest advice.

 Customizable Excel Spreadsheet
One-page Wpil BCG snapshot pinpointing problem units so you prioritize growth and cut losses fast
Cash Cows

Standard centrifugal pumps (municipal)
Mature municipal centrifugal pumps sit in a stable segment of the global pump market (market ~USD 63 billion in 2023), with entrenched approvals and recurring tenders delivering predictable volumes. WPIL’s scale and amortized tooling sustain steady margins, enabling disciplined SKU rationalization and firm pricing. Cash generation from this cash cow should be allocated to frontier tech and targeted market development to capture growth.
Borewell and irrigation pumps (rural)
Borewell and irrigation pumps in rural markets show steady demand with predictable specifications and strong dealer pull, making them a reliable cash cow for WPIL. Once dealer channels and fill-rate systems are established, promotional spend drops substantially. Priority should be continuous cost-down initiatives and maintaining distribution fill-rate reliability. Treat this segment as a dependable cash engine, not a growth bet.

Spares, service, and AMCs
Installed base drives recurring, high-margin parts and AMCs; aftermarket often delivers ~40% of OEM revenue and up to 70% of operating profit (McKinsey, 2024). Minimal growth capex needed and retention exceeds 90% when SLAs are met. Standardizing kits and digital ordering can cut fulfillment costs ~15–20% and boost reorder rates ~20%. This steady cash flow bankrolls riskier R&D and market bets.

Retrofits and efficiency upgrades
Cash Cows:
Retrofits and efficiency upgrades
Old fleets need energy-saving swaps and WPIL already knows the hydraulics; retrofit projects typically cut fuel use 10–25% with paybacks of 12–36 months, sales cycles are shorter and capex lighter, so productized audits and payback calculators close deals faster and let WPIL harvest high margins to reinvest.- Fuel savings 10–25%
- Payback 12–36 months
- Short sales cycles, low capex
- Productize audits/calculators
- Harvest margins → reinvest
OEM/private-label supply runs
OEM/private-label supply runs deliver multi-year volume contracts (often 3–5 years) with predictable specs and schedules; in 2024 leading CPG OEMs reported plant utilization of 85–95% and direct selling costs under 2% of revenue, producing steady margins. Maintaining quality and on-time delivery keeps churn below 5% annually and secures these runs as base-load, typically 40–60% of factory throughput and 30–50% of cash flow.
Cash cows: municipal pumps, aftermarket & retrofits deliver steady margins
WPIL cash cows deliver steady margins and free cash: municipal pumps in a ~USD 63bn market (2023) and aftermarket driving ~40% of OEM revenue and up to 70% of operating profit (McKinsey, 2024). Retrofits cut fuel 10–25% (payback 12–36 months). OEM runs 3–5y with 85–95% utilization and <5% churn; prioritize cost-downs and channel fill-rate to fund R&D.
| Segment | Rev share | Margin | Key metrics |
|---|---|---|---|
| Municipal pumps | — | Stable | Market USD 63bn (2023) |
| Aftermarket | ~40% OEM rev | Up to 70% op profit | Retention >90% |
| Retrofits | — | High | Fuel −10–25% payback 12–36m |
| OEM runs | 30–50% cash flow | Steady | 3–5y contracts, util 85–95% |
What You’re Viewing Is Included
Wpil BCG Matrix
The file you're previewing here is the exact Wpil BCG Matrix you'll receive after purchase. No watermarks, no demo placeholders—just a fully formatted, analysis-ready report crafted by strategy experts. After buying you'll get the same editable file instantly in your inbox, ready to print, present, or plug into your planning. No surprises, no extra edits needed.

See the Bigger Picture
Want a clear read on where this company's offerings sit—Stars, Cash Cows, Dogs or Question Marks? This preview is just a taste: buy the full BCG Matrix for quadrant-by-quadrant placement, data-backed recommendations and a ready-to-present Word report plus an Excel summary. Get instant strategic clarity and a practical roadmap for investment and product moves.
Stars
Municipal water EPC projects
Municipal water EPC projects are stars as fast-growing public water-infrastructure spending keeps a robust pipeline while WPIL leverages strong references to secure bids. Execution know-how and local sourcing deliver measurable cost and speed advantages versus peers. Maintain aggressive bid flow and site capability investments to defend win rates. Sustained contract wins can convert into stable, cash-rich O&M streams.
Irrigation pump systems for agri corridors
Government-backed irrigation programs are expanding rapidly and WPIL kits are frequently the specified equipment; projects often require 6–9 months of working capital due to high volumes, complex logistics and political timelines. Market share becomes sticky after installation, typically exceeding 70% retention in corridor deployments. Double down on on-ground service fleets now to scale influence; invest to capture volume and milk aftermarket margins later.
Industrial pumps for power and process
Thermal and industrial process revamps have reaccelerated in 2024, lifting capex and demand for engineered pumps; WPIL’s units are on vendor lists and benefit from technical moats that support premium pricing. Protect share through application engineering and uptime guarantees; service and spare parts now convert build-cycle sales into recurring annuity streams, typically representing about 30–35% of lifetime OEM revenues in 2024. As new-build ordering paces normalize, these installed-base service streams mature into stable, high-margin revenue.
Export wins in select emerging markets
Export wins in select emerging markets: WPIL’s distributors and installed base in Southeast Asia and pockets of Africa position the company to capture brisk regional demand as IMF forecasts East Asia & Pacific GDP growth at 4.8% and Sub‑Saharan Africa at 3.8% in 2024; first‑in positioning plus localized financing support outcompetes late entrants, while keeping inventory local and responsive tech support preserves margins and conversion potential.
- SEA/Africa footprints: established distributors + installed base
- Regional tailwinds: EAP growth 4.8% (IMF 2024), SSA 3.8% (IMF 2024)
- Advantages: first‑in positioning, financing support, local inventory, fast tech support
- Near‑term strategy: hold share now to convert footholds into regional anchors
Turnkey water supply schemes
Turnkey water supply schemes deliver design-to-commission simplicity that governments prefer, with WPIL owning the critical pump core in high-growth, high-ticket projects (typical contracts >$5M) and sector CAGR near 6% in 2024 supporting scale.
- End-to-end wins: simplicity for government clients
- High growth/high ticket: contracts often >$5M
- WPIL control: pump core secures margins
- Scale safely: invest in PM and risk controls
- Mature markets: spin-off maintenance/replacement demand
Municipal EPC, irrigation and thermal revamps drive 2024 upside; services 30-35%
WPIL Stars: municipal EPC, irrigation, thermal revamps and targeted exports drive 2024 revenue upside; installed-base services now 30–35% of lifetime OEM revenues. Market tailwinds: water infra CAGR ~6% (2024), EAP GDP 4.8%, SSA 3.8% (IMF 2024). Focus: sustain bid flow, expand field service fleets, lock aftermarket margins.
| Segment | 2024 KPI | Strategy |
|---|---|---|
| Municipal EPC | Contracts >$5M, high growth | Defend bids, local sourcing |
| Irrigation | 70%+ retention, 6–9m WC | Scale service fleets |
| Thermal/Industrial | 30–35% service share | Uptime guarantees |
| Exports (SEA/SSA) | EAP 4.8%, SSA 3.8% | Local inventory/financing |
What is included in the product
Detailed Word Document
Concise Wpil BCG Matrix review: strategic guidance for Stars, Cash Cows, Question Marks, and Dogs, with clear invest, hold, divest advice.
Customizable Excel Spreadsheet
One-page Wpil BCG snapshot pinpointing problem units so you prioritize growth and cut losses fast
Cash Cows
Standard centrifugal pumps (municipal)
Mature municipal centrifugal pumps sit in a stable segment of the global pump market (market ~USD 63 billion in 2023), with entrenched approvals and recurring tenders delivering predictable volumes. WPIL’s scale and amortized tooling sustain steady margins, enabling disciplined SKU rationalization and firm pricing. Cash generation from this cash cow should be allocated to frontier tech and targeted market development to capture growth.
Borewell and irrigation pumps (rural)
Borewell and irrigation pumps in rural markets show steady demand with predictable specifications and strong dealer pull, making them a reliable cash cow for WPIL. Once dealer channels and fill-rate systems are established, promotional spend drops substantially. Priority should be continuous cost-down initiatives and maintaining distribution fill-rate reliability. Treat this segment as a dependable cash engine, not a growth bet.
Spares, service, and AMCs
Installed base drives recurring, high-margin parts and AMCs; aftermarket often delivers ~40% of OEM revenue and up to 70% of operating profit (McKinsey, 2024). Minimal growth capex needed and retention exceeds 90% when SLAs are met. Standardizing kits and digital ordering can cut fulfillment costs ~15–20% and boost reorder rates ~20%. This steady cash flow bankrolls riskier R&D and market bets.
Retrofits and efficiency upgrades
Cash Cows:
Retrofits and efficiency upgrades
Old fleets need energy-saving swaps and WPIL already knows the hydraulics; retrofit projects typically cut fuel use 10–25% with paybacks of 12–36 months, sales cycles are shorter and capex lighter, so productized audits and payback calculators close deals faster and let WPIL harvest high margins to reinvest.- Fuel savings 10–25%
- Payback 12–36 months
- Short sales cycles, low capex
- Productize audits/calculators
- Harvest margins → reinvest
OEM/private-label supply runs
OEM/private-label supply runs deliver multi-year volume contracts (often 3–5 years) with predictable specs and schedules; in 2024 leading CPG OEMs reported plant utilization of 85–95% and direct selling costs under 2% of revenue, producing steady margins. Maintaining quality and on-time delivery keeps churn below 5% annually and secures these runs as base-load, typically 40–60% of factory throughput and 30–50% of cash flow.
Cash cows: municipal pumps, aftermarket & retrofits deliver steady margins
WPIL cash cows deliver steady margins and free cash: municipal pumps in a ~USD 63bn market (2023) and aftermarket driving ~40% of OEM revenue and up to 70% of operating profit (McKinsey, 2024). Retrofits cut fuel 10–25% (payback 12–36 months). OEM runs 3–5y with 85–95% utilization and <5% churn; prioritize cost-downs and channel fill-rate to fund R&D.
| Segment | Rev share | Margin | Key metrics |
|---|---|---|---|
| Municipal pumps | — | Stable | Market USD 63bn (2023) |
| Aftermarket | ~40% OEM rev | Up to 70% op profit | Retention >90% |
| Retrofits | — | High | Fuel −10–25% payback 12–36m |
| OEM runs | 30–50% cash flow | Steady | 3–5y contracts, util 85–95% |
What You’re Viewing Is Included
Wpil BCG Matrix
The file you're previewing here is the exact Wpil BCG Matrix you'll receive after purchase. No watermarks, no demo placeholders—just a fully formatted, analysis-ready report crafted by strategy experts. After buying you'll get the same editable file instantly in your inbox, ready to print, present, or plug into your planning. No surprises, no extra edits needed.
Description
See the Bigger Picture
Want a clear read on where this company's offerings sit—Stars, Cash Cows, Dogs or Question Marks? This preview is just a taste: buy the full BCG Matrix for quadrant-by-quadrant placement, data-backed recommendations and a ready-to-present Word report plus an Excel summary. Get instant strategic clarity and a practical roadmap for investment and product moves.
Stars
Municipal water EPC projects
Municipal water EPC projects are stars as fast-growing public water-infrastructure spending keeps a robust pipeline while WPIL leverages strong references to secure bids. Execution know-how and local sourcing deliver measurable cost and speed advantages versus peers. Maintain aggressive bid flow and site capability investments to defend win rates. Sustained contract wins can convert into stable, cash-rich O&M streams.
Irrigation pump systems for agri corridors
Government-backed irrigation programs are expanding rapidly and WPIL kits are frequently the specified equipment; projects often require 6–9 months of working capital due to high volumes, complex logistics and political timelines. Market share becomes sticky after installation, typically exceeding 70% retention in corridor deployments. Double down on on-ground service fleets now to scale influence; invest to capture volume and milk aftermarket margins later.
Industrial pumps for power and process
Thermal and industrial process revamps have reaccelerated in 2024, lifting capex and demand for engineered pumps; WPIL’s units are on vendor lists and benefit from technical moats that support premium pricing. Protect share through application engineering and uptime guarantees; service and spare parts now convert build-cycle sales into recurring annuity streams, typically representing about 30–35% of lifetime OEM revenues in 2024. As new-build ordering paces normalize, these installed-base service streams mature into stable, high-margin revenue.
Export wins in select emerging markets
Export wins in select emerging markets: WPIL’s distributors and installed base in Southeast Asia and pockets of Africa position the company to capture brisk regional demand as IMF forecasts East Asia & Pacific GDP growth at 4.8% and Sub‑Saharan Africa at 3.8% in 2024; first‑in positioning plus localized financing support outcompetes late entrants, while keeping inventory local and responsive tech support preserves margins and conversion potential.
- SEA/Africa footprints: established distributors + installed base
- Regional tailwinds: EAP growth 4.8% (IMF 2024), SSA 3.8% (IMF 2024)
- Advantages: first‑in positioning, financing support, local inventory, fast tech support
- Near‑term strategy: hold share now to convert footholds into regional anchors
Turnkey water supply schemes
Turnkey water supply schemes deliver design-to-commission simplicity that governments prefer, with WPIL owning the critical pump core in high-growth, high-ticket projects (typical contracts >$5M) and sector CAGR near 6% in 2024 supporting scale.
- End-to-end wins: simplicity for government clients
- High growth/high ticket: contracts often >$5M
- WPIL control: pump core secures margins
- Scale safely: invest in PM and risk controls
- Mature markets: spin-off maintenance/replacement demand
Municipal EPC, irrigation and thermal revamps drive 2024 upside; services 30-35%
WPIL Stars: municipal EPC, irrigation, thermal revamps and targeted exports drive 2024 revenue upside; installed-base services now 30–35% of lifetime OEM revenues. Market tailwinds: water infra CAGR ~6% (2024), EAP GDP 4.8%, SSA 3.8% (IMF 2024). Focus: sustain bid flow, expand field service fleets, lock aftermarket margins.
| Segment | 2024 KPI | Strategy |
|---|---|---|
| Municipal EPC | Contracts >$5M, high growth | Defend bids, local sourcing |
| Irrigation | 70%+ retention, 6–9m WC | Scale service fleets |
| Thermal/Industrial | 30–35% service share | Uptime guarantees |
| Exports (SEA/SSA) | EAP 4.8%, SSA 3.8% | Local inventory/financing |
What is included in the product
Detailed Word Document
Concise Wpil BCG Matrix review: strategic guidance for Stars, Cash Cows, Question Marks, and Dogs, with clear invest, hold, divest advice.
Customizable Excel Spreadsheet
One-page Wpil BCG snapshot pinpointing problem units so you prioritize growth and cut losses fast
Cash Cows
Standard centrifugal pumps (municipal)
Mature municipal centrifugal pumps sit in a stable segment of the global pump market (market ~USD 63 billion in 2023), with entrenched approvals and recurring tenders delivering predictable volumes. WPIL’s scale and amortized tooling sustain steady margins, enabling disciplined SKU rationalization and firm pricing. Cash generation from this cash cow should be allocated to frontier tech and targeted market development to capture growth.
Borewell and irrigation pumps (rural)
Borewell and irrigation pumps in rural markets show steady demand with predictable specifications and strong dealer pull, making them a reliable cash cow for WPIL. Once dealer channels and fill-rate systems are established, promotional spend drops substantially. Priority should be continuous cost-down initiatives and maintaining distribution fill-rate reliability. Treat this segment as a dependable cash engine, not a growth bet.
Spares, service, and AMCs
Installed base drives recurring, high-margin parts and AMCs; aftermarket often delivers ~40% of OEM revenue and up to 70% of operating profit (McKinsey, 2024). Minimal growth capex needed and retention exceeds 90% when SLAs are met. Standardizing kits and digital ordering can cut fulfillment costs ~15–20% and boost reorder rates ~20%. This steady cash flow bankrolls riskier R&D and market bets.
Retrofits and efficiency upgrades
Cash Cows:
Retrofits and efficiency upgrades
Old fleets need energy-saving swaps and WPIL already knows the hydraulics; retrofit projects typically cut fuel use 10–25% with paybacks of 12–36 months, sales cycles are shorter and capex lighter, so productized audits and payback calculators close deals faster and let WPIL harvest high margins to reinvest.- Fuel savings 10–25%
- Payback 12–36 months
- Short sales cycles, low capex
- Productize audits/calculators
- Harvest margins → reinvest
OEM/private-label supply runs
OEM/private-label supply runs deliver multi-year volume contracts (often 3–5 years) with predictable specs and schedules; in 2024 leading CPG OEMs reported plant utilization of 85–95% and direct selling costs under 2% of revenue, producing steady margins. Maintaining quality and on-time delivery keeps churn below 5% annually and secures these runs as base-load, typically 40–60% of factory throughput and 30–50% of cash flow.
Cash cows: municipal pumps, aftermarket & retrofits deliver steady margins
WPIL cash cows deliver steady margins and free cash: municipal pumps in a ~USD 63bn market (2023) and aftermarket driving ~40% of OEM revenue and up to 70% of operating profit (McKinsey, 2024). Retrofits cut fuel 10–25% (payback 12–36 months). OEM runs 3–5y with 85–95% utilization and <5% churn; prioritize cost-downs and channel fill-rate to fund R&D.
| Segment | Rev share | Margin | Key metrics |
|---|---|---|---|
| Municipal pumps | — | Stable | Market USD 63bn (2023) |
| Aftermarket | ~40% OEM rev | Up to 70% op profit | Retention >90% |
| Retrofits | — | High | Fuel −10–25% payback 12–36m |
| OEM runs | 30–50% cash flow | Steady | 3–5y contracts, util 85–95% |
What You’re Viewing Is Included
Wpil BCG Matrix
The file you're previewing here is the exact Wpil BCG Matrix you'll receive after purchase. No watermarks, no demo placeholders—just a fully formatted, analysis-ready report crafted by strategy experts. After buying you'll get the same editable file instantly in your inbox, ready to print, present, or plug into your planning. No surprises, no extra edits needed.











