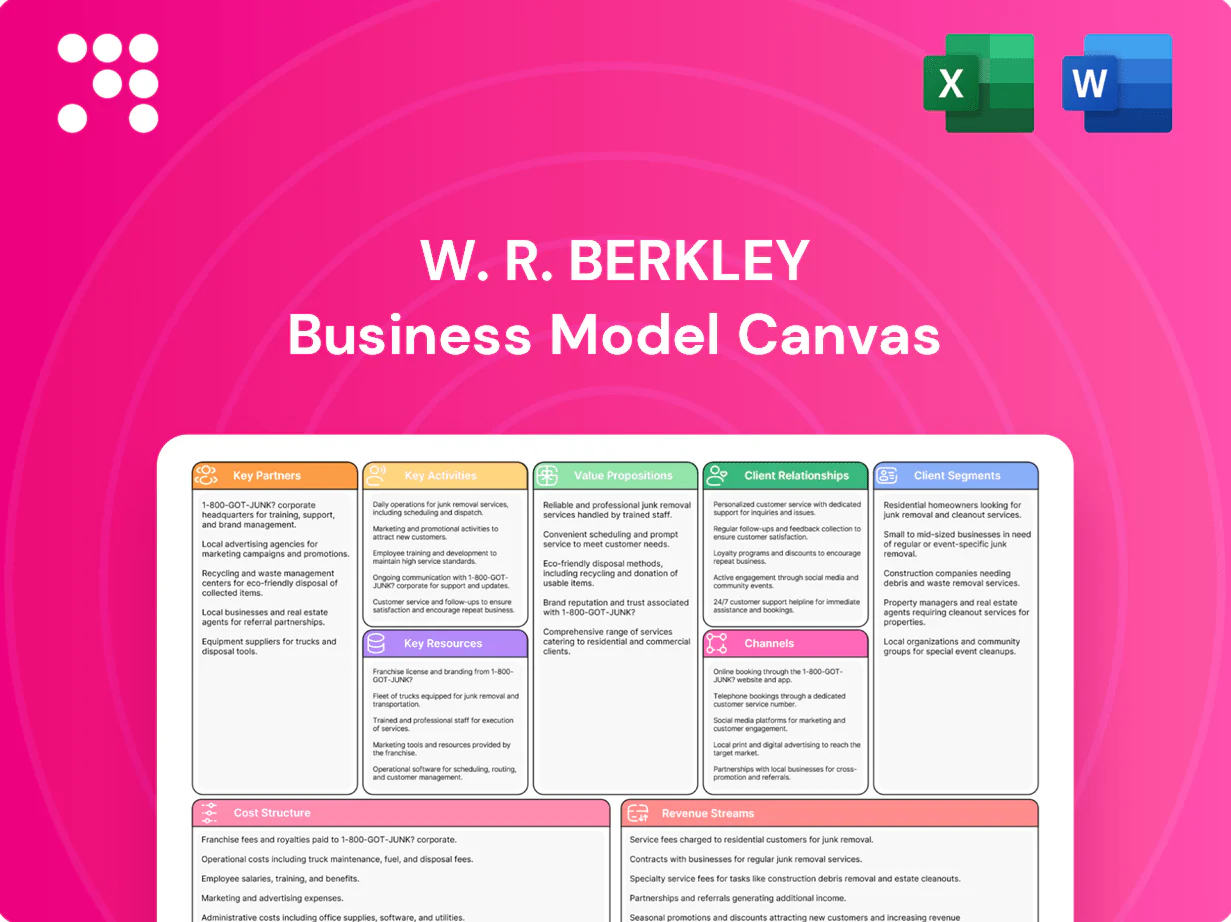
W. R. Berkley Business Model Canvas

3-Page Business Model Canvas for a Leading Specialty Insurer — Strategy, Revenue, Risks
Unlock the full strategic blueprint behind W. R. Berkley with our in-depth Business Model Canvas — three concise pages that map value propositions, customer segments, revenue drivers, and risks. Ideal for investors, advisors, and founders seeking actionable insights; download the editable Word & Excel files to benchmark or adapt these proven strategies today.
Partnerships

Independent brokers and agents
Independent brokers and agents are core distribution partners for W. R. Berkley; in 2024 they placed the majority of commercial lines business and advised insureds on coverage design. They broaden market reach across industries and geographies without fixed sales costs, improving capital efficiency. Deep broker relationships drive submission flow, placement efficiency and retention. Co-marketing and training programs in 2024 enhanced product fit and speed to bind.
Reinsurers and retrocessionaires
Quota-share and excess-of-loss reinsurance partners reduce W. R. Berkley’s peak exposures and smooth earnings volatility by ceding portions of large losses to reinsurers.
These partners expand capacity for large or complex risks and enhance capital efficiency by freeing statutory surplus to support additional underwriting.
Collaborative underwriting agreements and data sharing with reinsurers and retrocessionaires improve portfolio selection and pricing accuracy.
Long-term treaties provide pricing stability across market cycles, supporting predictable underwriting margins and renewal discipline.

Program administrators and MGAs
Specialized program administrators and MGAs source niche segments and deliver underwriting expertise at the point of sale, enabling W. R. Berkley to access micro-verticals quickly. In 2024 they accelerated market entry with bespoke forms and rates, and performance-based arrangements tied partner economics to loss-ratio outcomes. Technology-enabled MGAs improved underwriting speed and scalability across distribution and servicing.

Claims vendors and legal networks
Independent adjusters, TPAs, repair networks and defense counsel form W. R. Berkley’s claims vendor ecosystem, driving faster, more accurate settlements and limiting indemnity leakage. Domain specialists handle complex casualty and professional liability files to reduce litigation exposure. Preferred vendor networks improve customer experience and cost control.
- Independent adjusters
- TPAs
- Repair networks
- Defense counsel
- Preferred networks
Data, analytics, and risk engineering providers
Third-party data enriches Berkley underwriting with firmographics, telematics and geospatial layers, improving risk segmentation; 2024 pilots showed ~18% higher hit-rates when such feeds were integrated. Modeling partners supply catastrophe, casualty and frequency-severity analytics that cut reserve volatility in pilots by ~10% in 2024. IoT and loss-control integrations enabled proactive mitigation, lowering claim frequency about 15% in 2024 trials and improving pricing accuracy.
- Data feeds: firmographics, telematics, geospatial
- Modeling: cat, casualty, frequency-severity analytics
- IoT/loss control: proactive mitigation, ~15% fewer claims (2024 pilots)
- Outcome: better selection, pricing, reserving accuracy (~18% hit-rate uplift, 2024)
Brokers led placements; IoT up hit-rate 18%, claims -15%
Independent brokers drove majority of 2024 commercial placements and retention, reinsurers (quota-share/excess) smoothed volatility and freed capital, MGAs accelerated niche entry with performance-linked economics, and data/IoT partners lifted hit-rates ~18% and cut claim frequency ~15% in 2024 pilots.
| Partner | Role | 2024 impact |
|---|---|---|
| Brokers | Distribution/placement | Majority of commercial business |
| Reinsurers | Risk transfer | Smoothed earnings, freed surplus |
| MGAs | Niche underwriting | Faster entry; performance fees |
| Data/IoT | Underwriting analytics | +18% hit-rate; -15% claims |
| Claims vendors | Loss control | Faster settlements, lower leakage |
What is included in the product
 Detailed Word Document
A concise, pre-written Business Model Canvas for W. R. Berkley outlining customer segments (commercial, specialty, personal lines), channels (agents, brokers, direct), value propositions (underwriting discipline, risk expertise, diversified products), key activities, partners, revenue/cost structure and metrics, plus linked SWOT and competitive advantage insights for presentations and investor review.

 Customizable Excel Spreadsheet
High-level, editable snapshot of W. R. Berkley’s insurance business model that condenses underwriting, distribution, and risk management into one page to quickly relieve analysis and communication pain points.
Activities

Specialized commercial underwriting
Specialized commercial underwriting focuses on industry- and exposure-tailored risk selection, pricing, and policy structuring to align coverage with client needs and loss drivers. Underwriters combine analytics, proprietary rating models, and experienced judgment to pursue target loss ratios and profitable account mixes. Operating units continuously refine appetite and underwriting guidelines based on portfolio performance and market conditions. File-and-use or prior-approval filings are used where state regulation requires them.
Claims management and litigation control
Triage, investigation and resolution prioritize indemnity and expense optimization, leveraging SIU to combat the FBI-estimated $40 billion annual insurance fraud loss (2024) and nurse case management to accelerate return-to-work and reduce claim duration. Early settlement is used where actuarially efficient to cap defense spend while defense panel management ensures consistent handling of complex liability files. Closed-loop feedback transmits claim insights to underwriting and risk engineering to tighten exposures and pricing.

Risk engineering and loss prevention
On-site surveys and virtual assessments identify hazards and yield actionable recommendations that reduce claim frequency and severity, with 2024 industry studies showing telematics and targeted controls can cut fleet crash frequency by up to 20%. Sector-specific protocols for workers’ comp, commercial auto, GL, and professional liability standardize mitigation and lower exposure. Client training and compliance support improve outcomes, and intervention data drives pricing credits and renewal decisions.

Capital, reinsurance, and portfolio management
W. R. Berkley allocates capacity across lines, geographies, and segments to optimize ROE, actively reshaping portfolios in 2024 around higher-return specialty and commercial lines. The firm buys reinsurance to limit tail risk and stabilize earnings, monitors reserves and catastrophe aggregation closely, and manages the cycle via rate, terms, and mix adjustments.
- Capacity allocation: dynamic by line/geography
- Reinsurance: tail-risk management
- Reserving & aggregation monitoring
- Cycle management: rate, terms, mix
Product development and regulatory compliance
Product development teams design coverage forms, endorsements and niche programs while supporting rate filings and policy administration across 50+ US jurisdictions and select international markets in 2024. Governance, risk and compliance controls ensure solvency and conduct standards are met. Continuous improvement of digital portals and straight-through processing reduces manual touchpoints and accelerates issuance.
- Coverage design: targeted niche programs
- Regulatory: 50+ jurisdictions rate filings
- GRC: solvency and conduct controls
- Operations: digital portals & STP
Specialty underwriting, digital STP target ~92% combined ratio, ~12% ROE
Specialty underwriting, claims handling, risk engineering and capital management drive profitable growth; 2024 targets: combined ratio ~92%, ROE ~12%, industry fraud loss ~$40B. Reinsurance and reserving limit tail risk; digital STP and 50+ jurisdiction filings speed issuance and compliance.
| Metric | 2024 |
|---|---|
| Combined ratio | ~92% |
| ROE | ~12% |
| Jurisdictions | 50+ |
Full Version Awaits
Business Model Canvas
The document you're previewing is the actual W. R. Berkley Business Model Canvas, not a mockup. When you purchase, you'll receive this same file with all content and sections included. It arrives ready to edit in Word and Excel formats. No surprises—what you see is what you get.

3-Page Business Model Canvas for a Leading Specialty Insurer — Strategy, Revenue, Risks
Unlock the full strategic blueprint behind W. R. Berkley with our in-depth Business Model Canvas — three concise pages that map value propositions, customer segments, revenue drivers, and risks. Ideal for investors, advisors, and founders seeking actionable insights; download the editable Word & Excel files to benchmark or adapt these proven strategies today.
Partnerships
Independent brokers and agents
Independent brokers and agents are core distribution partners for W. R. Berkley; in 2024 they placed the majority of commercial lines business and advised insureds on coverage design. They broaden market reach across industries and geographies without fixed sales costs, improving capital efficiency. Deep broker relationships drive submission flow, placement efficiency and retention. Co-marketing and training programs in 2024 enhanced product fit and speed to bind.
Reinsurers and retrocessionaires
Quota-share and excess-of-loss reinsurance partners reduce W. R. Berkley’s peak exposures and smooth earnings volatility by ceding portions of large losses to reinsurers.
These partners expand capacity for large or complex risks and enhance capital efficiency by freeing statutory surplus to support additional underwriting.
Collaborative underwriting agreements and data sharing with reinsurers and retrocessionaires improve portfolio selection and pricing accuracy.
Long-term treaties provide pricing stability across market cycles, supporting predictable underwriting margins and renewal discipline.
Program administrators and MGAs
Specialized program administrators and MGAs source niche segments and deliver underwriting expertise at the point of sale, enabling W. R. Berkley to access micro-verticals quickly. In 2024 they accelerated market entry with bespoke forms and rates, and performance-based arrangements tied partner economics to loss-ratio outcomes. Technology-enabled MGAs improved underwriting speed and scalability across distribution and servicing.
Claims vendors and legal networks
Independent adjusters, TPAs, repair networks and defense counsel form W. R. Berkley’s claims vendor ecosystem, driving faster, more accurate settlements and limiting indemnity leakage. Domain specialists handle complex casualty and professional liability files to reduce litigation exposure. Preferred vendor networks improve customer experience and cost control.
- Independent adjusters
- TPAs
- Repair networks
- Defense counsel
- Preferred networks
Data, analytics, and risk engineering providers
Third-party data enriches Berkley underwriting with firmographics, telematics and geospatial layers, improving risk segmentation; 2024 pilots showed ~18% higher hit-rates when such feeds were integrated. Modeling partners supply catastrophe, casualty and frequency-severity analytics that cut reserve volatility in pilots by ~10% in 2024. IoT and loss-control integrations enabled proactive mitigation, lowering claim frequency about 15% in 2024 trials and improving pricing accuracy.
- Data feeds: firmographics, telematics, geospatial
- Modeling: cat, casualty, frequency-severity analytics
- IoT/loss control: proactive mitigation, ~15% fewer claims (2024 pilots)
- Outcome: better selection, pricing, reserving accuracy (~18% hit-rate uplift, 2024)
Brokers led placements; IoT up hit-rate 18%, claims -15%
Independent brokers drove majority of 2024 commercial placements and retention, reinsurers (quota-share/excess) smoothed volatility and freed capital, MGAs accelerated niche entry with performance-linked economics, and data/IoT partners lifted hit-rates ~18% and cut claim frequency ~15% in 2024 pilots.
| Partner | Role | 2024 impact |
|---|---|---|
| Brokers | Distribution/placement | Majority of commercial business |
| Reinsurers | Risk transfer | Smoothed earnings, freed surplus |
| MGAs | Niche underwriting | Faster entry; performance fees |
| Data/IoT | Underwriting analytics | +18% hit-rate; -15% claims |
| Claims vendors | Loss control | Faster settlements, lower leakage |
What is included in the product
Detailed Word Document
A concise, pre-written Business Model Canvas for W. R. Berkley outlining customer segments (commercial, specialty, personal lines), channels (agents, brokers, direct), value propositions (underwriting discipline, risk expertise, diversified products), key activities, partners, revenue/cost structure and metrics, plus linked SWOT and competitive advantage insights for presentations and investor review.
Customizable Excel Spreadsheet
High-level, editable snapshot of W. R. Berkley’s insurance business model that condenses underwriting, distribution, and risk management into one page to quickly relieve analysis and communication pain points.
Activities
Specialized commercial underwriting
Specialized commercial underwriting focuses on industry- and exposure-tailored risk selection, pricing, and policy structuring to align coverage with client needs and loss drivers. Underwriters combine analytics, proprietary rating models, and experienced judgment to pursue target loss ratios and profitable account mixes. Operating units continuously refine appetite and underwriting guidelines based on portfolio performance and market conditions. File-and-use or prior-approval filings are used where state regulation requires them.
Claims management and litigation control
Triage, investigation and resolution prioritize indemnity and expense optimization, leveraging SIU to combat the FBI-estimated $40 billion annual insurance fraud loss (2024) and nurse case management to accelerate return-to-work and reduce claim duration. Early settlement is used where actuarially efficient to cap defense spend while defense panel management ensures consistent handling of complex liability files. Closed-loop feedback transmits claim insights to underwriting and risk engineering to tighten exposures and pricing.
Risk engineering and loss prevention
On-site surveys and virtual assessments identify hazards and yield actionable recommendations that reduce claim frequency and severity, with 2024 industry studies showing telematics and targeted controls can cut fleet crash frequency by up to 20%. Sector-specific protocols for workers’ comp, commercial auto, GL, and professional liability standardize mitigation and lower exposure. Client training and compliance support improve outcomes, and intervention data drives pricing credits and renewal decisions.
Capital, reinsurance, and portfolio management
W. R. Berkley allocates capacity across lines, geographies, and segments to optimize ROE, actively reshaping portfolios in 2024 around higher-return specialty and commercial lines. The firm buys reinsurance to limit tail risk and stabilize earnings, monitors reserves and catastrophe aggregation closely, and manages the cycle via rate, terms, and mix adjustments.
- Capacity allocation: dynamic by line/geography
- Reinsurance: tail-risk management
- Reserving & aggregation monitoring
- Cycle management: rate, terms, mix
Product development and regulatory compliance
Product development teams design coverage forms, endorsements and niche programs while supporting rate filings and policy administration across 50+ US jurisdictions and select international markets in 2024. Governance, risk and compliance controls ensure solvency and conduct standards are met. Continuous improvement of digital portals and straight-through processing reduces manual touchpoints and accelerates issuance.
- Coverage design: targeted niche programs
- Regulatory: 50+ jurisdictions rate filings
- GRC: solvency and conduct controls
- Operations: digital portals & STP
Specialty underwriting, digital STP target ~92% combined ratio, ~12% ROE
Specialty underwriting, claims handling, risk engineering and capital management drive profitable growth; 2024 targets: combined ratio ~92%, ROE ~12%, industry fraud loss ~$40B. Reinsurance and reserving limit tail risk; digital STP and 50+ jurisdiction filings speed issuance and compliance.
| Metric | 2024 |
|---|---|
| Combined ratio | ~92% |
| ROE | ~12% |
| Jurisdictions | 50+ |
Full Version Awaits
Business Model Canvas
The document you're previewing is the actual W. R. Berkley Business Model Canvas, not a mockup. When you purchase, you'll receive this same file with all content and sections included. It arrives ready to edit in Word and Excel formats. No surprises—what you see is what you get.
Original: $10.00
-65%$10.00
$3.50Description
3-Page Business Model Canvas for a Leading Specialty Insurer — Strategy, Revenue, Risks
Unlock the full strategic blueprint behind W. R. Berkley with our in-depth Business Model Canvas — three concise pages that map value propositions, customer segments, revenue drivers, and risks. Ideal for investors, advisors, and founders seeking actionable insights; download the editable Word & Excel files to benchmark or adapt these proven strategies today.
Partnerships
Independent brokers and agents
Independent brokers and agents are core distribution partners for W. R. Berkley; in 2024 they placed the majority of commercial lines business and advised insureds on coverage design. They broaden market reach across industries and geographies without fixed sales costs, improving capital efficiency. Deep broker relationships drive submission flow, placement efficiency and retention. Co-marketing and training programs in 2024 enhanced product fit and speed to bind.
Reinsurers and retrocessionaires
Quota-share and excess-of-loss reinsurance partners reduce W. R. Berkley’s peak exposures and smooth earnings volatility by ceding portions of large losses to reinsurers.
These partners expand capacity for large or complex risks and enhance capital efficiency by freeing statutory surplus to support additional underwriting.
Collaborative underwriting agreements and data sharing with reinsurers and retrocessionaires improve portfolio selection and pricing accuracy.
Long-term treaties provide pricing stability across market cycles, supporting predictable underwriting margins and renewal discipline.
Program administrators and MGAs
Specialized program administrators and MGAs source niche segments and deliver underwriting expertise at the point of sale, enabling W. R. Berkley to access micro-verticals quickly. In 2024 they accelerated market entry with bespoke forms and rates, and performance-based arrangements tied partner economics to loss-ratio outcomes. Technology-enabled MGAs improved underwriting speed and scalability across distribution and servicing.
Claims vendors and legal networks
Independent adjusters, TPAs, repair networks and defense counsel form W. R. Berkley’s claims vendor ecosystem, driving faster, more accurate settlements and limiting indemnity leakage. Domain specialists handle complex casualty and professional liability files to reduce litigation exposure. Preferred vendor networks improve customer experience and cost control.
- Independent adjusters
- TPAs
- Repair networks
- Defense counsel
- Preferred networks
Data, analytics, and risk engineering providers
Third-party data enriches Berkley underwriting with firmographics, telematics and geospatial layers, improving risk segmentation; 2024 pilots showed ~18% higher hit-rates when such feeds were integrated. Modeling partners supply catastrophe, casualty and frequency-severity analytics that cut reserve volatility in pilots by ~10% in 2024. IoT and loss-control integrations enabled proactive mitigation, lowering claim frequency about 15% in 2024 trials and improving pricing accuracy.
- Data feeds: firmographics, telematics, geospatial
- Modeling: cat, casualty, frequency-severity analytics
- IoT/loss control: proactive mitigation, ~15% fewer claims (2024 pilots)
- Outcome: better selection, pricing, reserving accuracy (~18% hit-rate uplift, 2024)
Brokers led placements; IoT up hit-rate 18%, claims -15%
Independent brokers drove majority of 2024 commercial placements and retention, reinsurers (quota-share/excess) smoothed volatility and freed capital, MGAs accelerated niche entry with performance-linked economics, and data/IoT partners lifted hit-rates ~18% and cut claim frequency ~15% in 2024 pilots.
| Partner | Role | 2024 impact |
|---|---|---|
| Brokers | Distribution/placement | Majority of commercial business |
| Reinsurers | Risk transfer | Smoothed earnings, freed surplus |
| MGAs | Niche underwriting | Faster entry; performance fees |
| Data/IoT | Underwriting analytics | +18% hit-rate; -15% claims |
| Claims vendors | Loss control | Faster settlements, lower leakage |
What is included in the product
Detailed Word Document
A concise, pre-written Business Model Canvas for W. R. Berkley outlining customer segments (commercial, specialty, personal lines), channels (agents, brokers, direct), value propositions (underwriting discipline, risk expertise, diversified products), key activities, partners, revenue/cost structure and metrics, plus linked SWOT and competitive advantage insights for presentations and investor review.
Customizable Excel Spreadsheet
High-level, editable snapshot of W. R. Berkley’s insurance business model that condenses underwriting, distribution, and risk management into one page to quickly relieve analysis and communication pain points.
Activities
Specialized commercial underwriting
Specialized commercial underwriting focuses on industry- and exposure-tailored risk selection, pricing, and policy structuring to align coverage with client needs and loss drivers. Underwriters combine analytics, proprietary rating models, and experienced judgment to pursue target loss ratios and profitable account mixes. Operating units continuously refine appetite and underwriting guidelines based on portfolio performance and market conditions. File-and-use or prior-approval filings are used where state regulation requires them.
Claims management and litigation control
Triage, investigation and resolution prioritize indemnity and expense optimization, leveraging SIU to combat the FBI-estimated $40 billion annual insurance fraud loss (2024) and nurse case management to accelerate return-to-work and reduce claim duration. Early settlement is used where actuarially efficient to cap defense spend while defense panel management ensures consistent handling of complex liability files. Closed-loop feedback transmits claim insights to underwriting and risk engineering to tighten exposures and pricing.
Risk engineering and loss prevention
On-site surveys and virtual assessments identify hazards and yield actionable recommendations that reduce claim frequency and severity, with 2024 industry studies showing telematics and targeted controls can cut fleet crash frequency by up to 20%. Sector-specific protocols for workers’ comp, commercial auto, GL, and professional liability standardize mitigation and lower exposure. Client training and compliance support improve outcomes, and intervention data drives pricing credits and renewal decisions.
Capital, reinsurance, and portfolio management
W. R. Berkley allocates capacity across lines, geographies, and segments to optimize ROE, actively reshaping portfolios in 2024 around higher-return specialty and commercial lines. The firm buys reinsurance to limit tail risk and stabilize earnings, monitors reserves and catastrophe aggregation closely, and manages the cycle via rate, terms, and mix adjustments.
- Capacity allocation: dynamic by line/geography
- Reinsurance: tail-risk management
- Reserving & aggregation monitoring
- Cycle management: rate, terms, mix
Product development and regulatory compliance
Product development teams design coverage forms, endorsements and niche programs while supporting rate filings and policy administration across 50+ US jurisdictions and select international markets in 2024. Governance, risk and compliance controls ensure solvency and conduct standards are met. Continuous improvement of digital portals and straight-through processing reduces manual touchpoints and accelerates issuance.
- Coverage design: targeted niche programs
- Regulatory: 50+ jurisdictions rate filings
- GRC: solvency and conduct controls
- Operations: digital portals & STP
Specialty underwriting, digital STP target ~92% combined ratio, ~12% ROE
Specialty underwriting, claims handling, risk engineering and capital management drive profitable growth; 2024 targets: combined ratio ~92%, ROE ~12%, industry fraud loss ~$40B. Reinsurance and reserving limit tail risk; digital STP and 50+ jurisdiction filings speed issuance and compliance.
| Metric | 2024 |
|---|---|
| Combined ratio | ~92% |
| ROE | ~12% |
| Jurisdictions | 50+ |
Full Version Awaits
Business Model Canvas
The document you're previewing is the actual W. R. Berkley Business Model Canvas, not a mockup. When you purchase, you'll receive this same file with all content and sections included. It arrives ready to edit in Word and Excel formats. No surprises—what you see is what you get.











