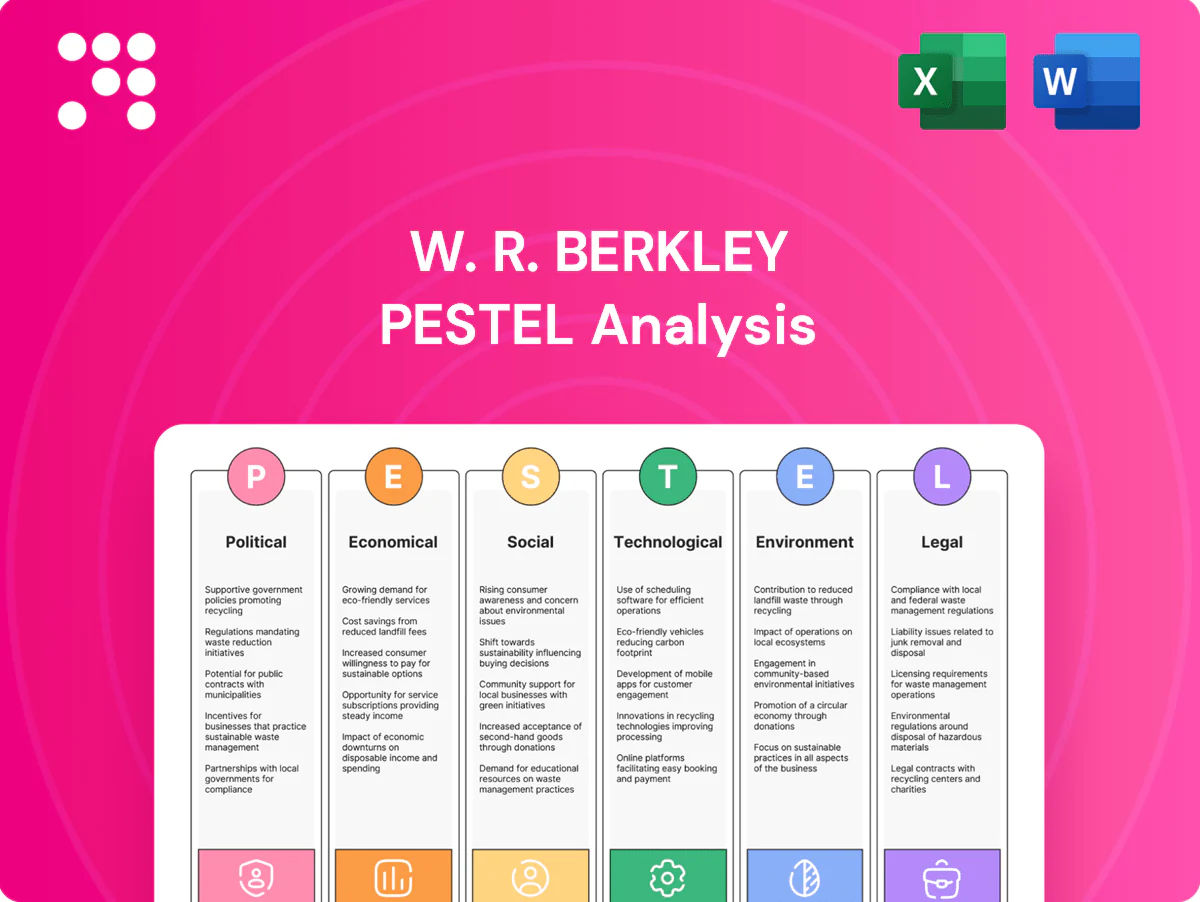
W. R. Berkley PESTLE Analysis

Your Competitive Advantage Starts with This Report
Unlock strategic clarity with our PESTLE Analysis of W. R. Berkley—three-to-five sentence snapshot revealing how political, economic, social, technological, legal, and environmental forces shape its outlook. Ideal for investors and strategists, this briefing highlights risks and opportunities. Purchase the full report to access detailed, actionable insights and ready-to-use charts.
Political factors

Regulatory stability
Insurance is governed primarily by 50 state regulators in the US, with rules on rates, forms and market conduct that shape W. R. Berkley’s underwriting and capital plans. Stable regulation supports predictable pricing and capital allocation, while sudden supervisory shifts can constrain product availability and pricing flexibility. W. R. Berkley, operating in 35+ jurisdictions, must sustain strong regulator relationships to preserve market access and pricing freedom.
Geopolitics and trade
Global tensions, sanctions, and trade restrictions are reshaping cross-border clients and reinsurance placements, forcing W. R. Berkley to reroute capacity and price for higher-risk corridors. Political risk alters insureds’ loss exposures across international supply chains, increasing frequency of contingent business interruption and trade-credit claims. Currency controls and import/export rules raise claim costs and narrow coverage scope in affected jurisdictions. Agile underwriting for multinational and specialty lines is essential to protect margins and maintain client access.

Public spending priorities
Public spending drives demand for construction, transport and professional liability covers: the $1.2 trillion Bipartisan Infrastructure Law and a roughly $842 billion US defense budget (FY2024) boost project- and defense-related insurance needs. Government-backed projects often require specialized wrap and performance solutions, while the $369 billion IRA and $52 billion CHIPS funding shift premiums toward energy transition and reshoring sectors. W. R. Berkley can reallocate underwriting units to target subsectors favored by these public investments.

Healthcare and labor policy
Changes to workers’ compensation statutes and healthcare reimbursement drive claims severity and medical inflation pressure on carriers; underwriting models must adapt as treatments and fee schedules shift. Minimum wage remains $7.25 federally, while state increases change employer cost structures and risk profiles. Political focus on workplace safety and inspection enforcement can reduce loss frequency but raise short-term claim reporting.
- Workers’ comp statutes: affect claim severity
- Healthcare reimbursement: alters loss costs
- Minimum wage $7.25: shifts employer risk
- Safety policy: impacts loss frequency
- Underwriting/risk engineering: mitigates volatility
Sanctions and compliance
Sanctions regimes such as OFAC, which administers more than 50 active programs, constrain who W. R. Berkley can insure and how claims are paid; rapid political shifts increase compliance complexity and operational costs. Breaches risk regulatory penalties and major reputational harm, so robust screening and escalation are essential across specialty and marine lines.
- OFAC: 50+ programs — limits counterparty access
- Rapid updates: increases monitoring costs and latency
- Controls: automated screening, escalation, governance
50 state regulators across 35+ jurisdictions reshape underwriting as public spend redirects premiums
State-based insurance regulation (50 regulators) and operations in 35+ jurisdictions drive underwriting, pricing and capital planning. Public spending (Bipartisan Infrastructure Law $1.2T; FY2024 defense $842B; IRA $369B) shifts premium opportunities to construction, energy and reshoring. OFAC 50+ sanctions programs and changing workers’ comp/healthcare rules raise compliance and claims-cost volatility.
| Factor | Metric |
|---|---|
| Regulation | 50 state regulators; 35+ jurisdictions |
| Public spend | $1.2T infra; $842B defense; $369B IRA |
| Sanctions | OFAC 50+ programs |
What is included in the product
 Detailed Word Document
Explores how Political, Economic, Social, Technological, Environmental and Legal forces uniquely affect W. R. Berkley’s insurance operations and competitive position. Each section is data-backed with current trends and forward-looking insights to help executives, investors and strategists identify risks, opportunities and actionable responses.

 Customizable Excel Spreadsheet
A concise, visually segmented PESTLE summary for W. R. Berkley that’s easy to drop into presentations or share across teams, enabling quick interpretation of regulatory, economic and market risks; editable notes let users tailor insights to region or business line for planning and client reports.
Economic factors

Interest rate environment
Portfolio yields drive investment income, a key earnings pillar for P&C carriers; with the 10-year U.S. Treasury near 4.3% in mid‑2025, rising rates have boosted reinvestment returns while pressuring bond market values. Duration management at W. R. Berkley balances higher coupon income against capital volatility from mark‑to‑market losses. The company’s earnings remain sensitive to future rate paths and credit spread movements.
Inflation and social inflation
US CPI rose 3.4% in 2024 (BLS), while medical inflation outpaced general inflation, elevating loss costs in auto, liability and workers’ comp. Social inflation from larger jury awards and litigation tactics has increased claim severity, pressuring pricing, limits and reinsurance structures to adjust quickly. Rigorous claims reserving discipline remains critical to protect underwriting margins.

Underwriting cycle
Commercial lines show hard/soft pricing cycles tied to capacity and loss experience; after 2023 catastrophe losses reinsurance rates rose roughly 10–20% into 2024, tightening capacity and prompting hard-market pricing. Capital inflows and reinsurer supply drive market tone while elevated catastrophe frequency raises loss picks. Berkley’s disciplined underwriting in hard markets and prudence in soft markets helps sustain ROE; its specialty focus dampens but does not eliminate cyclicality.

SME and sector health
SME health drives W. R. Berkley exposure because payroll and sales bases—key rating drivers for commercial lines—move with small business activity; US small businesses represent 99.9% of firms and about 47% of private-sector employment (SBA 2022), so downturns compress premium bases. Sector slowdowns shift demand for niche covers, credit tightening raises insolvency and delayed premium collections, while industry diversification cushions premium volatility.
- SME prevalence: 99.9% of US firms; ~47% private employment (SBA 2022)
- Credit risk: tighter lending increases insolvency and collection risk
- Diversification: multi-industry mix stabilizes premium volumes
Catastrophe loss volatility
Weather and secondary perils drive macro loss spikes that push rates and underwriting discipline; Aon reports 2023 global insured natural catastrophe losses near 94 billion USD and decade averages around 100 billion USD, prompting reinsurance pricing to rise about 20% in 2023–24. Post-event rebuilding increases exposures while capital adequacy and risk-aggregation limits remain critical for W. R. Berkley.
- NatCat insured losses ~94bn (2023)
- Decade avg ~100bn/year
- Reinsurance pricing +~20% (2023–24)
- Rebuilding expands exposure; capital & aggregation controls essential
50 state regulators across 35+ jurisdictions reshape underwriting as public spend redirects premiums
Higher interest rates (10y US Treasury ~4.3% mid‑2025) boost portfolio yields but raise mark‑to‑market volatility; investment income remains a key earnings driver. US CPI rose 3.4% in 2024; medical and social inflation increase claim severity and reserving pressure. NatCat insured losses ~94bn (2023) and reinsurance pricing +~20% (2023–24) tighten capacity, while SME exposure (99.9% firms; ~47% employment) links premium growth to small‑business cycles.
| Metric | Value |
|---|---|
| 10y Treasury (mid‑2025) | ~4.3% |
| US CPI (2024) | 3.4% |
| NatCat insured losses (2023) | ~$94bn |
| Reinsurance pricing (2023–24) | +~20% |
| US SME | 99.9% firms; ~47% employment |
Same Document Delivered
W. R. Berkley PESTLE Analysis
The preview shown here is the exact W. R. Berkley PESTLE Analysis you’ll receive after purchase—fully formatted and ready to use. The content, layout, and insights visible are the final document delivered exactly as shown, with no placeholders or teasers. After checkout you’ll instantly download this same file and can begin applying the PESTLE findings immediately.

Your Competitive Advantage Starts with This Report
Unlock strategic clarity with our PESTLE Analysis of W. R. Berkley—three-to-five sentence snapshot revealing how political, economic, social, technological, legal, and environmental forces shape its outlook. Ideal for investors and strategists, this briefing highlights risks and opportunities. Purchase the full report to access detailed, actionable insights and ready-to-use charts.
Political factors
Regulatory stability
Insurance is governed primarily by 50 state regulators in the US, with rules on rates, forms and market conduct that shape W. R. Berkley’s underwriting and capital plans. Stable regulation supports predictable pricing and capital allocation, while sudden supervisory shifts can constrain product availability and pricing flexibility. W. R. Berkley, operating in 35+ jurisdictions, must sustain strong regulator relationships to preserve market access and pricing freedom.
Geopolitics and trade
Global tensions, sanctions, and trade restrictions are reshaping cross-border clients and reinsurance placements, forcing W. R. Berkley to reroute capacity and price for higher-risk corridors. Political risk alters insureds’ loss exposures across international supply chains, increasing frequency of contingent business interruption and trade-credit claims. Currency controls and import/export rules raise claim costs and narrow coverage scope in affected jurisdictions. Agile underwriting for multinational and specialty lines is essential to protect margins and maintain client access.
Public spending priorities
Public spending drives demand for construction, transport and professional liability covers: the $1.2 trillion Bipartisan Infrastructure Law and a roughly $842 billion US defense budget (FY2024) boost project- and defense-related insurance needs. Government-backed projects often require specialized wrap and performance solutions, while the $369 billion IRA and $52 billion CHIPS funding shift premiums toward energy transition and reshoring sectors. W. R. Berkley can reallocate underwriting units to target subsectors favored by these public investments.
Healthcare and labor policy
Changes to workers’ compensation statutes and healthcare reimbursement drive claims severity and medical inflation pressure on carriers; underwriting models must adapt as treatments and fee schedules shift. Minimum wage remains $7.25 federally, while state increases change employer cost structures and risk profiles. Political focus on workplace safety and inspection enforcement can reduce loss frequency but raise short-term claim reporting.
- Workers’ comp statutes: affect claim severity
- Healthcare reimbursement: alters loss costs
- Minimum wage $7.25: shifts employer risk
- Safety policy: impacts loss frequency
- Underwriting/risk engineering: mitigates volatility
Sanctions and compliance
Sanctions regimes such as OFAC, which administers more than 50 active programs, constrain who W. R. Berkley can insure and how claims are paid; rapid political shifts increase compliance complexity and operational costs. Breaches risk regulatory penalties and major reputational harm, so robust screening and escalation are essential across specialty and marine lines.
- OFAC: 50+ programs — limits counterparty access
- Rapid updates: increases monitoring costs and latency
- Controls: automated screening, escalation, governance
50 state regulators across 35+ jurisdictions reshape underwriting as public spend redirects premiums
State-based insurance regulation (50 regulators) and operations in 35+ jurisdictions drive underwriting, pricing and capital planning. Public spending (Bipartisan Infrastructure Law $1.2T; FY2024 defense $842B; IRA $369B) shifts premium opportunities to construction, energy and reshoring. OFAC 50+ sanctions programs and changing workers’ comp/healthcare rules raise compliance and claims-cost volatility.
| Factor | Metric |
|---|---|
| Regulation | 50 state regulators; 35+ jurisdictions |
| Public spend | $1.2T infra; $842B defense; $369B IRA |
| Sanctions | OFAC 50+ programs |
What is included in the product
Detailed Word Document
Explores how Political, Economic, Social, Technological, Environmental and Legal forces uniquely affect W. R. Berkley’s insurance operations and competitive position. Each section is data-backed with current trends and forward-looking insights to help executives, investors and strategists identify risks, opportunities and actionable responses.
Customizable Excel Spreadsheet
A concise, visually segmented PESTLE summary for W. R. Berkley that’s easy to drop into presentations or share across teams, enabling quick interpretation of regulatory, economic and market risks; editable notes let users tailor insights to region or business line for planning and client reports.
Economic factors
Interest rate environment
Portfolio yields drive investment income, a key earnings pillar for P&C carriers; with the 10-year U.S. Treasury near 4.3% in mid‑2025, rising rates have boosted reinvestment returns while pressuring bond market values. Duration management at W. R. Berkley balances higher coupon income against capital volatility from mark‑to‑market losses. The company’s earnings remain sensitive to future rate paths and credit spread movements.
Inflation and social inflation
US CPI rose 3.4% in 2024 (BLS), while medical inflation outpaced general inflation, elevating loss costs in auto, liability and workers’ comp. Social inflation from larger jury awards and litigation tactics has increased claim severity, pressuring pricing, limits and reinsurance structures to adjust quickly. Rigorous claims reserving discipline remains critical to protect underwriting margins.
Underwriting cycle
Commercial lines show hard/soft pricing cycles tied to capacity and loss experience; after 2023 catastrophe losses reinsurance rates rose roughly 10–20% into 2024, tightening capacity and prompting hard-market pricing. Capital inflows and reinsurer supply drive market tone while elevated catastrophe frequency raises loss picks. Berkley’s disciplined underwriting in hard markets and prudence in soft markets helps sustain ROE; its specialty focus dampens but does not eliminate cyclicality.
SME and sector health
SME health drives W. R. Berkley exposure because payroll and sales bases—key rating drivers for commercial lines—move with small business activity; US small businesses represent 99.9% of firms and about 47% of private-sector employment (SBA 2022), so downturns compress premium bases. Sector slowdowns shift demand for niche covers, credit tightening raises insolvency and delayed premium collections, while industry diversification cushions premium volatility.
- SME prevalence: 99.9% of US firms; ~47% private employment (SBA 2022)
- Credit risk: tighter lending increases insolvency and collection risk
- Diversification: multi-industry mix stabilizes premium volumes
Catastrophe loss volatility
Weather and secondary perils drive macro loss spikes that push rates and underwriting discipline; Aon reports 2023 global insured natural catastrophe losses near 94 billion USD and decade averages around 100 billion USD, prompting reinsurance pricing to rise about 20% in 2023–24. Post-event rebuilding increases exposures while capital adequacy and risk-aggregation limits remain critical for W. R. Berkley.
- NatCat insured losses ~94bn (2023)
- Decade avg ~100bn/year
- Reinsurance pricing +~20% (2023–24)
- Rebuilding expands exposure; capital & aggregation controls essential
50 state regulators across 35+ jurisdictions reshape underwriting as public spend redirects premiums
Higher interest rates (10y US Treasury ~4.3% mid‑2025) boost portfolio yields but raise mark‑to‑market volatility; investment income remains a key earnings driver. US CPI rose 3.4% in 2024; medical and social inflation increase claim severity and reserving pressure. NatCat insured losses ~94bn (2023) and reinsurance pricing +~20% (2023–24) tighten capacity, while SME exposure (99.9% firms; ~47% employment) links premium growth to small‑business cycles.
| Metric | Value |
|---|---|
| 10y Treasury (mid‑2025) | ~4.3% |
| US CPI (2024) | 3.4% |
| NatCat insured losses (2023) | ~$94bn |
| Reinsurance pricing (2023–24) | +~20% |
| US SME | 99.9% firms; ~47% employment |
Same Document Delivered
W. R. Berkley PESTLE Analysis
The preview shown here is the exact W. R. Berkley PESTLE Analysis you’ll receive after purchase—fully formatted and ready to use. The content, layout, and insights visible are the final document delivered exactly as shown, with no placeholders or teasers. After checkout you’ll instantly download this same file and can begin applying the PESTLE findings immediately.
Description
Your Competitive Advantage Starts with This Report
Unlock strategic clarity with our PESTLE Analysis of W. R. Berkley—three-to-five sentence snapshot revealing how political, economic, social, technological, legal, and environmental forces shape its outlook. Ideal for investors and strategists, this briefing highlights risks and opportunities. Purchase the full report to access detailed, actionable insights and ready-to-use charts.
Political factors
Regulatory stability
Insurance is governed primarily by 50 state regulators in the US, with rules on rates, forms and market conduct that shape W. R. Berkley’s underwriting and capital plans. Stable regulation supports predictable pricing and capital allocation, while sudden supervisory shifts can constrain product availability and pricing flexibility. W. R. Berkley, operating in 35+ jurisdictions, must sustain strong regulator relationships to preserve market access and pricing freedom.
Geopolitics and trade
Global tensions, sanctions, and trade restrictions are reshaping cross-border clients and reinsurance placements, forcing W. R. Berkley to reroute capacity and price for higher-risk corridors. Political risk alters insureds’ loss exposures across international supply chains, increasing frequency of contingent business interruption and trade-credit claims. Currency controls and import/export rules raise claim costs and narrow coverage scope in affected jurisdictions. Agile underwriting for multinational and specialty lines is essential to protect margins and maintain client access.
Public spending priorities
Public spending drives demand for construction, transport and professional liability covers: the $1.2 trillion Bipartisan Infrastructure Law and a roughly $842 billion US defense budget (FY2024) boost project- and defense-related insurance needs. Government-backed projects often require specialized wrap and performance solutions, while the $369 billion IRA and $52 billion CHIPS funding shift premiums toward energy transition and reshoring sectors. W. R. Berkley can reallocate underwriting units to target subsectors favored by these public investments.
Healthcare and labor policy
Changes to workers’ compensation statutes and healthcare reimbursement drive claims severity and medical inflation pressure on carriers; underwriting models must adapt as treatments and fee schedules shift. Minimum wage remains $7.25 federally, while state increases change employer cost structures and risk profiles. Political focus on workplace safety and inspection enforcement can reduce loss frequency but raise short-term claim reporting.
- Workers’ comp statutes: affect claim severity
- Healthcare reimbursement: alters loss costs
- Minimum wage $7.25: shifts employer risk
- Safety policy: impacts loss frequency
- Underwriting/risk engineering: mitigates volatility
Sanctions and compliance
Sanctions regimes such as OFAC, which administers more than 50 active programs, constrain who W. R. Berkley can insure and how claims are paid; rapid political shifts increase compliance complexity and operational costs. Breaches risk regulatory penalties and major reputational harm, so robust screening and escalation are essential across specialty and marine lines.
- OFAC: 50+ programs — limits counterparty access
- Rapid updates: increases monitoring costs and latency
- Controls: automated screening, escalation, governance
50 state regulators across 35+ jurisdictions reshape underwriting as public spend redirects premiums
State-based insurance regulation (50 regulators) and operations in 35+ jurisdictions drive underwriting, pricing and capital planning. Public spending (Bipartisan Infrastructure Law $1.2T; FY2024 defense $842B; IRA $369B) shifts premium opportunities to construction, energy and reshoring. OFAC 50+ sanctions programs and changing workers’ comp/healthcare rules raise compliance and claims-cost volatility.
| Factor | Metric |
|---|---|
| Regulation | 50 state regulators; 35+ jurisdictions |
| Public spend | $1.2T infra; $842B defense; $369B IRA |
| Sanctions | OFAC 50+ programs |
What is included in the product
Detailed Word Document
Explores how Political, Economic, Social, Technological, Environmental and Legal forces uniquely affect W. R. Berkley’s insurance operations and competitive position. Each section is data-backed with current trends and forward-looking insights to help executives, investors and strategists identify risks, opportunities and actionable responses.
Customizable Excel Spreadsheet
A concise, visually segmented PESTLE summary for W. R. Berkley that’s easy to drop into presentations or share across teams, enabling quick interpretation of regulatory, economic and market risks; editable notes let users tailor insights to region or business line for planning and client reports.
Economic factors
Interest rate environment
Portfolio yields drive investment income, a key earnings pillar for P&C carriers; with the 10-year U.S. Treasury near 4.3% in mid‑2025, rising rates have boosted reinvestment returns while pressuring bond market values. Duration management at W. R. Berkley balances higher coupon income against capital volatility from mark‑to‑market losses. The company’s earnings remain sensitive to future rate paths and credit spread movements.
Inflation and social inflation
US CPI rose 3.4% in 2024 (BLS), while medical inflation outpaced general inflation, elevating loss costs in auto, liability and workers’ comp. Social inflation from larger jury awards and litigation tactics has increased claim severity, pressuring pricing, limits and reinsurance structures to adjust quickly. Rigorous claims reserving discipline remains critical to protect underwriting margins.
Underwriting cycle
Commercial lines show hard/soft pricing cycles tied to capacity and loss experience; after 2023 catastrophe losses reinsurance rates rose roughly 10–20% into 2024, tightening capacity and prompting hard-market pricing. Capital inflows and reinsurer supply drive market tone while elevated catastrophe frequency raises loss picks. Berkley’s disciplined underwriting in hard markets and prudence in soft markets helps sustain ROE; its specialty focus dampens but does not eliminate cyclicality.
SME and sector health
SME health drives W. R. Berkley exposure because payroll and sales bases—key rating drivers for commercial lines—move with small business activity; US small businesses represent 99.9% of firms and about 47% of private-sector employment (SBA 2022), so downturns compress premium bases. Sector slowdowns shift demand for niche covers, credit tightening raises insolvency and delayed premium collections, while industry diversification cushions premium volatility.
- SME prevalence: 99.9% of US firms; ~47% private employment (SBA 2022)
- Credit risk: tighter lending increases insolvency and collection risk
- Diversification: multi-industry mix stabilizes premium volumes
Catastrophe loss volatility
Weather and secondary perils drive macro loss spikes that push rates and underwriting discipline; Aon reports 2023 global insured natural catastrophe losses near 94 billion USD and decade averages around 100 billion USD, prompting reinsurance pricing to rise about 20% in 2023–24. Post-event rebuilding increases exposures while capital adequacy and risk-aggregation limits remain critical for W. R. Berkley.
- NatCat insured losses ~94bn (2023)
- Decade avg ~100bn/year
- Reinsurance pricing +~20% (2023–24)
- Rebuilding expands exposure; capital & aggregation controls essential
50 state regulators across 35+ jurisdictions reshape underwriting as public spend redirects premiums
Higher interest rates (10y US Treasury ~4.3% mid‑2025) boost portfolio yields but raise mark‑to‑market volatility; investment income remains a key earnings driver. US CPI rose 3.4% in 2024; medical and social inflation increase claim severity and reserving pressure. NatCat insured losses ~94bn (2023) and reinsurance pricing +~20% (2023–24) tighten capacity, while SME exposure (99.9% firms; ~47% employment) links premium growth to small‑business cycles.
| Metric | Value |
|---|---|
| 10y Treasury (mid‑2025) | ~4.3% |
| US CPI (2024) | 3.4% |
| NatCat insured losses (2023) | ~$94bn |
| Reinsurance pricing (2023–24) | +~20% |
| US SME | 99.9% firms; ~47% employment |
Same Document Delivered
W. R. Berkley PESTLE Analysis
The preview shown here is the exact W. R. Berkley PESTLE Analysis you’ll receive after purchase—fully formatted and ready to use. The content, layout, and insights visible are the final document delivered exactly as shown, with no placeholders or teasers. After checkout you’ll instantly download this same file and can begin applying the PESTLE findings immediately.











