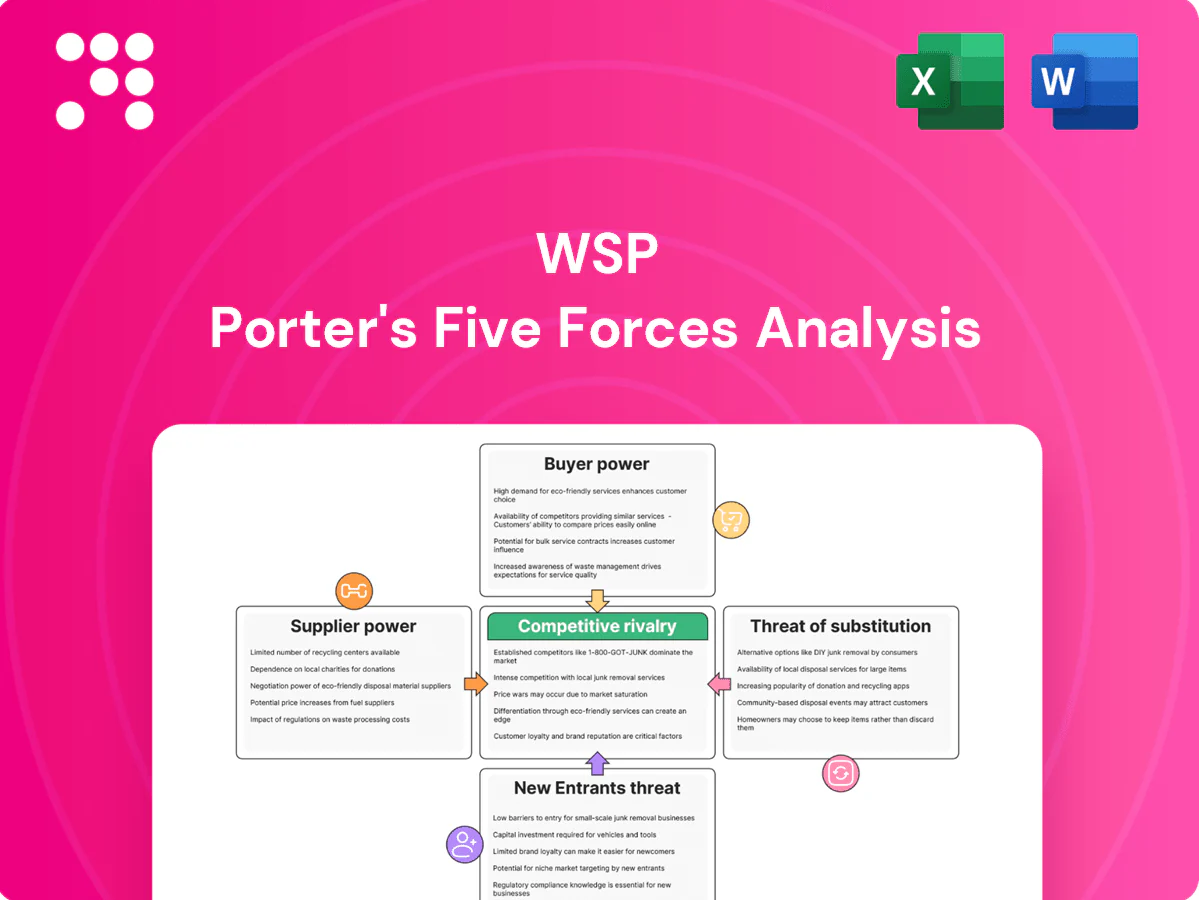
WSP Porter's Five Forces Analysis

From Overview to Strategy Blueprint
WSP faces varied competitive pressures—from strong client bargaining power in infrastructure contracts to moderate supplier influence and the persistent threat of skilled entrants and substitutes in technical services. This snapshot highlights key tension points but doesn't reveal force-by-force ratings or strategic implications. Unlock the full Porter's Five Forces Analysis to explore WSP’s competitive dynamics and market risks in depth.
Suppliers Bargaining Power

Specialist talent scarcity
Top-tier engineers, scientists and project managers are scarce, lifting wage and benefits pressure as senior hires increasingly demand premia and flexible terms; by 2024 WSP employed about 68,000 people globally, concentrating competition for certified and security-cleared specialists in regulated sectors. Certifications and clearances narrow talent pools and give senior practitioners negotiation leverage. WSP counters with global mobility, expanded graduate intake and targeted retention programs.
Dependence on core software platforms
Licenses for BIM, CAD, GIS, digital twin and modeling tools are concentrated: the top three vendors account for roughly ≈65% of the market, with Esri and Autodesk among dominant suppliers, giving them pricing power and contract leverage. High switching costs and retraining create lock-in, exacerbated by interoperability issues. Wider enterprise agreements and uptake of open standards (e.g., IFC, CityGML) have reduced exposure for large WSP clients.

Niche subcontractors and SMEs
Specialized ecology, geotechnical, heritage and surveying vendors are often critical to WSP bids, and 2024 industry surveys continued to flag specialist shortages that elevate their bargaining power. Scarcity in particular geographies or tight timelines amplifies leverage, with peak-demand windows pushing availability constraints and premium rates. Preferred panels, multi-year frameworks and proactive capacity planning are used to balance supplier power.

Data, permits, and testing providers
Access to proprietary datasets, permitting consultants, and accredited testing labs is often mandatory for WSP projects, giving suppliers strong leverage; 2024 industry reports noted lab lead times up ~20% and permit review medians of 90–180 days, driving cost premiums and schedule risk. Strict quality and chain-of-custody rules narrow viable alternatives, so strategic partnerships and dual-sourcing are used to reduce dependence.
- Mandatory datasets limit substitutes
- Lab lead times ↑ ~20% (2024)
- Permit reviews median 90–180 days (2024)
- Dual-sourcing and partnerships mitigate risk
Field equipment and specialty services
Geospatial, drilling and monitoring equipment suppliers drive cost on complex sites; logistics and HSE compliance—with logistics costs reaching over 30% of product value in some markets (World Bank)—add coordination burdens and elevate mobilization risks. Limited local availability constrains terms and lead times; owning select assets and bundling demand across projects improves bargaining leverage and reduces per-project mobilization.
- Suppliers influence cost and schedule
- Logistics/HSE can add >30% burden in some regions
- Local scarcity tightens terms
- Owned assets + demand bundling = greater leverage
Supplier power: 68k talent short, ≈65% software lock-in
Supplier power is high for talent, licenses and specialist services: WSP employed ~68,000 people in 2024, tightening skilled-labor supply and wage premia. Top-3 software vendors hold ≈65% market share, creating lock-in and switching costs. Lab lead times rose ~20% and permit reviews median 90–180 days in 2024, forcing dual-sourcing and asset ownership to mitigate risk.
| Metric | 2024 | Impact |
|---|---|---|
| Employees | ~68,000 | Talent scarcity |
| Top-3 software share | ≈65% | Vendor pricing power |
| Lab lead times | +~20% | Cost/schedule risk |
| Permit reviews | 90–180 days | Delay exposure |
What is included in the product
 Detailed Word Document
Tailored Porter’s Five Forces analysis for WSP that uncovers key competitive drivers, supplier and buyer power, barriers to entry, and substitute threats, while identifying disruptive trends that could erode market share; delivered in fully editable Word format for easy integration into reports, investor materials, or strategy decks.

 Customizable Excel Spreadsheet
A concise one-sheet WSP Porter's Five Forces summary for quick strategic clarity—customize pressure levels, visualize shifts with a radar chart, and drop the clean layout straight into decks or reports for fast, boardroom-ready decisions.
Customers Bargaining Power

Large public-sector buyers
Government agencies use standardized RFPs and competitive tendering that prioritize price and compliance, compressing margins for consultancies.
Framework agreements consolidate spend and enable frequent mini-competitions; public procurement represents roughly 12% of GDP and the EU market is about €2 trillion annually (2024 est).
Transparency rules and publication requirements heighten buyer leverage, so WSP leans on past performance, measurable social value and innovation credits to win tenders.
Private mega-clients and developers
Global owners and utilities bundle multi-year programs often spanning 3–10 years and negotiate volume discounts and master service agreements that compress margins. They routinely demand tighter SLAs, measurable KPIs and expanded liability terms, shifting more risk to suppliers. Switching costs are moderate due to extensive documentation and knowledge transfer, but deep relationships and integrated delivery models increase client stickiness.

Price sensitivity in commoditized scopes
Routine design, drafting and inspection services face intense price pressure. Buyers unbundle and multi-source to extract savings, often achieving up to 25% cost reduction. Rate cards and offshore delivery are compared aggressively, with offshore bids 30–50% lower. WSP counters with outcome-based pricing and standardized delivery centers.

Emphasis on ESG and innovation outcomes
Clients increasingly demand sustainability, resilience and digital deliverables, shifting negotiations from hourly rates to value-based outcomes; the EU CSRD rollout in 2024 amplified corporate demand for credible ESG metrics and reporting.
Proof points such as measured embodied carbon reductions and digital twins materially raise perceived differentiation and price elasticity, enabling WSP to justify premiums across advisory-to-delivery engagements.
- Value-based pricing
- CSRD 2024 drives ESG reporting
- Embodied carbon as sellable KPI
- Digital twins boost perceived differentiation
- Advisory-to-delivery supports premium capture
Contract risk allocation
Clients increasingly push for higher professional liability caps, onerous delay damages and strict performance guarantees, and Marsh reported professional liability rate increases of about 10–20% in 2024, compressing margins and raising earnings volatility for firms like WSP.
- Higher caps push insurance and balance-sheet costs
- Delay damages can erode 5–15% of project margins
- Negotiation strength depends on scarce expertise and tight timelines
- Robust screening and selective bidding preserve economics
Public procurement squeezes margins: 25%+ cuts, offshore 30-50% cheaper, liability +10-20%
Buyers (public ~12% GDP; EU procurement ≈ €2tn in 2024) push price/compliance, using frameworks and mini-competitions to compress margins. Routine services face 25%+ cost cuts; offshore bids 30–50% cheaper, driving value-based pricing and standardized delivery. Liability pressures (Marsh: professional liability rates +10–20% in 2024) and stricter SLAs shift risk to suppliers, increasing selective bidding.
| Metric | 2024 value |
|---|---|
| Public procurement share of GDP | ~12% |
| EU market | €2 trillion |
| Typical buyer cost reduction | ~25% |
| Offshore price gap | 30–50% |
| Liability rate change (Marsh) | +10–20% |
What You See Is What You Get
WSP Porter's Five Forces Analysis
This preview shows the exact WSP Porter's Five Forces Analysis you'll receive after purchase—no placeholders or samples. The document is fully formatted, professionally written and ready to download instantly. What you see here is precisely what you'll get.

From Overview to Strategy Blueprint
WSP faces varied competitive pressures—from strong client bargaining power in infrastructure contracts to moderate supplier influence and the persistent threat of skilled entrants and substitutes in technical services. This snapshot highlights key tension points but doesn't reveal force-by-force ratings or strategic implications. Unlock the full Porter's Five Forces Analysis to explore WSP’s competitive dynamics and market risks in depth.
Suppliers Bargaining Power
Specialist talent scarcity
Top-tier engineers, scientists and project managers are scarce, lifting wage and benefits pressure as senior hires increasingly demand premia and flexible terms; by 2024 WSP employed about 68,000 people globally, concentrating competition for certified and security-cleared specialists in regulated sectors. Certifications and clearances narrow talent pools and give senior practitioners negotiation leverage. WSP counters with global mobility, expanded graduate intake and targeted retention programs.
Dependence on core software platforms
Licenses for BIM, CAD, GIS, digital twin and modeling tools are concentrated: the top three vendors account for roughly ≈65% of the market, with Esri and Autodesk among dominant suppliers, giving them pricing power and contract leverage. High switching costs and retraining create lock-in, exacerbated by interoperability issues. Wider enterprise agreements and uptake of open standards (e.g., IFC, CityGML) have reduced exposure for large WSP clients.
Niche subcontractors and SMEs
Specialized ecology, geotechnical, heritage and surveying vendors are often critical to WSP bids, and 2024 industry surveys continued to flag specialist shortages that elevate their bargaining power. Scarcity in particular geographies or tight timelines amplifies leverage, with peak-demand windows pushing availability constraints and premium rates. Preferred panels, multi-year frameworks and proactive capacity planning are used to balance supplier power.
Data, permits, and testing providers
Access to proprietary datasets, permitting consultants, and accredited testing labs is often mandatory for WSP projects, giving suppliers strong leverage; 2024 industry reports noted lab lead times up ~20% and permit review medians of 90–180 days, driving cost premiums and schedule risk. Strict quality and chain-of-custody rules narrow viable alternatives, so strategic partnerships and dual-sourcing are used to reduce dependence.
- Mandatory datasets limit substitutes
- Lab lead times ↑ ~20% (2024)
- Permit reviews median 90–180 days (2024)
- Dual-sourcing and partnerships mitigate risk
Field equipment and specialty services
Geospatial, drilling and monitoring equipment suppliers drive cost on complex sites; logistics and HSE compliance—with logistics costs reaching over 30% of product value in some markets (World Bank)—add coordination burdens and elevate mobilization risks. Limited local availability constrains terms and lead times; owning select assets and bundling demand across projects improves bargaining leverage and reduces per-project mobilization.
- Suppliers influence cost and schedule
- Logistics/HSE can add >30% burden in some regions
- Local scarcity tightens terms
- Owned assets + demand bundling = greater leverage
Supplier power: 68k talent short, ≈65% software lock-in
Supplier power is high for talent, licenses and specialist services: WSP employed ~68,000 people in 2024, tightening skilled-labor supply and wage premia. Top-3 software vendors hold ≈65% market share, creating lock-in and switching costs. Lab lead times rose ~20% and permit reviews median 90–180 days in 2024, forcing dual-sourcing and asset ownership to mitigate risk.
| Metric | 2024 | Impact |
|---|---|---|
| Employees | ~68,000 | Talent scarcity |
| Top-3 software share | ≈65% | Vendor pricing power |
| Lab lead times | +~20% | Cost/schedule risk |
| Permit reviews | 90–180 days | Delay exposure |
What is included in the product
Detailed Word Document
Tailored Porter’s Five Forces analysis for WSP that uncovers key competitive drivers, supplier and buyer power, barriers to entry, and substitute threats, while identifying disruptive trends that could erode market share; delivered in fully editable Word format for easy integration into reports, investor materials, or strategy decks.
Customizable Excel Spreadsheet
A concise one-sheet WSP Porter's Five Forces summary for quick strategic clarity—customize pressure levels, visualize shifts with a radar chart, and drop the clean layout straight into decks or reports for fast, boardroom-ready decisions.
Customers Bargaining Power
Large public-sector buyers
Government agencies use standardized RFPs and competitive tendering that prioritize price and compliance, compressing margins for consultancies.
Framework agreements consolidate spend and enable frequent mini-competitions; public procurement represents roughly 12% of GDP and the EU market is about €2 trillion annually (2024 est).
Transparency rules and publication requirements heighten buyer leverage, so WSP leans on past performance, measurable social value and innovation credits to win tenders.
Private mega-clients and developers
Global owners and utilities bundle multi-year programs often spanning 3–10 years and negotiate volume discounts and master service agreements that compress margins. They routinely demand tighter SLAs, measurable KPIs and expanded liability terms, shifting more risk to suppliers. Switching costs are moderate due to extensive documentation and knowledge transfer, but deep relationships and integrated delivery models increase client stickiness.
Price sensitivity in commoditized scopes
Routine design, drafting and inspection services face intense price pressure. Buyers unbundle and multi-source to extract savings, often achieving up to 25% cost reduction. Rate cards and offshore delivery are compared aggressively, with offshore bids 30–50% lower. WSP counters with outcome-based pricing and standardized delivery centers.
Emphasis on ESG and innovation outcomes
Clients increasingly demand sustainability, resilience and digital deliverables, shifting negotiations from hourly rates to value-based outcomes; the EU CSRD rollout in 2024 amplified corporate demand for credible ESG metrics and reporting.
Proof points such as measured embodied carbon reductions and digital twins materially raise perceived differentiation and price elasticity, enabling WSP to justify premiums across advisory-to-delivery engagements.
- Value-based pricing
- CSRD 2024 drives ESG reporting
- Embodied carbon as sellable KPI
- Digital twins boost perceived differentiation
- Advisory-to-delivery supports premium capture
Contract risk allocation
Clients increasingly push for higher professional liability caps, onerous delay damages and strict performance guarantees, and Marsh reported professional liability rate increases of about 10–20% in 2024, compressing margins and raising earnings volatility for firms like WSP.
- Higher caps push insurance and balance-sheet costs
- Delay damages can erode 5–15% of project margins
- Negotiation strength depends on scarce expertise and tight timelines
- Robust screening and selective bidding preserve economics
Public procurement squeezes margins: 25%+ cuts, offshore 30-50% cheaper, liability +10-20%
Buyers (public ~12% GDP; EU procurement ≈ €2tn in 2024) push price/compliance, using frameworks and mini-competitions to compress margins. Routine services face 25%+ cost cuts; offshore bids 30–50% cheaper, driving value-based pricing and standardized delivery. Liability pressures (Marsh: professional liability rates +10–20% in 2024) and stricter SLAs shift risk to suppliers, increasing selective bidding.
| Metric | 2024 value |
|---|---|
| Public procurement share of GDP | ~12% |
| EU market | €2 trillion |
| Typical buyer cost reduction | ~25% |
| Offshore price gap | 30–50% |
| Liability rate change (Marsh) | +10–20% |
What You See Is What You Get
WSP Porter's Five Forces Analysis
This preview shows the exact WSP Porter's Five Forces Analysis you'll receive after purchase—no placeholders or samples. The document is fully formatted, professionally written and ready to download instantly. What you see here is precisely what you'll get.
Original: $10.00
-65%$10.00
$3.50Description
From Overview to Strategy Blueprint
WSP faces varied competitive pressures—from strong client bargaining power in infrastructure contracts to moderate supplier influence and the persistent threat of skilled entrants and substitutes in technical services. This snapshot highlights key tension points but doesn't reveal force-by-force ratings or strategic implications. Unlock the full Porter's Five Forces Analysis to explore WSP’s competitive dynamics and market risks in depth.
Suppliers Bargaining Power
Specialist talent scarcity
Top-tier engineers, scientists and project managers are scarce, lifting wage and benefits pressure as senior hires increasingly demand premia and flexible terms; by 2024 WSP employed about 68,000 people globally, concentrating competition for certified and security-cleared specialists in regulated sectors. Certifications and clearances narrow talent pools and give senior practitioners negotiation leverage. WSP counters with global mobility, expanded graduate intake and targeted retention programs.
Dependence on core software platforms
Licenses for BIM, CAD, GIS, digital twin and modeling tools are concentrated: the top three vendors account for roughly ≈65% of the market, with Esri and Autodesk among dominant suppliers, giving them pricing power and contract leverage. High switching costs and retraining create lock-in, exacerbated by interoperability issues. Wider enterprise agreements and uptake of open standards (e.g., IFC, CityGML) have reduced exposure for large WSP clients.
Niche subcontractors and SMEs
Specialized ecology, geotechnical, heritage and surveying vendors are often critical to WSP bids, and 2024 industry surveys continued to flag specialist shortages that elevate their bargaining power. Scarcity in particular geographies or tight timelines amplifies leverage, with peak-demand windows pushing availability constraints and premium rates. Preferred panels, multi-year frameworks and proactive capacity planning are used to balance supplier power.
Data, permits, and testing providers
Access to proprietary datasets, permitting consultants, and accredited testing labs is often mandatory for WSP projects, giving suppliers strong leverage; 2024 industry reports noted lab lead times up ~20% and permit review medians of 90–180 days, driving cost premiums and schedule risk. Strict quality and chain-of-custody rules narrow viable alternatives, so strategic partnerships and dual-sourcing are used to reduce dependence.
- Mandatory datasets limit substitutes
- Lab lead times ↑ ~20% (2024)
- Permit reviews median 90–180 days (2024)
- Dual-sourcing and partnerships mitigate risk
Field equipment and specialty services
Geospatial, drilling and monitoring equipment suppliers drive cost on complex sites; logistics and HSE compliance—with logistics costs reaching over 30% of product value in some markets (World Bank)—add coordination burdens and elevate mobilization risks. Limited local availability constrains terms and lead times; owning select assets and bundling demand across projects improves bargaining leverage and reduces per-project mobilization.
- Suppliers influence cost and schedule
- Logistics/HSE can add >30% burden in some regions
- Local scarcity tightens terms
- Owned assets + demand bundling = greater leverage
Supplier power: 68k talent short, ≈65% software lock-in
Supplier power is high for talent, licenses and specialist services: WSP employed ~68,000 people in 2024, tightening skilled-labor supply and wage premia. Top-3 software vendors hold ≈65% market share, creating lock-in and switching costs. Lab lead times rose ~20% and permit reviews median 90–180 days in 2024, forcing dual-sourcing and asset ownership to mitigate risk.
| Metric | 2024 | Impact |
|---|---|---|
| Employees | ~68,000 | Talent scarcity |
| Top-3 software share | ≈65% | Vendor pricing power |
| Lab lead times | +~20% | Cost/schedule risk |
| Permit reviews | 90–180 days | Delay exposure |
What is included in the product
Detailed Word Document
Tailored Porter’s Five Forces analysis for WSP that uncovers key competitive drivers, supplier and buyer power, barriers to entry, and substitute threats, while identifying disruptive trends that could erode market share; delivered in fully editable Word format for easy integration into reports, investor materials, or strategy decks.
Customizable Excel Spreadsheet
A concise one-sheet WSP Porter's Five Forces summary for quick strategic clarity—customize pressure levels, visualize shifts with a radar chart, and drop the clean layout straight into decks or reports for fast, boardroom-ready decisions.
Customers Bargaining Power
Large public-sector buyers
Government agencies use standardized RFPs and competitive tendering that prioritize price and compliance, compressing margins for consultancies.
Framework agreements consolidate spend and enable frequent mini-competitions; public procurement represents roughly 12% of GDP and the EU market is about €2 trillion annually (2024 est).
Transparency rules and publication requirements heighten buyer leverage, so WSP leans on past performance, measurable social value and innovation credits to win tenders.
Private mega-clients and developers
Global owners and utilities bundle multi-year programs often spanning 3–10 years and negotiate volume discounts and master service agreements that compress margins. They routinely demand tighter SLAs, measurable KPIs and expanded liability terms, shifting more risk to suppliers. Switching costs are moderate due to extensive documentation and knowledge transfer, but deep relationships and integrated delivery models increase client stickiness.
Price sensitivity in commoditized scopes
Routine design, drafting and inspection services face intense price pressure. Buyers unbundle and multi-source to extract savings, often achieving up to 25% cost reduction. Rate cards and offshore delivery are compared aggressively, with offshore bids 30–50% lower. WSP counters with outcome-based pricing and standardized delivery centers.
Emphasis on ESG and innovation outcomes
Clients increasingly demand sustainability, resilience and digital deliverables, shifting negotiations from hourly rates to value-based outcomes; the EU CSRD rollout in 2024 amplified corporate demand for credible ESG metrics and reporting.
Proof points such as measured embodied carbon reductions and digital twins materially raise perceived differentiation and price elasticity, enabling WSP to justify premiums across advisory-to-delivery engagements.
- Value-based pricing
- CSRD 2024 drives ESG reporting
- Embodied carbon as sellable KPI
- Digital twins boost perceived differentiation
- Advisory-to-delivery supports premium capture
Contract risk allocation
Clients increasingly push for higher professional liability caps, onerous delay damages and strict performance guarantees, and Marsh reported professional liability rate increases of about 10–20% in 2024, compressing margins and raising earnings volatility for firms like WSP.
- Higher caps push insurance and balance-sheet costs
- Delay damages can erode 5–15% of project margins
- Negotiation strength depends on scarce expertise and tight timelines
- Robust screening and selective bidding preserve economics
Public procurement squeezes margins: 25%+ cuts, offshore 30-50% cheaper, liability +10-20%
Buyers (public ~12% GDP; EU procurement ≈ €2tn in 2024) push price/compliance, using frameworks and mini-competitions to compress margins. Routine services face 25%+ cost cuts; offshore bids 30–50% cheaper, driving value-based pricing and standardized delivery. Liability pressures (Marsh: professional liability rates +10–20% in 2024) and stricter SLAs shift risk to suppliers, increasing selective bidding.
| Metric | 2024 value |
|---|---|
| Public procurement share of GDP | ~12% |
| EU market | €2 trillion |
| Typical buyer cost reduction | ~25% |
| Offshore price gap | 30–50% |
| Liability rate change (Marsh) | +10–20% |
What You See Is What You Get
WSP Porter's Five Forces Analysis
This preview shows the exact WSP Porter's Five Forces Analysis you'll receive after purchase—no placeholders or samples. The document is fully formatted, professionally written and ready to download instantly. What you see here is precisely what you'll get.











