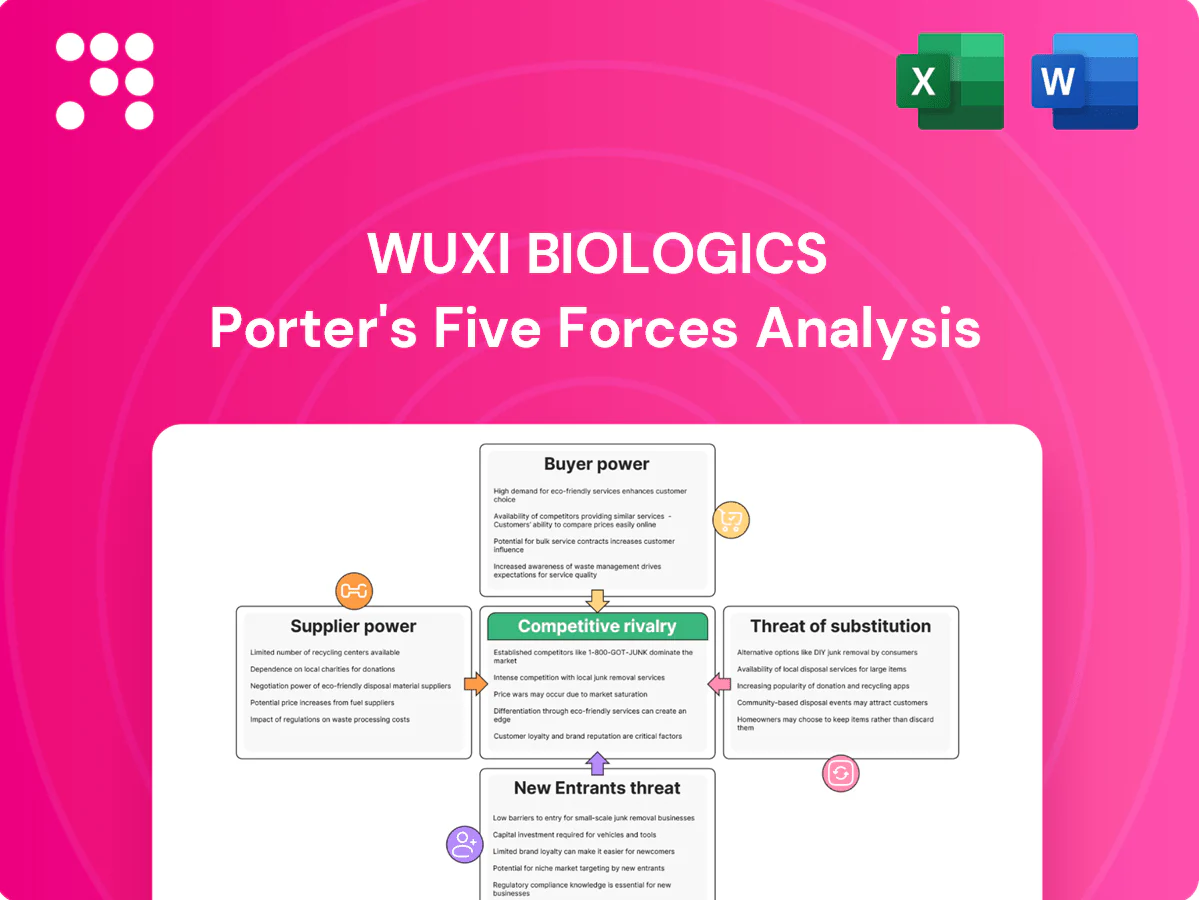
WuXi Biologics Porter's Five Forces Analysis

Don't Miss the Bigger Picture
WuXi Biologics faces high buyer power from large pharma, moderate supplier leverage tied to specialized inputs, and significant rivalry as contract development/manufacturing scales globally; barriers to entry are moderate but innovation and regulation limit substitutes. This brief snapshot only scratches the surface—unlock the full Porter's Five Forces Analysis to explore detailed force ratings, visuals, and strategic implications for WuXi Biologics.
Suppliers Bargaining Power

Concentrated bioprocess inputs
Critical inputs like single-use bioreactors, filters and Protein A resins are dominated by a few suppliers (roughly two-thirds of market share held by top vendors), increasing pricing and lead-time leverage. Historic supply shocks and COVID-era allocations showed project delays of months; allocations remain a risk for late-stage programs. Dual-sourcing is feasible but often unvalidated for late-stage processes; long-term framework agreements can partially mitigate volatility.
Specialized media and reagents
Cell culture media, growth factors and high-spec reagents are highly tailored and not interchangeable, giving suppliers strong bargaining power. Validation burdens—often requiring 3–6 months and extensive requalification—raise switching costs materially. Price increases can be passed through unless contracts explicitly cap them or include pass-through clauses. Security-of-supply programs (multi-sourcing, safety stock) have become essential.

Equipment and automation dependencies
Process equipment and control software ecosystems such as DeltaV and PAT tools create operational lock-in through training, SOPs and validation, raising switching costs and concentrating leverage with a few suppliers. Upgrade and maintenance windows directly affect uptime and capacity, with industry estimates in 2024 projecting biopharma automation market growth near an 8% CAGR through 2030, increasing vendor influence. Vendors often bundle premium service contracts, and while standardization scales WuXi Biologics’ ops, it shifts bargaining power upstream.

IP and technology licensors
Access to expression systems, cell lines and proprietary platforms can involve royalties and field-of-use limits; industry platform licensing royalty rates commonly range 2–6% of net sales (2024) and field restrictions limit application scope. Licensors can dictate tech-transfer timelines and compliance terms; typical tech transfers take 6–12 months and increase CAPEX/validation costs. Negotiation leverage rises with platform uniqueness; open platforms such as CHO-K1 or HEK293 reduce dependence but may impact yield or speed.
- royalty-range: 2–6% (2024)
- tech-transfer-time: 6–12 months
- leverage-factor: platform uniqueness ↑ rates/exclusivity
- alternative-platforms: CHO-K1/HEK293 can lower dependence but affect performance
Logistics and cold-chain services
Temperature-controlled shipping for drug substance depends on specialized carriers and pharma-qualified passive/active containers, with airfreight rates having spiked over 100% during 2020–21, highlighting supplier leverage. Route restrictions and customs increase transit times and costs, while carriers can impose surcharges during capacity crunches. Regionalizing supply chains hedges disruption risk but raises inventory and coordination complexity.
- Specialized carriers: high switching costs
- Route/customs: added lead-time/cost
- Surcharges: elevated in crunches (post‑2020 spikes)
- Regionalization: lower disruption risk, higher complexity
Supplier concentration and lock-in drive higher costs, longer lead times in bioprocessing
Suppliers of single-use systems, Protein A and specialized reagents concentrate market power (top vendors ~66%), raising prices and lead times; historic shocks caused multi-month delays. Validation/tech-transfer (6–12 months) and licensing royalties (2–6% in 2024) increase switching costs. Logistics and automation vendor lock-in (automation ~8% CAGR to 2030) further strengthen supplier leverage.
| Metric | Value |
|---|---|
| Top-vendor share | ~66% |
| Tech-transfer time | 6–12 months |
| Royalty range (2024) | 2–6% |
| Automation market CAGR | ~8% (2024–2030) |
| Airfreight spike | >100% (2020–21) |
What is included in the product
 Detailed Word Document
Uncovers key drivers of competition, buyer and supplier power, entry barriers and substitute threats tailored exclusively to WuXi Biologics, identifying disruptive forces and emerging risks that could erode market share and margins while highlighting protective dynamics that sustain its incumbency.

 Customizable Excel Spreadsheet
A clear, one-sheet Porter's Five Forces snapshot for WuXi Biologics—visualizes supplier, buyer, rivalry, entrant and substitute pressures and lets you customize pressure levels for swift strategic decisions and ready-to-use pitch or board slides.
Customers Bargaining Power

Diverse client mix dynamics
WuXi Biologics faces varied customer bargaining power: global pharma, biotech startups, and biosimilar firms exert different clout—big pharma, with industry R&D spend topping roughly USD 200 billion annually, wins volume discounts and priority slots. Early-stage biotechs are price-sensitive but pay premiums for speed and regulatory guidance. A diversified client portfolio reduces reliance on any single buyer and tempers concentration risk.
High switching costs mid-development
Transferring processes between CRDMOs risks delays and comparability issues that can interrupt timelines; technology transfer often requires 6–12 months and detailed comparability studies. As programs advance, revalidation and regulatory updates can add months and multimillion-dollar costs, reducing buyer leverage after Phase 1/2. Multi-sourcing mitigates risk but increases coordination and oversight burdens for sponsors.

Capacity tightness vs price pressure
When biologics CDMO capacity tightens, buyers tolerate higher prices and extended lead times, while in looser cycles RFP-driven procurement forces price concessions; slot flexibility and technical depth then serve as tie-breakers. WuXi Biologics leverages its end-to-end platform and broad modality capabilities to capture share beyond pure price, winning projects where integrated services reduce customer time-to-clinic.

Quality and regulatory track record
Buyers weight inspection history, batch success rates, and right‑first‑time metrics heavily; WuXi Biologics reported a 2024 audit pass rate above 95%, which reduces perceived delivery risk and limits buyer pushback. Any citation, recall, or batch delay can quickly shift leverage back to customers. Transparent metrics and mature QMS strengthen negotiating position.
- Inspection history: reported >95% audit pass (2024)
- Batch success: high right‑first‑time rates reduce premium pressure
- QMS maturity: transparent KPIs lower buyer bargaining power
Geopolitics and localization demands
US and EU sponsors increasingly prefer manufacturing within their jurisdictions for policy and supply‑risk reasons, constraining WuXi Biologics site selection and commercial terms. Buyers often demand regional redundancy and qualified backups, raising capital and operational costs for providers. Meeting localization wins client commitments but forces pricing and margin trade‑offs for WuXi.
- Localization preference increases negotiation leverage; regional redundancy raises provider CAPEX/OPEX; meeting demands can secure contracts at lower margins.
CDMO buyer power split: big pharma volumes vs biotech speed premiums
WuXi Biologics faces mixed buyer power: big pharma (global R&D ~USD 200 billion annually) secures volume leverage, while biotechs pay premiums for speed and regulatory support. Tech transfers typically take 6–12 months, reducing buyer exit flexibility after early phases. Reported audit pass rate >95% (2024) strengthens WuXi’s negotiating position.
| Metric | 2024 |
|---|---|
| Global pharma R&D spend | ~USD 200B |
| Tech transfer time | 6–12 months |
| Audit pass rate | >95% |
Same Document Delivered
WuXi Biologics Porter's Five Forces Analysis
This preview shows the exact Porter’s Five Forces analysis of WuXi Biologics you’ll receive immediately after purchase—no surprises or placeholders. The document is fully formatted, professionally written, and ready for download and use the moment you buy. It covers competitive rivalry, supplier and buyer power, threats of entry and substitution, and strategic implications for stakeholders.

Don't Miss the Bigger Picture
WuXi Biologics faces high buyer power from large pharma, moderate supplier leverage tied to specialized inputs, and significant rivalry as contract development/manufacturing scales globally; barriers to entry are moderate but innovation and regulation limit substitutes. This brief snapshot only scratches the surface—unlock the full Porter's Five Forces Analysis to explore detailed force ratings, visuals, and strategic implications for WuXi Biologics.
Suppliers Bargaining Power
Concentrated bioprocess inputs
Critical inputs like single-use bioreactors, filters and Protein A resins are dominated by a few suppliers (roughly two-thirds of market share held by top vendors), increasing pricing and lead-time leverage. Historic supply shocks and COVID-era allocations showed project delays of months; allocations remain a risk for late-stage programs. Dual-sourcing is feasible but often unvalidated for late-stage processes; long-term framework agreements can partially mitigate volatility.
Specialized media and reagents
Cell culture media, growth factors and high-spec reagents are highly tailored and not interchangeable, giving suppliers strong bargaining power. Validation burdens—often requiring 3–6 months and extensive requalification—raise switching costs materially. Price increases can be passed through unless contracts explicitly cap them or include pass-through clauses. Security-of-supply programs (multi-sourcing, safety stock) have become essential.
Equipment and automation dependencies
Process equipment and control software ecosystems such as DeltaV and PAT tools create operational lock-in through training, SOPs and validation, raising switching costs and concentrating leverage with a few suppliers. Upgrade and maintenance windows directly affect uptime and capacity, with industry estimates in 2024 projecting biopharma automation market growth near an 8% CAGR through 2030, increasing vendor influence. Vendors often bundle premium service contracts, and while standardization scales WuXi Biologics’ ops, it shifts bargaining power upstream.
IP and technology licensors
Access to expression systems, cell lines and proprietary platforms can involve royalties and field-of-use limits; industry platform licensing royalty rates commonly range 2–6% of net sales (2024) and field restrictions limit application scope. Licensors can dictate tech-transfer timelines and compliance terms; typical tech transfers take 6–12 months and increase CAPEX/validation costs. Negotiation leverage rises with platform uniqueness; open platforms such as CHO-K1 or HEK293 reduce dependence but may impact yield or speed.
- royalty-range: 2–6% (2024)
- tech-transfer-time: 6–12 months
- leverage-factor: platform uniqueness ↑ rates/exclusivity
- alternative-platforms: CHO-K1/HEK293 can lower dependence but affect performance
Logistics and cold-chain services
Temperature-controlled shipping for drug substance depends on specialized carriers and pharma-qualified passive/active containers, with airfreight rates having spiked over 100% during 2020–21, highlighting supplier leverage. Route restrictions and customs increase transit times and costs, while carriers can impose surcharges during capacity crunches. Regionalizing supply chains hedges disruption risk but raises inventory and coordination complexity.
- Specialized carriers: high switching costs
- Route/customs: added lead-time/cost
- Surcharges: elevated in crunches (post‑2020 spikes)
- Regionalization: lower disruption risk, higher complexity
Supplier concentration and lock-in drive higher costs, longer lead times in bioprocessing
Suppliers of single-use systems, Protein A and specialized reagents concentrate market power (top vendors ~66%), raising prices and lead times; historic shocks caused multi-month delays. Validation/tech-transfer (6–12 months) and licensing royalties (2–6% in 2024) increase switching costs. Logistics and automation vendor lock-in (automation ~8% CAGR to 2030) further strengthen supplier leverage.
| Metric | Value |
|---|---|
| Top-vendor share | ~66% |
| Tech-transfer time | 6–12 months |
| Royalty range (2024) | 2–6% |
| Automation market CAGR | ~8% (2024–2030) |
| Airfreight spike | >100% (2020–21) |
What is included in the product
Detailed Word Document
Uncovers key drivers of competition, buyer and supplier power, entry barriers and substitute threats tailored exclusively to WuXi Biologics, identifying disruptive forces and emerging risks that could erode market share and margins while highlighting protective dynamics that sustain its incumbency.
Customizable Excel Spreadsheet
A clear, one-sheet Porter's Five Forces snapshot for WuXi Biologics—visualizes supplier, buyer, rivalry, entrant and substitute pressures and lets you customize pressure levels for swift strategic decisions and ready-to-use pitch or board slides.
Customers Bargaining Power
Diverse client mix dynamics
WuXi Biologics faces varied customer bargaining power: global pharma, biotech startups, and biosimilar firms exert different clout—big pharma, with industry R&D spend topping roughly USD 200 billion annually, wins volume discounts and priority slots. Early-stage biotechs are price-sensitive but pay premiums for speed and regulatory guidance. A diversified client portfolio reduces reliance on any single buyer and tempers concentration risk.
High switching costs mid-development
Transferring processes between CRDMOs risks delays and comparability issues that can interrupt timelines; technology transfer often requires 6–12 months and detailed comparability studies. As programs advance, revalidation and regulatory updates can add months and multimillion-dollar costs, reducing buyer leverage after Phase 1/2. Multi-sourcing mitigates risk but increases coordination and oversight burdens for sponsors.
Capacity tightness vs price pressure
When biologics CDMO capacity tightens, buyers tolerate higher prices and extended lead times, while in looser cycles RFP-driven procurement forces price concessions; slot flexibility and technical depth then serve as tie-breakers. WuXi Biologics leverages its end-to-end platform and broad modality capabilities to capture share beyond pure price, winning projects where integrated services reduce customer time-to-clinic.
Quality and regulatory track record
Buyers weight inspection history, batch success rates, and right‑first‑time metrics heavily; WuXi Biologics reported a 2024 audit pass rate above 95%, which reduces perceived delivery risk and limits buyer pushback. Any citation, recall, or batch delay can quickly shift leverage back to customers. Transparent metrics and mature QMS strengthen negotiating position.
- Inspection history: reported >95% audit pass (2024)
- Batch success: high right‑first‑time rates reduce premium pressure
- QMS maturity: transparent KPIs lower buyer bargaining power
Geopolitics and localization demands
US and EU sponsors increasingly prefer manufacturing within their jurisdictions for policy and supply‑risk reasons, constraining WuXi Biologics site selection and commercial terms. Buyers often demand regional redundancy and qualified backups, raising capital and operational costs for providers. Meeting localization wins client commitments but forces pricing and margin trade‑offs for WuXi.
- Localization preference increases negotiation leverage; regional redundancy raises provider CAPEX/OPEX; meeting demands can secure contracts at lower margins.
CDMO buyer power split: big pharma volumes vs biotech speed premiums
WuXi Biologics faces mixed buyer power: big pharma (global R&D ~USD 200 billion annually) secures volume leverage, while biotechs pay premiums for speed and regulatory support. Tech transfers typically take 6–12 months, reducing buyer exit flexibility after early phases. Reported audit pass rate >95% (2024) strengthens WuXi’s negotiating position.
| Metric | 2024 |
|---|---|
| Global pharma R&D spend | ~USD 200B |
| Tech transfer time | 6–12 months |
| Audit pass rate | >95% |
Same Document Delivered
WuXi Biologics Porter's Five Forces Analysis
This preview shows the exact Porter’s Five Forces analysis of WuXi Biologics you’ll receive immediately after purchase—no surprises or placeholders. The document is fully formatted, professionally written, and ready for download and use the moment you buy. It covers competitive rivalry, supplier and buyer power, threats of entry and substitution, and strategic implications for stakeholders.
Original: $10.00
-65%$10.00
$3.50Description
Don't Miss the Bigger Picture
WuXi Biologics faces high buyer power from large pharma, moderate supplier leverage tied to specialized inputs, and significant rivalry as contract development/manufacturing scales globally; barriers to entry are moderate but innovation and regulation limit substitutes. This brief snapshot only scratches the surface—unlock the full Porter's Five Forces Analysis to explore detailed force ratings, visuals, and strategic implications for WuXi Biologics.
Suppliers Bargaining Power
Concentrated bioprocess inputs
Critical inputs like single-use bioreactors, filters and Protein A resins are dominated by a few suppliers (roughly two-thirds of market share held by top vendors), increasing pricing and lead-time leverage. Historic supply shocks and COVID-era allocations showed project delays of months; allocations remain a risk for late-stage programs. Dual-sourcing is feasible but often unvalidated for late-stage processes; long-term framework agreements can partially mitigate volatility.
Specialized media and reagents
Cell culture media, growth factors and high-spec reagents are highly tailored and not interchangeable, giving suppliers strong bargaining power. Validation burdens—often requiring 3–6 months and extensive requalification—raise switching costs materially. Price increases can be passed through unless contracts explicitly cap them or include pass-through clauses. Security-of-supply programs (multi-sourcing, safety stock) have become essential.
Equipment and automation dependencies
Process equipment and control software ecosystems such as DeltaV and PAT tools create operational lock-in through training, SOPs and validation, raising switching costs and concentrating leverage with a few suppliers. Upgrade and maintenance windows directly affect uptime and capacity, with industry estimates in 2024 projecting biopharma automation market growth near an 8% CAGR through 2030, increasing vendor influence. Vendors often bundle premium service contracts, and while standardization scales WuXi Biologics’ ops, it shifts bargaining power upstream.
IP and technology licensors
Access to expression systems, cell lines and proprietary platforms can involve royalties and field-of-use limits; industry platform licensing royalty rates commonly range 2–6% of net sales (2024) and field restrictions limit application scope. Licensors can dictate tech-transfer timelines and compliance terms; typical tech transfers take 6–12 months and increase CAPEX/validation costs. Negotiation leverage rises with platform uniqueness; open platforms such as CHO-K1 or HEK293 reduce dependence but may impact yield or speed.
- royalty-range: 2–6% (2024)
- tech-transfer-time: 6–12 months
- leverage-factor: platform uniqueness ↑ rates/exclusivity
- alternative-platforms: CHO-K1/HEK293 can lower dependence but affect performance
Logistics and cold-chain services
Temperature-controlled shipping for drug substance depends on specialized carriers and pharma-qualified passive/active containers, with airfreight rates having spiked over 100% during 2020–21, highlighting supplier leverage. Route restrictions and customs increase transit times and costs, while carriers can impose surcharges during capacity crunches. Regionalizing supply chains hedges disruption risk but raises inventory and coordination complexity.
- Specialized carriers: high switching costs
- Route/customs: added lead-time/cost
- Surcharges: elevated in crunches (post‑2020 spikes)
- Regionalization: lower disruption risk, higher complexity
Supplier concentration and lock-in drive higher costs, longer lead times in bioprocessing
Suppliers of single-use systems, Protein A and specialized reagents concentrate market power (top vendors ~66%), raising prices and lead times; historic shocks caused multi-month delays. Validation/tech-transfer (6–12 months) and licensing royalties (2–6% in 2024) increase switching costs. Logistics and automation vendor lock-in (automation ~8% CAGR to 2030) further strengthen supplier leverage.
| Metric | Value |
|---|---|
| Top-vendor share | ~66% |
| Tech-transfer time | 6–12 months |
| Royalty range (2024) | 2–6% |
| Automation market CAGR | ~8% (2024–2030) |
| Airfreight spike | >100% (2020–21) |
What is included in the product
Detailed Word Document
Uncovers key drivers of competition, buyer and supplier power, entry barriers and substitute threats tailored exclusively to WuXi Biologics, identifying disruptive forces and emerging risks that could erode market share and margins while highlighting protective dynamics that sustain its incumbency.
Customizable Excel Spreadsheet
A clear, one-sheet Porter's Five Forces snapshot for WuXi Biologics—visualizes supplier, buyer, rivalry, entrant and substitute pressures and lets you customize pressure levels for swift strategic decisions and ready-to-use pitch or board slides.
Customers Bargaining Power
Diverse client mix dynamics
WuXi Biologics faces varied customer bargaining power: global pharma, biotech startups, and biosimilar firms exert different clout—big pharma, with industry R&D spend topping roughly USD 200 billion annually, wins volume discounts and priority slots. Early-stage biotechs are price-sensitive but pay premiums for speed and regulatory guidance. A diversified client portfolio reduces reliance on any single buyer and tempers concentration risk.
High switching costs mid-development
Transferring processes between CRDMOs risks delays and comparability issues that can interrupt timelines; technology transfer often requires 6–12 months and detailed comparability studies. As programs advance, revalidation and regulatory updates can add months and multimillion-dollar costs, reducing buyer leverage after Phase 1/2. Multi-sourcing mitigates risk but increases coordination and oversight burdens for sponsors.
Capacity tightness vs price pressure
When biologics CDMO capacity tightens, buyers tolerate higher prices and extended lead times, while in looser cycles RFP-driven procurement forces price concessions; slot flexibility and technical depth then serve as tie-breakers. WuXi Biologics leverages its end-to-end platform and broad modality capabilities to capture share beyond pure price, winning projects where integrated services reduce customer time-to-clinic.
Quality and regulatory track record
Buyers weight inspection history, batch success rates, and right‑first‑time metrics heavily; WuXi Biologics reported a 2024 audit pass rate above 95%, which reduces perceived delivery risk and limits buyer pushback. Any citation, recall, or batch delay can quickly shift leverage back to customers. Transparent metrics and mature QMS strengthen negotiating position.
- Inspection history: reported >95% audit pass (2024)
- Batch success: high right‑first‑time rates reduce premium pressure
- QMS maturity: transparent KPIs lower buyer bargaining power
Geopolitics and localization demands
US and EU sponsors increasingly prefer manufacturing within their jurisdictions for policy and supply‑risk reasons, constraining WuXi Biologics site selection and commercial terms. Buyers often demand regional redundancy and qualified backups, raising capital and operational costs for providers. Meeting localization wins client commitments but forces pricing and margin trade‑offs for WuXi.
- Localization preference increases negotiation leverage; regional redundancy raises provider CAPEX/OPEX; meeting demands can secure contracts at lower margins.
CDMO buyer power split: big pharma volumes vs biotech speed premiums
WuXi Biologics faces mixed buyer power: big pharma (global R&D ~USD 200 billion annually) secures volume leverage, while biotechs pay premiums for speed and regulatory support. Tech transfers typically take 6–12 months, reducing buyer exit flexibility after early phases. Reported audit pass rate >95% (2024) strengthens WuXi’s negotiating position.
| Metric | 2024 |
|---|---|
| Global pharma R&D spend | ~USD 200B |
| Tech transfer time | 6–12 months |
| Audit pass rate | >95% |
Same Document Delivered
WuXi Biologics Porter's Five Forces Analysis
This preview shows the exact Porter’s Five Forces analysis of WuXi Biologics you’ll receive immediately after purchase—no surprises or placeholders. The document is fully formatted, professionally written, and ready for download and use the moment you buy. It covers competitive rivalry, supplier and buyer power, threats of entry and substitution, and strategic implications for stakeholders.











