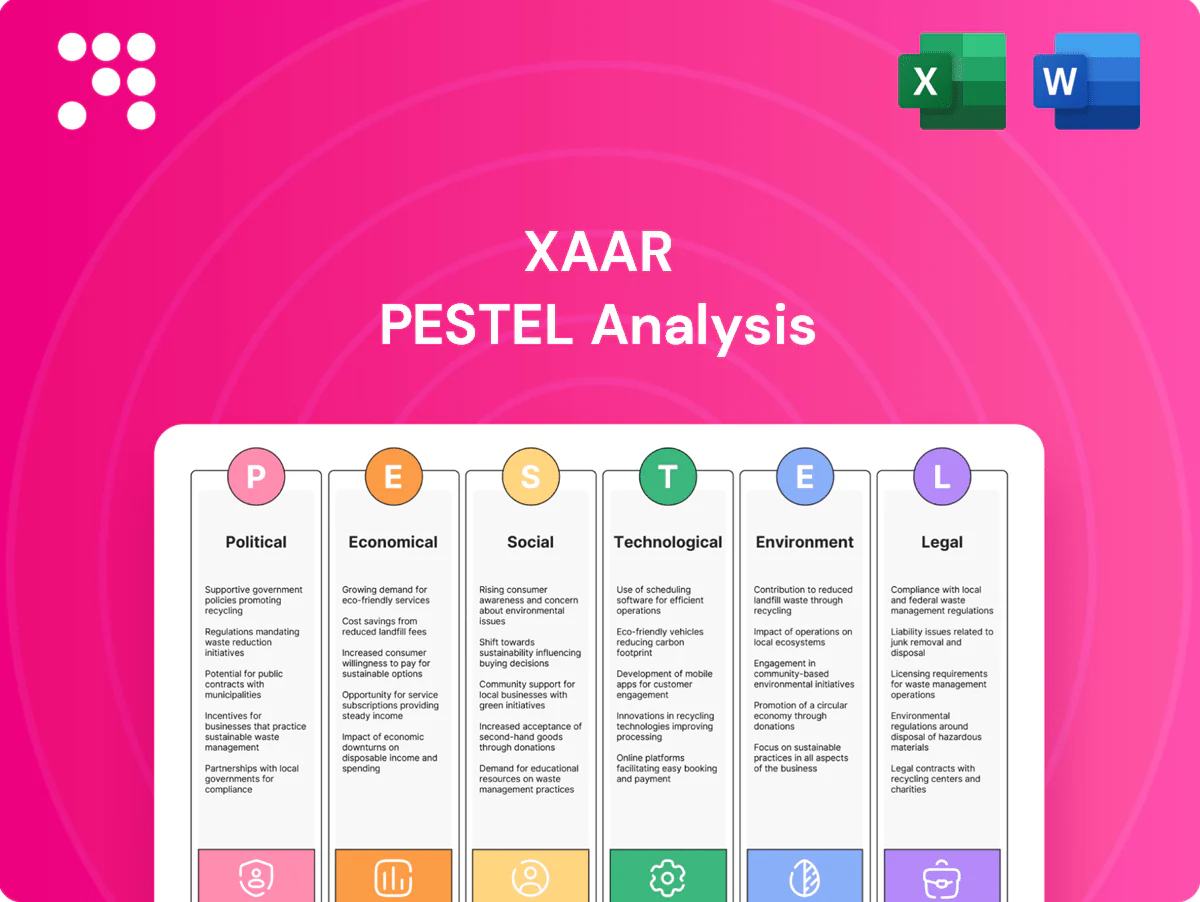
Xaar PESTLE Analysis

Plan Smarter. Present Sharper. Compete Stronger.
Gain a strategic edge with our PESTLE Analysis of Xaar — three to five concise sections revealing how political shifts, economic trends, and tech advances shape its outlook. Ideal for investors and strategists; buy the full report for the complete, actionable breakdown and ready-to-use insights.
Political factors

Trade policy volatility
Shifts in tariffs and trade agreements—including US Section 301 duties of up to 25% on roughly $250bn of Chinese goods—can raise costs for precision parts and electronics used in Xaar printheads. US‑EU‑China tensions risk constraining access to Asian manufacturing ecosystems key to inkjet supply chains. Proactive dual‑sourcing and localized assembly reduce exposure, and close monitoring of customs classifications for printheads and inks is essential to avoid sudden duty hikes.
Industrial strategy incentives
EU Recovery and Resilience Facility mobilising €723.8bn and US programmes such as CHIPS ($52bn) and the Inflation Reduction Act (~$369bn) channel subsidies toward advanced manufacturing, digitalisation and reshoring, lowering capex barriers for customers adopting digital print. Xaar can co-fund pilots via national productivity programmes and join innovation clusters to speed market access. Grant compliance and reporting increase administrative burden but materially reduce net costs.

Standards and certification alignment
Political bodies back safety and interoperability standards and ISO/TC 130 (graphic technology) directly influences printhead compatibility. Harmonized standards ease cross‑border sales of printheads integrated into OEM equipment across the EU single market. UKCA marking was introduced on 1 January 2021, creating potential divergence from CE requirements. Continued engagement in standards forums protects Xaar’s interests and reduces costly incompatibility testing.

Public procurement and localization
Public procurement and localization drive OEM selection in printing and packaging; OECD data show public procurement represents about 12% of GDP, making localization a strategic priority in bids for government work. Positioning Xaar as an enabler of domestic manufacturing and mapping supply chains transparently supports localization audits and wins in politically sensitive markets.
- Local procurement share: public procurement ≈12% GDP (OECD)
- Supply-chain mapping: aids localization audits
- Domestic enablement: strengthens government bid competitiveness
- Regional networks: signal commitment to local industry
Geopolitical supply security
Sanctions or export restrictions on semiconductors, piezo materials or precision ceramics can halt Xaar production lines; recent US actions around advanced chip exports and the CHIPS Act (about 52 billion USD for domestic semiconductor support) increase geopolitical supply-security focus. Political risk in supplier countries forces contingency planning, strategic inventory and nearshoring to cut lead-time and exposure. Insurance and political-risk hedges are advisable for large customer programs.
Tariffs up to 25%, subsidies and standards force supplier diversification
Tariff and export controls (US Section 301 up to 25% on ~$250bn Chinese goods) raise costs and risk supply interruptions; diversify suppliers and localize assembly. Subsidy programmes (CHIPS $52bn, IRA ~$369bn, EU RRF €723.8bn) lower capex barriers—pursue co‑funded pilots. Standards divergence (UKCA vs CE) and public procurement (≈12% GDP) favour localization and standards engagement.
| Metric | Value |
|---|---|
| Section 301 tariff | up to 25% on ~$250bn (2024) |
| CHIPS | $52bn |
| IRA | ~$369bn |
| EU RRF | €723.8bn |
| Public procurement | ≈12% GDP (OECD) |
What is included in the product
 Detailed Word Document
Explores how macro-environmental factors uniquely affect Xaar across Political, Economic, Social, Technological, Environmental and Legal dimensions, with data-backed trends and forward-looking insights to identify threats and opportunities. Delivered in clean, report-ready format to support executives, consultants and investors.

 Customizable Excel Spreadsheet
A concise, visually segmented PESTLE summary of Xaar that’s easily editable and shareable for meetings, slides, and cross‑team alignment, helping teams quickly assess external risks and market positioning.
Economic factors

Industrial capex cycles
Customer investment in digital printing tracks macro capex in packaging, labels and ceramics, with the global packaging market ~US$1 trillion in 2024; ROI‑driven upgrades still proceed in downturns when they cut waste and setup time. Xaar should stress TCO benefits—throughput and uptime—to justify spend, and offer flexible financing to smooth capex hesitancy and accelerate purchases.
Currency and cost pressures
FX swings across USD, EUR, GBP and CNY materially compress Xaar’s margins where sales are invoiced in different currencies and key components are sourced internationally.
Rising energy and specialty‑materials inflation increases BOM costs for precision printheads, pressuring gross margins.
Active hedging programs and local price adjustments help stabilize profitability against currency and input shocks.
Value engineering and design‑for‑manufacture reduce unit costs and buffer earnings from input volatility.

Adoption of mass customization
Shift from analog to digital printing accelerates as short runs and variable data demand rise; Smithers reported the global digital printing market at about $22.6bn in 2023 with continued growth into 2024–25. As SKU proliferation increases, digital printheads claim share via faster setup and lower waste, improving per‑job margins versus analog; Xaar should quantify per‑job economics and TCO. Partnerships with OEMs can accelerate penetration into packaging and textile niches.

Supply chain resilience economics
Safety stocks and dual sourcing typically raise working capital 10–30% and procurement costs 2–8% but improve delivery reliability; customers in mission‑critical segments pay 5–20% supply‑consistency premiums. Clear SLAs and spare availability drive recurring service revenue often 10–25% of total sales. Regional hubs can cut lead times 30–50% and logistics costs 15–40%.
- Working capital +10–30%
- Procurement +2–8%
- Customer premium 5–20%
- Service revenue 10–25%
- Lead time −30–50%
- Logistics −15–40%
Aftermarket and service revenues
Installed-base growth drives recurring sales of spares and upgrades for Xaar inkjet systems; larger fleets increase spare-part attachment rates and upgrade uptake. Predictive maintenance can cut downtime by up to 50% (industry studies), strengthening recurring service contracts. Performance guarantees tied to throughput and transparent lifecycle-cost models improve economic value and customer budgeting.
Tariffs up to 25%, subsidies and standards force supplier diversification
Packaging market ~$1T (2024) and digital printing ~$22.6B (2023) drive capex; ROI and TCO messaging plus financing ease purchases. FX swings (USD/EUR/GBP/CNY) and energy/material inflation squeeze gross margins. Safety stocks, dual sourcing raise working capital but win delivery premiums and recurring service revenue. Installed base and predictive maintenance boost spares and uptime.
| Metric | Value |
|---|---|
| Packaging market | $1T (2024) |
| Digital printing | $22.6B (2023) |
| Working capital | +10–30% |
| Service rev | 10–25% |
| Downtime reduction | up to −50% |
Preview Before You Purchase
Xaar PESTLE Analysis
The preview shown here is the exact Xaar PESTLE Analysis you’ll receive after purchase—fully formatted and ready to use. This real screenshot reflects the final document’s content, structure, and layout with no placeholders or surprises. After payment you’ll instantly download the same professionally structured file.

Plan Smarter. Present Sharper. Compete Stronger.
Gain a strategic edge with our PESTLE Analysis of Xaar — three to five concise sections revealing how political shifts, economic trends, and tech advances shape its outlook. Ideal for investors and strategists; buy the full report for the complete, actionable breakdown and ready-to-use insights.
Political factors
Trade policy volatility
Shifts in tariffs and trade agreements—including US Section 301 duties of up to 25% on roughly $250bn of Chinese goods—can raise costs for precision parts and electronics used in Xaar printheads. US‑EU‑China tensions risk constraining access to Asian manufacturing ecosystems key to inkjet supply chains. Proactive dual‑sourcing and localized assembly reduce exposure, and close monitoring of customs classifications for printheads and inks is essential to avoid sudden duty hikes.
Industrial strategy incentives
EU Recovery and Resilience Facility mobilising €723.8bn and US programmes such as CHIPS ($52bn) and the Inflation Reduction Act (~$369bn) channel subsidies toward advanced manufacturing, digitalisation and reshoring, lowering capex barriers for customers adopting digital print. Xaar can co-fund pilots via national productivity programmes and join innovation clusters to speed market access. Grant compliance and reporting increase administrative burden but materially reduce net costs.
Standards and certification alignment
Political bodies back safety and interoperability standards and ISO/TC 130 (graphic technology) directly influences printhead compatibility. Harmonized standards ease cross‑border sales of printheads integrated into OEM equipment across the EU single market. UKCA marking was introduced on 1 January 2021, creating potential divergence from CE requirements. Continued engagement in standards forums protects Xaar’s interests and reduces costly incompatibility testing.
Public procurement and localization
Public procurement and localization drive OEM selection in printing and packaging; OECD data show public procurement represents about 12% of GDP, making localization a strategic priority in bids for government work. Positioning Xaar as an enabler of domestic manufacturing and mapping supply chains transparently supports localization audits and wins in politically sensitive markets.
- Local procurement share: public procurement ≈12% GDP (OECD)
- Supply-chain mapping: aids localization audits
- Domestic enablement: strengthens government bid competitiveness
- Regional networks: signal commitment to local industry
Geopolitical supply security
Sanctions or export restrictions on semiconductors, piezo materials or precision ceramics can halt Xaar production lines; recent US actions around advanced chip exports and the CHIPS Act (about 52 billion USD for domestic semiconductor support) increase geopolitical supply-security focus. Political risk in supplier countries forces contingency planning, strategic inventory and nearshoring to cut lead-time and exposure. Insurance and political-risk hedges are advisable for large customer programs.
Tariffs up to 25%, subsidies and standards force supplier diversification
Tariff and export controls (US Section 301 up to 25% on ~$250bn Chinese goods) raise costs and risk supply interruptions; diversify suppliers and localize assembly. Subsidy programmes (CHIPS $52bn, IRA ~$369bn, EU RRF €723.8bn) lower capex barriers—pursue co‑funded pilots. Standards divergence (UKCA vs CE) and public procurement (≈12% GDP) favour localization and standards engagement.
| Metric | Value |
|---|---|
| Section 301 tariff | up to 25% on ~$250bn (2024) |
| CHIPS | $52bn |
| IRA | ~$369bn |
| EU RRF | €723.8bn |
| Public procurement | ≈12% GDP (OECD) |
What is included in the product
Detailed Word Document
Explores how macro-environmental factors uniquely affect Xaar across Political, Economic, Social, Technological, Environmental and Legal dimensions, with data-backed trends and forward-looking insights to identify threats and opportunities. Delivered in clean, report-ready format to support executives, consultants and investors.
Customizable Excel Spreadsheet
A concise, visually segmented PESTLE summary of Xaar that’s easily editable and shareable for meetings, slides, and cross‑team alignment, helping teams quickly assess external risks and market positioning.
Economic factors
Industrial capex cycles
Customer investment in digital printing tracks macro capex in packaging, labels and ceramics, with the global packaging market ~US$1 trillion in 2024; ROI‑driven upgrades still proceed in downturns when they cut waste and setup time. Xaar should stress TCO benefits—throughput and uptime—to justify spend, and offer flexible financing to smooth capex hesitancy and accelerate purchases.
Currency and cost pressures
FX swings across USD, EUR, GBP and CNY materially compress Xaar’s margins where sales are invoiced in different currencies and key components are sourced internationally.
Rising energy and specialty‑materials inflation increases BOM costs for precision printheads, pressuring gross margins.
Active hedging programs and local price adjustments help stabilize profitability against currency and input shocks.
Value engineering and design‑for‑manufacture reduce unit costs and buffer earnings from input volatility.
Adoption of mass customization
Shift from analog to digital printing accelerates as short runs and variable data demand rise; Smithers reported the global digital printing market at about $22.6bn in 2023 with continued growth into 2024–25. As SKU proliferation increases, digital printheads claim share via faster setup and lower waste, improving per‑job margins versus analog; Xaar should quantify per‑job economics and TCO. Partnerships with OEMs can accelerate penetration into packaging and textile niches.
Supply chain resilience economics
Safety stocks and dual sourcing typically raise working capital 10–30% and procurement costs 2–8% but improve delivery reliability; customers in mission‑critical segments pay 5–20% supply‑consistency premiums. Clear SLAs and spare availability drive recurring service revenue often 10–25% of total sales. Regional hubs can cut lead times 30–50% and logistics costs 15–40%.
- Working capital +10–30%
- Procurement +2–8%
- Customer premium 5–20%
- Service revenue 10–25%
- Lead time −30–50%
- Logistics −15–40%
Aftermarket and service revenues
Installed-base growth drives recurring sales of spares and upgrades for Xaar inkjet systems; larger fleets increase spare-part attachment rates and upgrade uptake. Predictive maintenance can cut downtime by up to 50% (industry studies), strengthening recurring service contracts. Performance guarantees tied to throughput and transparent lifecycle-cost models improve economic value and customer budgeting.
Tariffs up to 25%, subsidies and standards force supplier diversification
Packaging market ~$1T (2024) and digital printing ~$22.6B (2023) drive capex; ROI and TCO messaging plus financing ease purchases. FX swings (USD/EUR/GBP/CNY) and energy/material inflation squeeze gross margins. Safety stocks, dual sourcing raise working capital but win delivery premiums and recurring service revenue. Installed base and predictive maintenance boost spares and uptime.
| Metric | Value |
|---|---|
| Packaging market | $1T (2024) |
| Digital printing | $22.6B (2023) |
| Working capital | +10–30% |
| Service rev | 10–25% |
| Downtime reduction | up to −50% |
Preview Before You Purchase
Xaar PESTLE Analysis
The preview shown here is the exact Xaar PESTLE Analysis you’ll receive after purchase—fully formatted and ready to use. This real screenshot reflects the final document’s content, structure, and layout with no placeholders or surprises. After payment you’ll instantly download the same professionally structured file.
Original: $10.00
-65%$10.00
$3.50Description
Plan Smarter. Present Sharper. Compete Stronger.
Gain a strategic edge with our PESTLE Analysis of Xaar — three to five concise sections revealing how political shifts, economic trends, and tech advances shape its outlook. Ideal for investors and strategists; buy the full report for the complete, actionable breakdown and ready-to-use insights.
Political factors
Trade policy volatility
Shifts in tariffs and trade agreements—including US Section 301 duties of up to 25% on roughly $250bn of Chinese goods—can raise costs for precision parts and electronics used in Xaar printheads. US‑EU‑China tensions risk constraining access to Asian manufacturing ecosystems key to inkjet supply chains. Proactive dual‑sourcing and localized assembly reduce exposure, and close monitoring of customs classifications for printheads and inks is essential to avoid sudden duty hikes.
Industrial strategy incentives
EU Recovery and Resilience Facility mobilising €723.8bn and US programmes such as CHIPS ($52bn) and the Inflation Reduction Act (~$369bn) channel subsidies toward advanced manufacturing, digitalisation and reshoring, lowering capex barriers for customers adopting digital print. Xaar can co-fund pilots via national productivity programmes and join innovation clusters to speed market access. Grant compliance and reporting increase administrative burden but materially reduce net costs.
Standards and certification alignment
Political bodies back safety and interoperability standards and ISO/TC 130 (graphic technology) directly influences printhead compatibility. Harmonized standards ease cross‑border sales of printheads integrated into OEM equipment across the EU single market. UKCA marking was introduced on 1 January 2021, creating potential divergence from CE requirements. Continued engagement in standards forums protects Xaar’s interests and reduces costly incompatibility testing.
Public procurement and localization
Public procurement and localization drive OEM selection in printing and packaging; OECD data show public procurement represents about 12% of GDP, making localization a strategic priority in bids for government work. Positioning Xaar as an enabler of domestic manufacturing and mapping supply chains transparently supports localization audits and wins in politically sensitive markets.
- Local procurement share: public procurement ≈12% GDP (OECD)
- Supply-chain mapping: aids localization audits
- Domestic enablement: strengthens government bid competitiveness
- Regional networks: signal commitment to local industry
Geopolitical supply security
Sanctions or export restrictions on semiconductors, piezo materials or precision ceramics can halt Xaar production lines; recent US actions around advanced chip exports and the CHIPS Act (about 52 billion USD for domestic semiconductor support) increase geopolitical supply-security focus. Political risk in supplier countries forces contingency planning, strategic inventory and nearshoring to cut lead-time and exposure. Insurance and political-risk hedges are advisable for large customer programs.
Tariffs up to 25%, subsidies and standards force supplier diversification
Tariff and export controls (US Section 301 up to 25% on ~$250bn Chinese goods) raise costs and risk supply interruptions; diversify suppliers and localize assembly. Subsidy programmes (CHIPS $52bn, IRA ~$369bn, EU RRF €723.8bn) lower capex barriers—pursue co‑funded pilots. Standards divergence (UKCA vs CE) and public procurement (≈12% GDP) favour localization and standards engagement.
| Metric | Value |
|---|---|
| Section 301 tariff | up to 25% on ~$250bn (2024) |
| CHIPS | $52bn |
| IRA | ~$369bn |
| EU RRF | €723.8bn |
| Public procurement | ≈12% GDP (OECD) |
What is included in the product
Detailed Word Document
Explores how macro-environmental factors uniquely affect Xaar across Political, Economic, Social, Technological, Environmental and Legal dimensions, with data-backed trends and forward-looking insights to identify threats and opportunities. Delivered in clean, report-ready format to support executives, consultants and investors.
Customizable Excel Spreadsheet
A concise, visually segmented PESTLE summary of Xaar that’s easily editable and shareable for meetings, slides, and cross‑team alignment, helping teams quickly assess external risks and market positioning.
Economic factors
Industrial capex cycles
Customer investment in digital printing tracks macro capex in packaging, labels and ceramics, with the global packaging market ~US$1 trillion in 2024; ROI‑driven upgrades still proceed in downturns when they cut waste and setup time. Xaar should stress TCO benefits—throughput and uptime—to justify spend, and offer flexible financing to smooth capex hesitancy and accelerate purchases.
Currency and cost pressures
FX swings across USD, EUR, GBP and CNY materially compress Xaar’s margins where sales are invoiced in different currencies and key components are sourced internationally.
Rising energy and specialty‑materials inflation increases BOM costs for precision printheads, pressuring gross margins.
Active hedging programs and local price adjustments help stabilize profitability against currency and input shocks.
Value engineering and design‑for‑manufacture reduce unit costs and buffer earnings from input volatility.
Adoption of mass customization
Shift from analog to digital printing accelerates as short runs and variable data demand rise; Smithers reported the global digital printing market at about $22.6bn in 2023 with continued growth into 2024–25. As SKU proliferation increases, digital printheads claim share via faster setup and lower waste, improving per‑job margins versus analog; Xaar should quantify per‑job economics and TCO. Partnerships with OEMs can accelerate penetration into packaging and textile niches.
Supply chain resilience economics
Safety stocks and dual sourcing typically raise working capital 10–30% and procurement costs 2–8% but improve delivery reliability; customers in mission‑critical segments pay 5–20% supply‑consistency premiums. Clear SLAs and spare availability drive recurring service revenue often 10–25% of total sales. Regional hubs can cut lead times 30–50% and logistics costs 15–40%.
- Working capital +10–30%
- Procurement +2–8%
- Customer premium 5–20%
- Service revenue 10–25%
- Lead time −30–50%
- Logistics −15–40%
Aftermarket and service revenues
Installed-base growth drives recurring sales of spares and upgrades for Xaar inkjet systems; larger fleets increase spare-part attachment rates and upgrade uptake. Predictive maintenance can cut downtime by up to 50% (industry studies), strengthening recurring service contracts. Performance guarantees tied to throughput and transparent lifecycle-cost models improve economic value and customer budgeting.
Tariffs up to 25%, subsidies and standards force supplier diversification
Packaging market ~$1T (2024) and digital printing ~$22.6B (2023) drive capex; ROI and TCO messaging plus financing ease purchases. FX swings (USD/EUR/GBP/CNY) and energy/material inflation squeeze gross margins. Safety stocks, dual sourcing raise working capital but win delivery premiums and recurring service revenue. Installed base and predictive maintenance boost spares and uptime.
| Metric | Value |
|---|---|
| Packaging market | $1T (2024) |
| Digital printing | $22.6B (2023) |
| Working capital | +10–30% |
| Service rev | 10–25% |
| Downtime reduction | up to −50% |
Preview Before You Purchase
Xaar PESTLE Analysis
The preview shown here is the exact Xaar PESTLE Analysis you’ll receive after purchase—fully formatted and ready to use. This real screenshot reflects the final document’s content, structure, and layout with no placeholders or surprises. After payment you’ll instantly download the same professionally structured file.











