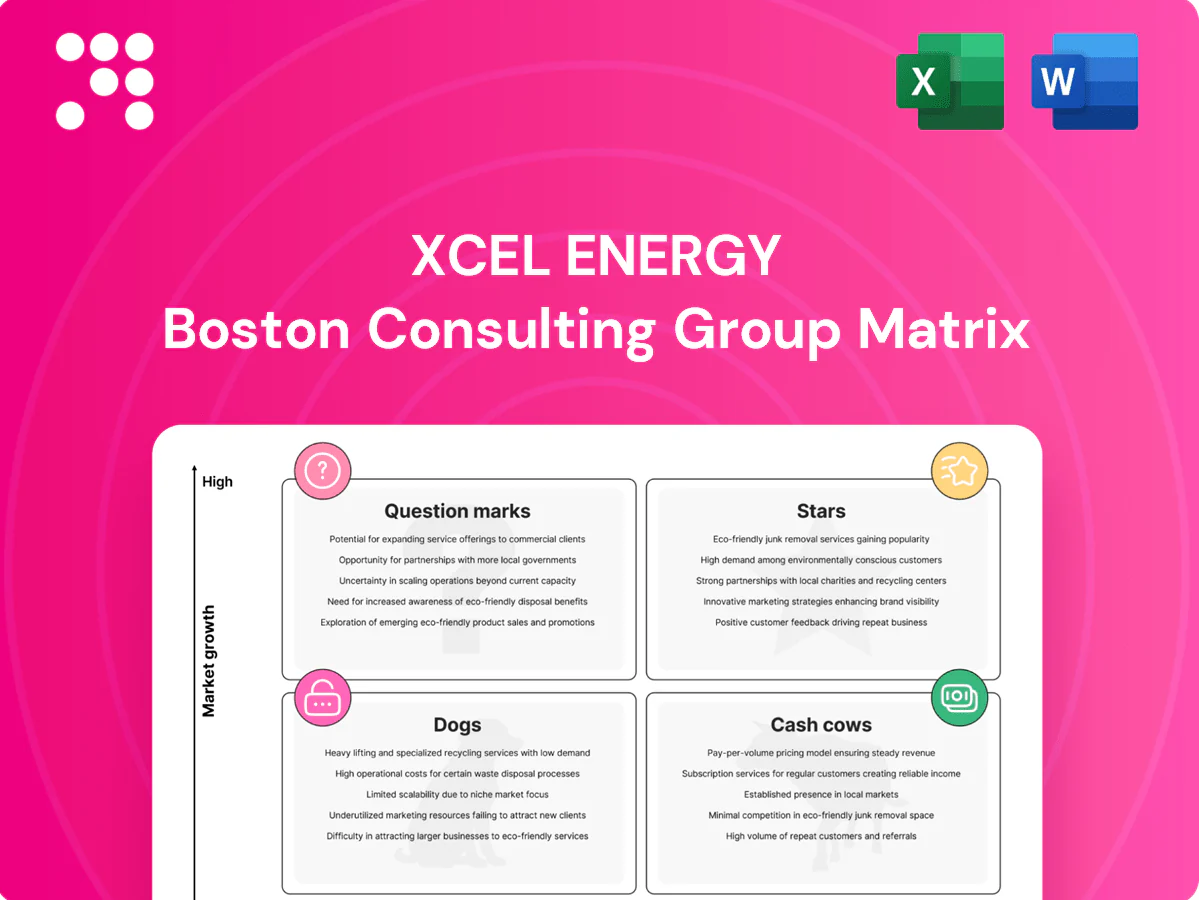
Xcel Energy Boston Consulting Group Matrix

See the Bigger Picture
Quick snapshot: Xcel Energy’s BCG Matrix shows which business lines are Stars, which are Cash Cows, and which might be draining resources—hint: renewables are shifting the map. This preview teases the strategic moves; the full BCG Matrix gives quadrant-by-quadrant placement, data-backed recommendations, and a clear capital-allocation roadmap. Buy the full report for a ready-to-use Word analysis + high-level Excel summary and start making smarter investment decisions today.
Stars

Utility-scale wind and solar buildout
Xcel, serving about 3.8 million electricity customers in its territories, holds dominant share and is rapidly scaling utility-scale wind and solar where demand and policy support growth. The company targets an 80% carbon reduction by 2030 and 100% carbon-free by 2050, driving high capex, high visibility, high-growth projects. These assets soak up cash now but set the decarbonization pace; continued investment is required to defend market share as the renewables market expands.
Transmission expansion for renewables
Regional transmission is booming to move wind and solar to load, and Xcel is a lead builder with regulated returns as it pursues an 80% carbon-free grid by 2030. This growth-heavy program is capital hungry but essential to unlock new generation and interconnections. Scale now, earn later as projects roll into rate base and deliver long-term, regulated cash flows. This is the backbone play for decarbonization and growth.

Advanced grid modernization (AMI, FLISR, DER orchestration)
Advanced grid modernization (AMI, FLISR, DER orchestration) scales as electrification accelerates; Xcel serves ~3.9 million electric customers (2024), giving incumbency and rich meter/data assets that create a defensible edge. Upfront capital outlays are large, but automation and DER control drive reliability improvements—FLISR can cut outage minutes by up to 40%—and recurring opex savings, positioning momentum to convert into future cash-cow economics.

Renewable PPAs and build-transfer programs
Renewable PPAs and build-transfer programs sit in Xcel Energy’s star quadrant as city and corporate demand for clean energy accelerates; Xcel serves about 3.8 million electric customers and leverages a multi‑GW renewables pipeline to lock long‑term contracts at scale, turning upfront cash outflows into sustained market leadership.
Demand response and flexible load programs
Demand response and flexible load programs are Stars as peak management becomes a key growth lever amid rising electrification; Xcel Energy’s ~3.8 million electric customer footprint and supportive regulators position it to scale these programs. Upfront investment in grid software, smart thermostats and customer outreach in 2024 is required; payoff includes avoided capacity builds and higher customer retention.
- Peak reduction lever: supports EV/load growth
- Customer reach: ~3.8M electric customers
- Investment: grid tech + outreach now
- Payoff: avoided capacity costs, stickier base
3.9M customers, rapid wind/solar build, 80% by 2030 — capex now, regulated returns later
Xcel’s Stars: 3.9M electric customers (2024), rapid utility‑scale wind/solar build, 80% carbon reduction target by 2030 and 100% by 2050; high capex now, long‑term regulated returns later. Grid modernization (AMI/FLISR/DER) and regional transmission unlock growth; FLISR can cut outage minutes up to 40%. Renewable PPAs/multi‑GW pipeline convert capex into contracted cash flows.
| Metric | Value |
|---|---|
| Customers (2024) | 3.9M |
| 2030 target | 80% carbon reduction |
| FLISR benefit | -40% outage mins |
What is included in the product
 Detailed Word Document
Strategic BCG review of Xcel Energy’s units—identifies Stars, Cash Cows, Question Marks, Dogs and investment recommendations.

 Customizable Excel Spreadsheet
One-page BCG matrix for Xcel Energy — clarifies portfolio priorities, eases C-suite decisions and exports to PowerPoint.
Cash Cows

Regulated electric distribution in mature metros
Regulated electric distribution in Xcel’s mature metros commands high market share with roughly 3.8 million electric customers across eight states, delivering steady usage and modest demand growth. A predictable rate base and allowed returns near 9–10% generate surplus cash, supporting a dividend and capex. Low promotional need keeps focus on reliability and outage reduction. This cash cow funds new growth while management tightens operational efficiency and cost control.
Natural gas distribution to established customers
Natural gas distribution to Xcel Energys established ~2.0 million gas customers is a stable, slow-growth cash cow that benefits from scale-driven margins and regulated returns; the utility segment delivered steady operating cash flow supporting corporate needs in 2024. Incremental capital is focused on efficiency and safety upgrades rather than growth capex. Cash flow helps sustain the companys dividend (around $2.02 annualized in 2024). Manage carefully as long-run residential and industrial gas demand may plateau.

Nuclear generation (existing fleet)
Xcel’s existing nuclear fleet (~1.7 GW) provides low-carbon baseload with >90% availability and a predictable cost base. Growth is minimal, but planned refuel cycles sustain steady cash generation supporting roughly stable earnings. Regulatory clarity from multi-state PUC decisions improves visibility. Proceeds are deployed to fund renewable and storage transition assets.

Long-term renewable assets already in rate base
Older wind and solar assets already in Xcel Energy’s rate base deliver steady, settled-cost cash flows with low management intensity and limited upside; minimal marketing needed, focus on operations and optimization; harvest cash to fund new interconnections and battery storage while serving ~3.8 million electricity customers (2024).
- Cash flow: steady, predictable
- Management: low intensity
- Upside: limited
- Use of proceeds: interconnections & storage
Transmission assets in service
Transmission assets in service are Xcel Energy cash cows: projects complete and operating deliver regulated, low-volatility returns with limited incremental spend beyond routine maintenance; high utilization supports dependable earnings in 2024, acting as a quiet engine room for the P&L.
- Regulated, steady cash flows
- Minimal capex beyond maintenance
- High utilization, predictable uptime
- Supports earnings stability in 2024
Regulated power & gas networks + 1.7GW nuclear: stable cash, funds $2.02 div
Xcel’s regulated electric distribution (3.8M customers) and gas distribution (~2.0M) plus transmission and legacy wind/solar and ~1.7GW nuclear are stable cash cows delivering predictable cash flow in 2024 (allowed returns ~9–10%, nuclear >90% availability), funding ~ $2.02 annualized dividend and renewables/storage transition while requiring low promotional spend.
| Asset | Metric (2024) | Role |
|---|---|---|
| Electric distribution | 3.8M customers; ~9–10% allowed ROE | Primary cash generator |
| Gas distribution | ~2.0M customers | Stable cash flow |
| Nuclear | ~1.7GW; >90% availability | Baseload cash |
| Wind/solar & transmission | Rate‑based, low O&M | Harvest cash |
Preview = Final Product
Xcel Energy BCG Matrix
The file you’re previewing on this page is the exact BCG Matrix report you’ll receive after purchase. No watermarks, no demo placeholders—just a fully formatted, ready-to-use document. It’s crafted by strategy pros for clarity and immediate use. After buying you’ll get the full editable file instantly, perfect for presenting, printing, or plugging into your planning. No surprises—what you see is what you get.

See the Bigger Picture
Quick snapshot: Xcel Energy’s BCG Matrix shows which business lines are Stars, which are Cash Cows, and which might be draining resources—hint: renewables are shifting the map. This preview teases the strategic moves; the full BCG Matrix gives quadrant-by-quadrant placement, data-backed recommendations, and a clear capital-allocation roadmap. Buy the full report for a ready-to-use Word analysis + high-level Excel summary and start making smarter investment decisions today.
Stars
Utility-scale wind and solar buildout
Xcel, serving about 3.8 million electricity customers in its territories, holds dominant share and is rapidly scaling utility-scale wind and solar where demand and policy support growth. The company targets an 80% carbon reduction by 2030 and 100% carbon-free by 2050, driving high capex, high visibility, high-growth projects. These assets soak up cash now but set the decarbonization pace; continued investment is required to defend market share as the renewables market expands.
Transmission expansion for renewables
Regional transmission is booming to move wind and solar to load, and Xcel is a lead builder with regulated returns as it pursues an 80% carbon-free grid by 2030. This growth-heavy program is capital hungry but essential to unlock new generation and interconnections. Scale now, earn later as projects roll into rate base and deliver long-term, regulated cash flows. This is the backbone play for decarbonization and growth.
Advanced grid modernization (AMI, FLISR, DER orchestration)
Advanced grid modernization (AMI, FLISR, DER orchestration) scales as electrification accelerates; Xcel serves ~3.9 million electric customers (2024), giving incumbency and rich meter/data assets that create a defensible edge. Upfront capital outlays are large, but automation and DER control drive reliability improvements—FLISR can cut outage minutes by up to 40%—and recurring opex savings, positioning momentum to convert into future cash-cow economics.
Renewable PPAs and build-transfer programs
Renewable PPAs and build-transfer programs sit in Xcel Energy’s star quadrant as city and corporate demand for clean energy accelerates; Xcel serves about 3.8 million electric customers and leverages a multi‑GW renewables pipeline to lock long‑term contracts at scale, turning upfront cash outflows into sustained market leadership.
Demand response and flexible load programs
Demand response and flexible load programs are Stars as peak management becomes a key growth lever amid rising electrification; Xcel Energy’s ~3.8 million electric customer footprint and supportive regulators position it to scale these programs. Upfront investment in grid software, smart thermostats and customer outreach in 2024 is required; payoff includes avoided capacity builds and higher customer retention.
- Peak reduction lever: supports EV/load growth
- Customer reach: ~3.8M electric customers
- Investment: grid tech + outreach now
- Payoff: avoided capacity costs, stickier base
3.9M customers, rapid wind/solar build, 80% by 2030 — capex now, regulated returns later
Xcel’s Stars: 3.9M electric customers (2024), rapid utility‑scale wind/solar build, 80% carbon reduction target by 2030 and 100% by 2050; high capex now, long‑term regulated returns later. Grid modernization (AMI/FLISR/DER) and regional transmission unlock growth; FLISR can cut outage minutes up to 40%. Renewable PPAs/multi‑GW pipeline convert capex into contracted cash flows.
| Metric | Value |
|---|---|
| Customers (2024) | 3.9M |
| 2030 target | 80% carbon reduction |
| FLISR benefit | -40% outage mins |
What is included in the product
Detailed Word Document
Strategic BCG review of Xcel Energy’s units—identifies Stars, Cash Cows, Question Marks, Dogs and investment recommendations.
Customizable Excel Spreadsheet
One-page BCG matrix for Xcel Energy — clarifies portfolio priorities, eases C-suite decisions and exports to PowerPoint.
Cash Cows
Regulated electric distribution in mature metros
Regulated electric distribution in Xcel’s mature metros commands high market share with roughly 3.8 million electric customers across eight states, delivering steady usage and modest demand growth. A predictable rate base and allowed returns near 9–10% generate surplus cash, supporting a dividend and capex. Low promotional need keeps focus on reliability and outage reduction. This cash cow funds new growth while management tightens operational efficiency and cost control.
Natural gas distribution to established customers
Natural gas distribution to Xcel Energys established ~2.0 million gas customers is a stable, slow-growth cash cow that benefits from scale-driven margins and regulated returns; the utility segment delivered steady operating cash flow supporting corporate needs in 2024. Incremental capital is focused on efficiency and safety upgrades rather than growth capex. Cash flow helps sustain the companys dividend (around $2.02 annualized in 2024). Manage carefully as long-run residential and industrial gas demand may plateau.
Nuclear generation (existing fleet)
Xcel’s existing nuclear fleet (~1.7 GW) provides low-carbon baseload with >90% availability and a predictable cost base. Growth is minimal, but planned refuel cycles sustain steady cash generation supporting roughly stable earnings. Regulatory clarity from multi-state PUC decisions improves visibility. Proceeds are deployed to fund renewable and storage transition assets.
Long-term renewable assets already in rate base
Older wind and solar assets already in Xcel Energy’s rate base deliver steady, settled-cost cash flows with low management intensity and limited upside; minimal marketing needed, focus on operations and optimization; harvest cash to fund new interconnections and battery storage while serving ~3.8 million electricity customers (2024).
- Cash flow: steady, predictable
- Management: low intensity
- Upside: limited
- Use of proceeds: interconnections & storage
Transmission assets in service
Transmission assets in service are Xcel Energy cash cows: projects complete and operating deliver regulated, low-volatility returns with limited incremental spend beyond routine maintenance; high utilization supports dependable earnings in 2024, acting as a quiet engine room for the P&L.
- Regulated, steady cash flows
- Minimal capex beyond maintenance
- High utilization, predictable uptime
- Supports earnings stability in 2024
Regulated power & gas networks + 1.7GW nuclear: stable cash, funds $2.02 div
Xcel’s regulated electric distribution (3.8M customers) and gas distribution (~2.0M) plus transmission and legacy wind/solar and ~1.7GW nuclear are stable cash cows delivering predictable cash flow in 2024 (allowed returns ~9–10%, nuclear >90% availability), funding ~ $2.02 annualized dividend and renewables/storage transition while requiring low promotional spend.
| Asset | Metric (2024) | Role |
|---|---|---|
| Electric distribution | 3.8M customers; ~9–10% allowed ROE | Primary cash generator |
| Gas distribution | ~2.0M customers | Stable cash flow |
| Nuclear | ~1.7GW; >90% availability | Baseload cash |
| Wind/solar & transmission | Rate‑based, low O&M | Harvest cash |
Preview = Final Product
Xcel Energy BCG Matrix
The file you’re previewing on this page is the exact BCG Matrix report you’ll receive after purchase. No watermarks, no demo placeholders—just a fully formatted, ready-to-use document. It’s crafted by strategy pros for clarity and immediate use. After buying you’ll get the full editable file instantly, perfect for presenting, printing, or plugging into your planning. No surprises—what you see is what you get.
Original: $10.00
-65%$10.00
$3.50Description
See the Bigger Picture
Quick snapshot: Xcel Energy’s BCG Matrix shows which business lines are Stars, which are Cash Cows, and which might be draining resources—hint: renewables are shifting the map. This preview teases the strategic moves; the full BCG Matrix gives quadrant-by-quadrant placement, data-backed recommendations, and a clear capital-allocation roadmap. Buy the full report for a ready-to-use Word analysis + high-level Excel summary and start making smarter investment decisions today.
Stars
Utility-scale wind and solar buildout
Xcel, serving about 3.8 million electricity customers in its territories, holds dominant share and is rapidly scaling utility-scale wind and solar where demand and policy support growth. The company targets an 80% carbon reduction by 2030 and 100% carbon-free by 2050, driving high capex, high visibility, high-growth projects. These assets soak up cash now but set the decarbonization pace; continued investment is required to defend market share as the renewables market expands.
Transmission expansion for renewables
Regional transmission is booming to move wind and solar to load, and Xcel is a lead builder with regulated returns as it pursues an 80% carbon-free grid by 2030. This growth-heavy program is capital hungry but essential to unlock new generation and interconnections. Scale now, earn later as projects roll into rate base and deliver long-term, regulated cash flows. This is the backbone play for decarbonization and growth.
Advanced grid modernization (AMI, FLISR, DER orchestration)
Advanced grid modernization (AMI, FLISR, DER orchestration) scales as electrification accelerates; Xcel serves ~3.9 million electric customers (2024), giving incumbency and rich meter/data assets that create a defensible edge. Upfront capital outlays are large, but automation and DER control drive reliability improvements—FLISR can cut outage minutes by up to 40%—and recurring opex savings, positioning momentum to convert into future cash-cow economics.
Renewable PPAs and build-transfer programs
Renewable PPAs and build-transfer programs sit in Xcel Energy’s star quadrant as city and corporate demand for clean energy accelerates; Xcel serves about 3.8 million electric customers and leverages a multi‑GW renewables pipeline to lock long‑term contracts at scale, turning upfront cash outflows into sustained market leadership.
Demand response and flexible load programs
Demand response and flexible load programs are Stars as peak management becomes a key growth lever amid rising electrification; Xcel Energy’s ~3.8 million electric customer footprint and supportive regulators position it to scale these programs. Upfront investment in grid software, smart thermostats and customer outreach in 2024 is required; payoff includes avoided capacity builds and higher customer retention.
- Peak reduction lever: supports EV/load growth
- Customer reach: ~3.8M electric customers
- Investment: grid tech + outreach now
- Payoff: avoided capacity costs, stickier base
3.9M customers, rapid wind/solar build, 80% by 2030 — capex now, regulated returns later
Xcel’s Stars: 3.9M electric customers (2024), rapid utility‑scale wind/solar build, 80% carbon reduction target by 2030 and 100% by 2050; high capex now, long‑term regulated returns later. Grid modernization (AMI/FLISR/DER) and regional transmission unlock growth; FLISR can cut outage minutes up to 40%. Renewable PPAs/multi‑GW pipeline convert capex into contracted cash flows.
| Metric | Value |
|---|---|
| Customers (2024) | 3.9M |
| 2030 target | 80% carbon reduction |
| FLISR benefit | -40% outage mins |
What is included in the product
Detailed Word Document
Strategic BCG review of Xcel Energy’s units—identifies Stars, Cash Cows, Question Marks, Dogs and investment recommendations.
Customizable Excel Spreadsheet
One-page BCG matrix for Xcel Energy — clarifies portfolio priorities, eases C-suite decisions and exports to PowerPoint.
Cash Cows
Regulated electric distribution in mature metros
Regulated electric distribution in Xcel’s mature metros commands high market share with roughly 3.8 million electric customers across eight states, delivering steady usage and modest demand growth. A predictable rate base and allowed returns near 9–10% generate surplus cash, supporting a dividend and capex. Low promotional need keeps focus on reliability and outage reduction. This cash cow funds new growth while management tightens operational efficiency and cost control.
Natural gas distribution to established customers
Natural gas distribution to Xcel Energys established ~2.0 million gas customers is a stable, slow-growth cash cow that benefits from scale-driven margins and regulated returns; the utility segment delivered steady operating cash flow supporting corporate needs in 2024. Incremental capital is focused on efficiency and safety upgrades rather than growth capex. Cash flow helps sustain the companys dividend (around $2.02 annualized in 2024). Manage carefully as long-run residential and industrial gas demand may plateau.
Nuclear generation (existing fleet)
Xcel’s existing nuclear fleet (~1.7 GW) provides low-carbon baseload with >90% availability and a predictable cost base. Growth is minimal, but planned refuel cycles sustain steady cash generation supporting roughly stable earnings. Regulatory clarity from multi-state PUC decisions improves visibility. Proceeds are deployed to fund renewable and storage transition assets.
Long-term renewable assets already in rate base
Older wind and solar assets already in Xcel Energy’s rate base deliver steady, settled-cost cash flows with low management intensity and limited upside; minimal marketing needed, focus on operations and optimization; harvest cash to fund new interconnections and battery storage while serving ~3.8 million electricity customers (2024).
- Cash flow: steady, predictable
- Management: low intensity
- Upside: limited
- Use of proceeds: interconnections & storage
Transmission assets in service
Transmission assets in service are Xcel Energy cash cows: projects complete and operating deliver regulated, low-volatility returns with limited incremental spend beyond routine maintenance; high utilization supports dependable earnings in 2024, acting as a quiet engine room for the P&L.
- Regulated, steady cash flows
- Minimal capex beyond maintenance
- High utilization, predictable uptime
- Supports earnings stability in 2024
Regulated power & gas networks + 1.7GW nuclear: stable cash, funds $2.02 div
Xcel’s regulated electric distribution (3.8M customers) and gas distribution (~2.0M) plus transmission and legacy wind/solar and ~1.7GW nuclear are stable cash cows delivering predictable cash flow in 2024 (allowed returns ~9–10%, nuclear >90% availability), funding ~ $2.02 annualized dividend and renewables/storage transition while requiring low promotional spend.
| Asset | Metric (2024) | Role |
|---|---|---|
| Electric distribution | 3.8M customers; ~9–10% allowed ROE | Primary cash generator |
| Gas distribution | ~2.0M customers | Stable cash flow |
| Nuclear | ~1.7GW; >90% availability | Baseload cash |
| Wind/solar & transmission | Rate‑based, low O&M | Harvest cash |
Preview = Final Product
Xcel Energy BCG Matrix
The file you’re previewing on this page is the exact BCG Matrix report you’ll receive after purchase. No watermarks, no demo placeholders—just a fully formatted, ready-to-use document. It’s crafted by strategy pros for clarity and immediate use. After buying you’ll get the full editable file instantly, perfect for presenting, printing, or plugging into your planning. No surprises—what you see is what you get.











