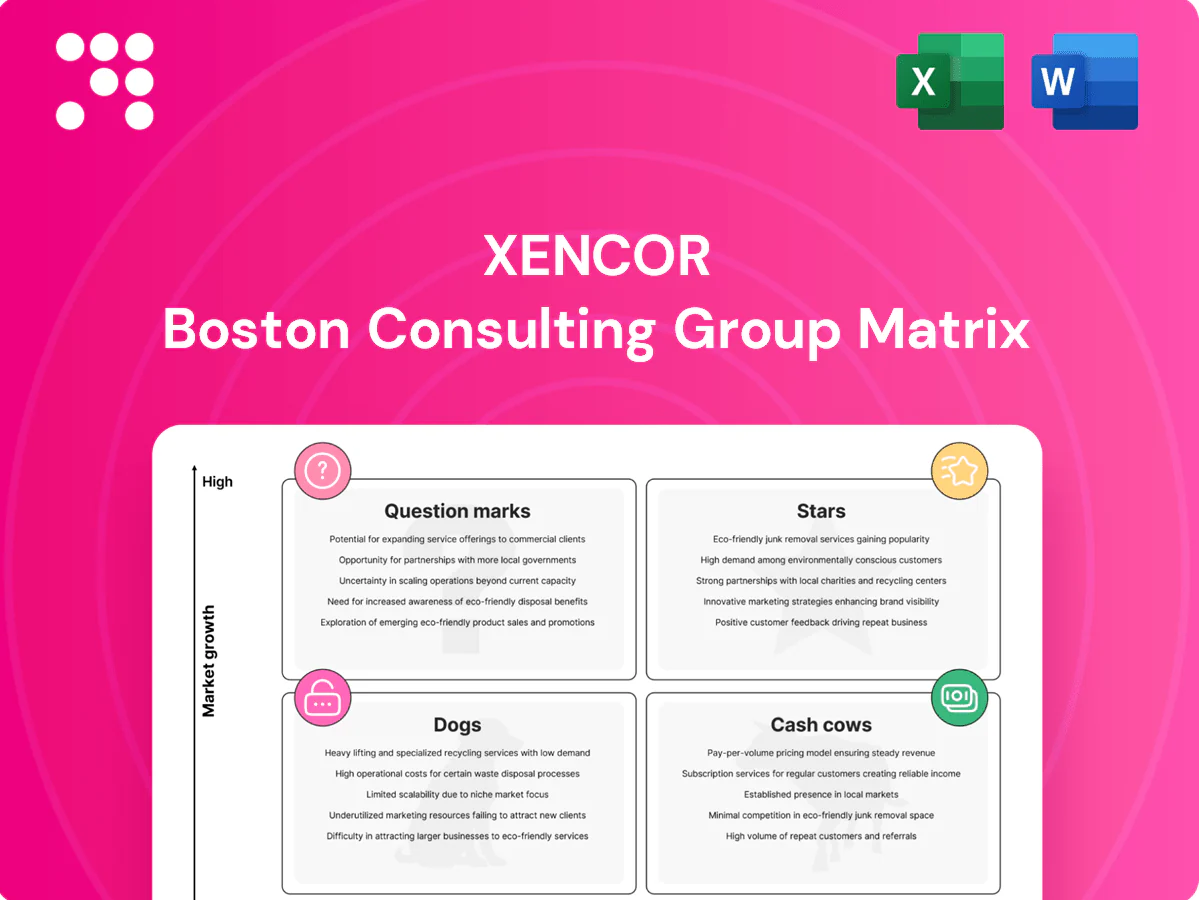
Xencor Boston Consulting Group Matrix

See the Bigger Picture
Want clarity on which products are driving growth and which are bleeding cash? This Xencor BCG Matrix preview teases the quadrant placements—buy the full report for a complete breakdown, data-backed recommendations, and quadrant maps that you can act on now. Purchase the full version to get a ready-to-use Word report and an Excel summary that make strategic decisions faster and presentations sharper.
Stars

XmAb technology platform adoption
XmAb platform is broadly validated, powering a growing pipeline and pulling in new use-cases as the global biologics market, valued at about $410 billion in 2024, expands. High scientific win rate positions Xencor as a leader in an area growing at roughly 8% CAGR, supporting premium deal flow. Continued steady investment in tooling, data, and BD is required to maintain edge and convert platform strength into predictable annuities.
Royalty-bearing partnered therapies scaling
Multiple partnered programs are launching or expanding labels, driving growing royalty lines; Xencor now supports over 20 partnered XmAb programs in clinic and beyond, giving high share in a fast-growing niche thanks to baked-in XmAb advantages.
Promotion remains largely partner-led, but Xencor must provide technical and lifecycle input to secure royalty upticks and label expansions.
As adoption widens, these royalty-bearing programs have a clear path to flip into Cash Cow territory.

Oncology bispecifics with clinical momentum
Oncology bispecifics are accelerating and Xencor sits squarely in the thick of the wave. Differentiated formats and flexible dosing are winning clinician mindshare, with >200 bispecifics in clinical development as of 2024. Trials aren’t cheap and cash burn is real, so sustaining R&D spend now locks in category leadership tomorrow.

High-credibility pharma alliances
High-credibility pharma alliances give Xencor distribution, regulatory muscle and global reach—effectively adding market share by proxy in a global pharma market estimated at $1.6 trillion in 2024 where the top 10 firms account for roughly 30% of sales; as positive readouts accumulate the alliance network expands, creating a virtuous loop.
- Co-investment required: joint dev and platform support
- Faster flywheel: clinical wins → new partnerships
- Proxy market share: leverage top-tier partner channels
Fc engineering know-how (effector, half-life, tuning)
Fc engineering know-how (effector, half-life, tuning) are behind-the-scenes superpowers that boost efficacy, safety and dosing convenience; with the 2024 biologics market topping $300B, demand for safer, longer‑lasting biologics is rising. Xencor’s leadership in Fc tuning is a strategic Star but requires continual variant development and fresh clinical/PK data to maintain premium positioning. Stay cutting-edge and the asset compounds.
- 2024 market size: >$300B
- Clinical impact: Fc half-life extension can cut dosing frequency up to ~50%
- Strategy: continual variant/data refresh to retain Star status
Validated platform with >20 partners, >200 bispecific tailwind, $410B TAM
XmAb platform validated with >20 partnered programs and strong deal flow as the 2024 biologics market reaches ~$410B; oncology bispecific tailwind (>200 bispecifics in clinic in 2024) drives Star status but demands sustained R&D spend. Fc engineering delivers ~50% dosing-frequency reduction potential; alliances provide proxy reach into a $1.6T pharma market (2024), accelerating royalty conversion to Cash Cows.
| Metric | 2024 | Implication |
|---|---|---|
| Partnered XmAb programs | >20 | Growing royalty base |
| Biologics market | $410B | Large TAM |
| Bispecifics in clinic | >200 | Oncology growth driver |
| Fc half-life impact | ~50% dosing cut | Commercial advantage |
What is included in the product
 Detailed Word Document
Comprehensive BCG review of Xencor products with strategic moves per quadrant—invest, maintain, or divest, plus trend context.

 Customizable Excel Spreadsheet
One-page Xencor BCG Matrix highlighting priorities to cut confusion and speed decisions
Cash Cows

Existing royalties from approved partner drugs
Existing royalties from approved partner drugs provided high-margin cash in 2024, flowing in without proportional increases in opex and preserving operating leverage. Growth typically moderates after launch curves but remains reliable, supporting steady free cash flow. Proceeds are allocated to fund higher-risk pipeline shots while maintaining day-to-day operations. Ongoing partner engagement is essential to preserve the royalty base.
Platform licensing and milestones
Platform licensing and milestones deliver predictable upfronts and near-term payments once deals are in motion. Low incremental cost to deliver versus cash received makes these agreements efficient; Xencor held over $1 billion in cash and investments as of Dec 31, 2023. Not a hyper-growth engine but steady—optimize deal mix and timing to smooth cash flows and fund R&D.

Follow-on indications and line extensions
Label expansions for Xencor are lower risk after initial validation, usually yielding slower revenue growth but higher-margin flows as commercialization is partner-led. Partners carry promotion costs while Xencor supplies pivotal data and engineering support, preserving capital — Xencor held about $1.1 billion in cash and investments as of Dec 31, 2024. Strategy: milk label gains to fund ops while keeping optionality for new combos and indications.

Long-dated partnership support services
Long-dated partnership support services—technical support, manufacturing know-how and IP stewardship—generate recurring fees that are mature, low-growth but highly sticky, providing steady cash; industry practice in 2024 showed service-led partnership income often comprises over 40% of collaboration cashflows for mid-cap biotechs.
Tightening processes and standardizing SOPs keeps margins high (service gross margins commonly 50%+ in contract lines in 2024), making these services simple, dependable fuel for Xencor’s R&D engine.
- Technical support: recurring SLAs
- Manufacturing know-how: process royalties/licensing
- IP stewardship: maintenance fees, milestone-backed
- Characteristics: mature, low-growth, sticky
- Finance: 2024 bench: service margins ~50%+
Cash and short-term investments from prior deals
Treasury functions as an internal bank for Xencor, where cash and short-term investments provide runway to pace clinical spend; as of 2024 Xencor reported approximately $678.7 million in cash, cash equivalents and marketable securities, enabling measured risk-taking without external financing.
These reserves show no top-line growth but fund bold moves—prioritizing disciplined burn, staged trials, and milestone-based spending to extend runway; the steadier this base, the freer management is to swing big in oncology and immunology programs.
- Runway: ~678.7M (cash & short-term investments, 2024)
- Strategy: disciplined burn, staged trials
- Role: internal bank for bold strategic moves
High-margin royalties fund R&D and provide runway - optimize partner timing to smooth cash flow
Existing royalties, platform licensing and partner-led label expansions produced high-margin, steady cash in 2024, funding R&D while preserving operating leverage. Recurring services and treasury reserves provide predictable runway and optionality for higher-risk oncology/immunology shots. Maintain partner engagement and optimize deal timing to smooth cash flows.
| Metric | 2024 | Note |
|---|---|---|
| Cash & investments | $1.1B | Dec 31, 2024 |
| Cash & ST investments | $678.7M | 2024 reported |
| Service margins | ~50%+ | 2024 industry practice |
Full Transparency, Always
Xencor BCG Matrix
The file you’re previewing here is the exact BCG Matrix report you’ll receive after purchase—no watermarks, no demo text, just the finished, fully formatted document. It’s crafted for strategic clarity and ready to plug into presentations, planning sessions, or client decks. After you buy, the same file is instantly downloadable and editable—no surprises, no edits needed. Professional, market-informed, and set up for immediate use.

See the Bigger Picture
Want clarity on which products are driving growth and which are bleeding cash? This Xencor BCG Matrix preview teases the quadrant placements—buy the full report for a complete breakdown, data-backed recommendations, and quadrant maps that you can act on now. Purchase the full version to get a ready-to-use Word report and an Excel summary that make strategic decisions faster and presentations sharper.
Stars
XmAb technology platform adoption
XmAb platform is broadly validated, powering a growing pipeline and pulling in new use-cases as the global biologics market, valued at about $410 billion in 2024, expands. High scientific win rate positions Xencor as a leader in an area growing at roughly 8% CAGR, supporting premium deal flow. Continued steady investment in tooling, data, and BD is required to maintain edge and convert platform strength into predictable annuities.
Royalty-bearing partnered therapies scaling
Multiple partnered programs are launching or expanding labels, driving growing royalty lines; Xencor now supports over 20 partnered XmAb programs in clinic and beyond, giving high share in a fast-growing niche thanks to baked-in XmAb advantages.
Promotion remains largely partner-led, but Xencor must provide technical and lifecycle input to secure royalty upticks and label expansions.
As adoption widens, these royalty-bearing programs have a clear path to flip into Cash Cow territory.
Oncology bispecifics with clinical momentum
Oncology bispecifics are accelerating and Xencor sits squarely in the thick of the wave. Differentiated formats and flexible dosing are winning clinician mindshare, with >200 bispecifics in clinical development as of 2024. Trials aren’t cheap and cash burn is real, so sustaining R&D spend now locks in category leadership tomorrow.
High-credibility pharma alliances
High-credibility pharma alliances give Xencor distribution, regulatory muscle and global reach—effectively adding market share by proxy in a global pharma market estimated at $1.6 trillion in 2024 where the top 10 firms account for roughly 30% of sales; as positive readouts accumulate the alliance network expands, creating a virtuous loop.
- Co-investment required: joint dev and platform support
- Faster flywheel: clinical wins → new partnerships
- Proxy market share: leverage top-tier partner channels
Fc engineering know-how (effector, half-life, tuning)
Fc engineering know-how (effector, half-life, tuning) are behind-the-scenes superpowers that boost efficacy, safety and dosing convenience; with the 2024 biologics market topping $300B, demand for safer, longer‑lasting biologics is rising. Xencor’s leadership in Fc tuning is a strategic Star but requires continual variant development and fresh clinical/PK data to maintain premium positioning. Stay cutting-edge and the asset compounds.
- 2024 market size: >$300B
- Clinical impact: Fc half-life extension can cut dosing frequency up to ~50%
- Strategy: continual variant/data refresh to retain Star status
Validated platform with >20 partners, >200 bispecific tailwind, $410B TAM
XmAb platform validated with >20 partnered programs and strong deal flow as the 2024 biologics market reaches ~$410B; oncology bispecific tailwind (>200 bispecifics in clinic in 2024) drives Star status but demands sustained R&D spend. Fc engineering delivers ~50% dosing-frequency reduction potential; alliances provide proxy reach into a $1.6T pharma market (2024), accelerating royalty conversion to Cash Cows.
| Metric | 2024 | Implication |
|---|---|---|
| Partnered XmAb programs | >20 | Growing royalty base |
| Biologics market | $410B | Large TAM |
| Bispecifics in clinic | >200 | Oncology growth driver |
| Fc half-life impact | ~50% dosing cut | Commercial advantage |
What is included in the product
Detailed Word Document
Comprehensive BCG review of Xencor products with strategic moves per quadrant—invest, maintain, or divest, plus trend context.
Customizable Excel Spreadsheet
One-page Xencor BCG Matrix highlighting priorities to cut confusion and speed decisions
Cash Cows
Existing royalties from approved partner drugs
Existing royalties from approved partner drugs provided high-margin cash in 2024, flowing in without proportional increases in opex and preserving operating leverage. Growth typically moderates after launch curves but remains reliable, supporting steady free cash flow. Proceeds are allocated to fund higher-risk pipeline shots while maintaining day-to-day operations. Ongoing partner engagement is essential to preserve the royalty base.
Platform licensing and milestones
Platform licensing and milestones deliver predictable upfronts and near-term payments once deals are in motion. Low incremental cost to deliver versus cash received makes these agreements efficient; Xencor held over $1 billion in cash and investments as of Dec 31, 2023. Not a hyper-growth engine but steady—optimize deal mix and timing to smooth cash flows and fund R&D.
Follow-on indications and line extensions
Label expansions for Xencor are lower risk after initial validation, usually yielding slower revenue growth but higher-margin flows as commercialization is partner-led. Partners carry promotion costs while Xencor supplies pivotal data and engineering support, preserving capital — Xencor held about $1.1 billion in cash and investments as of Dec 31, 2024. Strategy: milk label gains to fund ops while keeping optionality for new combos and indications.
Long-dated partnership support services
Long-dated partnership support services—technical support, manufacturing know-how and IP stewardship—generate recurring fees that are mature, low-growth but highly sticky, providing steady cash; industry practice in 2024 showed service-led partnership income often comprises over 40% of collaboration cashflows for mid-cap biotechs.
Tightening processes and standardizing SOPs keeps margins high (service gross margins commonly 50%+ in contract lines in 2024), making these services simple, dependable fuel for Xencor’s R&D engine.
- Technical support: recurring SLAs
- Manufacturing know-how: process royalties/licensing
- IP stewardship: maintenance fees, milestone-backed
- Characteristics: mature, low-growth, sticky
- Finance: 2024 bench: service margins ~50%+
Cash and short-term investments from prior deals
Treasury functions as an internal bank for Xencor, where cash and short-term investments provide runway to pace clinical spend; as of 2024 Xencor reported approximately $678.7 million in cash, cash equivalents and marketable securities, enabling measured risk-taking without external financing.
These reserves show no top-line growth but fund bold moves—prioritizing disciplined burn, staged trials, and milestone-based spending to extend runway; the steadier this base, the freer management is to swing big in oncology and immunology programs.
- Runway: ~678.7M (cash & short-term investments, 2024)
- Strategy: disciplined burn, staged trials
- Role: internal bank for bold strategic moves
High-margin royalties fund R&D and provide runway - optimize partner timing to smooth cash flow
Existing royalties, platform licensing and partner-led label expansions produced high-margin, steady cash in 2024, funding R&D while preserving operating leverage. Recurring services and treasury reserves provide predictable runway and optionality for higher-risk oncology/immunology shots. Maintain partner engagement and optimize deal timing to smooth cash flows.
| Metric | 2024 | Note |
|---|---|---|
| Cash & investments | $1.1B | Dec 31, 2024 |
| Cash & ST investments | $678.7M | 2024 reported |
| Service margins | ~50%+ | 2024 industry practice |
Full Transparency, Always
Xencor BCG Matrix
The file you’re previewing here is the exact BCG Matrix report you’ll receive after purchase—no watermarks, no demo text, just the finished, fully formatted document. It’s crafted for strategic clarity and ready to plug into presentations, planning sessions, or client decks. After you buy, the same file is instantly downloadable and editable—no surprises, no edits needed. Professional, market-informed, and set up for immediate use.
Original: $10.00
-65%$10.00
$3.50Description
See the Bigger Picture
Want clarity on which products are driving growth and which are bleeding cash? This Xencor BCG Matrix preview teases the quadrant placements—buy the full report for a complete breakdown, data-backed recommendations, and quadrant maps that you can act on now. Purchase the full version to get a ready-to-use Word report and an Excel summary that make strategic decisions faster and presentations sharper.
Stars
XmAb technology platform adoption
XmAb platform is broadly validated, powering a growing pipeline and pulling in new use-cases as the global biologics market, valued at about $410 billion in 2024, expands. High scientific win rate positions Xencor as a leader in an area growing at roughly 8% CAGR, supporting premium deal flow. Continued steady investment in tooling, data, and BD is required to maintain edge and convert platform strength into predictable annuities.
Royalty-bearing partnered therapies scaling
Multiple partnered programs are launching or expanding labels, driving growing royalty lines; Xencor now supports over 20 partnered XmAb programs in clinic and beyond, giving high share in a fast-growing niche thanks to baked-in XmAb advantages.
Promotion remains largely partner-led, but Xencor must provide technical and lifecycle input to secure royalty upticks and label expansions.
As adoption widens, these royalty-bearing programs have a clear path to flip into Cash Cow territory.
Oncology bispecifics with clinical momentum
Oncology bispecifics are accelerating and Xencor sits squarely in the thick of the wave. Differentiated formats and flexible dosing are winning clinician mindshare, with >200 bispecifics in clinical development as of 2024. Trials aren’t cheap and cash burn is real, so sustaining R&D spend now locks in category leadership tomorrow.
High-credibility pharma alliances
High-credibility pharma alliances give Xencor distribution, regulatory muscle and global reach—effectively adding market share by proxy in a global pharma market estimated at $1.6 trillion in 2024 where the top 10 firms account for roughly 30% of sales; as positive readouts accumulate the alliance network expands, creating a virtuous loop.
- Co-investment required: joint dev and platform support
- Faster flywheel: clinical wins → new partnerships
- Proxy market share: leverage top-tier partner channels
Fc engineering know-how (effector, half-life, tuning)
Fc engineering know-how (effector, half-life, tuning) are behind-the-scenes superpowers that boost efficacy, safety and dosing convenience; with the 2024 biologics market topping $300B, demand for safer, longer‑lasting biologics is rising. Xencor’s leadership in Fc tuning is a strategic Star but requires continual variant development and fresh clinical/PK data to maintain premium positioning. Stay cutting-edge and the asset compounds.
- 2024 market size: >$300B
- Clinical impact: Fc half-life extension can cut dosing frequency up to ~50%
- Strategy: continual variant/data refresh to retain Star status
Validated platform with >20 partners, >200 bispecific tailwind, $410B TAM
XmAb platform validated with >20 partnered programs and strong deal flow as the 2024 biologics market reaches ~$410B; oncology bispecific tailwind (>200 bispecifics in clinic in 2024) drives Star status but demands sustained R&D spend. Fc engineering delivers ~50% dosing-frequency reduction potential; alliances provide proxy reach into a $1.6T pharma market (2024), accelerating royalty conversion to Cash Cows.
| Metric | 2024 | Implication |
|---|---|---|
| Partnered XmAb programs | >20 | Growing royalty base |
| Biologics market | $410B | Large TAM |
| Bispecifics in clinic | >200 | Oncology growth driver |
| Fc half-life impact | ~50% dosing cut | Commercial advantage |
What is included in the product
Detailed Word Document
Comprehensive BCG review of Xencor products with strategic moves per quadrant—invest, maintain, or divest, plus trend context.
Customizable Excel Spreadsheet
One-page Xencor BCG Matrix highlighting priorities to cut confusion and speed decisions
Cash Cows
Existing royalties from approved partner drugs
Existing royalties from approved partner drugs provided high-margin cash in 2024, flowing in without proportional increases in opex and preserving operating leverage. Growth typically moderates after launch curves but remains reliable, supporting steady free cash flow. Proceeds are allocated to fund higher-risk pipeline shots while maintaining day-to-day operations. Ongoing partner engagement is essential to preserve the royalty base.
Platform licensing and milestones
Platform licensing and milestones deliver predictable upfronts and near-term payments once deals are in motion. Low incremental cost to deliver versus cash received makes these agreements efficient; Xencor held over $1 billion in cash and investments as of Dec 31, 2023. Not a hyper-growth engine but steady—optimize deal mix and timing to smooth cash flows and fund R&D.
Follow-on indications and line extensions
Label expansions for Xencor are lower risk after initial validation, usually yielding slower revenue growth but higher-margin flows as commercialization is partner-led. Partners carry promotion costs while Xencor supplies pivotal data and engineering support, preserving capital — Xencor held about $1.1 billion in cash and investments as of Dec 31, 2024. Strategy: milk label gains to fund ops while keeping optionality for new combos and indications.
Long-dated partnership support services
Long-dated partnership support services—technical support, manufacturing know-how and IP stewardship—generate recurring fees that are mature, low-growth but highly sticky, providing steady cash; industry practice in 2024 showed service-led partnership income often comprises over 40% of collaboration cashflows for mid-cap biotechs.
Tightening processes and standardizing SOPs keeps margins high (service gross margins commonly 50%+ in contract lines in 2024), making these services simple, dependable fuel for Xencor’s R&D engine.
- Technical support: recurring SLAs
- Manufacturing know-how: process royalties/licensing
- IP stewardship: maintenance fees, milestone-backed
- Characteristics: mature, low-growth, sticky
- Finance: 2024 bench: service margins ~50%+
Cash and short-term investments from prior deals
Treasury functions as an internal bank for Xencor, where cash and short-term investments provide runway to pace clinical spend; as of 2024 Xencor reported approximately $678.7 million in cash, cash equivalents and marketable securities, enabling measured risk-taking without external financing.
These reserves show no top-line growth but fund bold moves—prioritizing disciplined burn, staged trials, and milestone-based spending to extend runway; the steadier this base, the freer management is to swing big in oncology and immunology programs.
- Runway: ~678.7M (cash & short-term investments, 2024)
- Strategy: disciplined burn, staged trials
- Role: internal bank for bold strategic moves
High-margin royalties fund R&D and provide runway - optimize partner timing to smooth cash flow
Existing royalties, platform licensing and partner-led label expansions produced high-margin, steady cash in 2024, funding R&D while preserving operating leverage. Recurring services and treasury reserves provide predictable runway and optionality for higher-risk oncology/immunology shots. Maintain partner engagement and optimize deal timing to smooth cash flows.
| Metric | 2024 | Note |
|---|---|---|
| Cash & investments | $1.1B | Dec 31, 2024 |
| Cash & ST investments | $678.7M | 2024 reported |
| Service margins | ~50%+ | 2024 industry practice |
Full Transparency, Always
Xencor BCG Matrix
The file you’re previewing here is the exact BCG Matrix report you’ll receive after purchase—no watermarks, no demo text, just the finished, fully formatted document. It’s crafted for strategic clarity and ready to plug into presentations, planning sessions, or client decks. After you buy, the same file is instantly downloadable and editable—no surprises, no edits needed. Professional, market-informed, and set up for immediate use.











