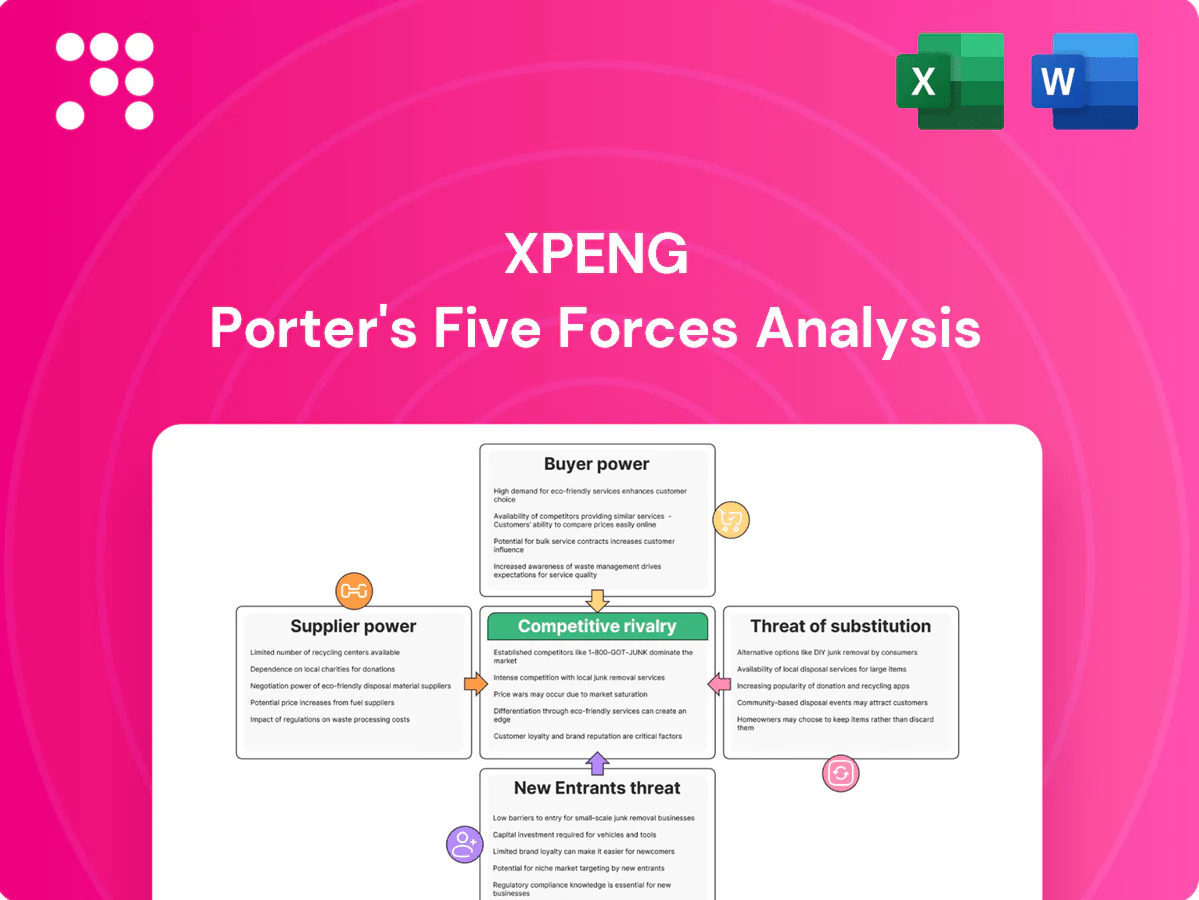
XPeng Porter's Five Forces Analysis

A Must-Have Tool for Decision-Makers
XPeng faces intense competitive rivalry, moderate supplier power, growing buyer sophistication, regulatory and technological threats, and rising substitute risks from alternative mobility solutions; this snapshot highlights key pressure points and strategic levers. This brief only scratches the surface—unlock the full Porter’s Five Forces Analysis to explore XPeng’s competitive dynamics and market pressures in depth.
Suppliers Bargaining Power

Battery supplier concentration
XPeng depends on high-energy-density packs from dominant suppliers such as CATL, which held roughly 33% of global EV battery shipments in 2023–24, giving suppliers clear negotiating leverage.
Few qualified alternative vendors and 12–18 month qualification cycles increase dependency and switching costs. Battery systems remain ~30% of EV BOM, so lithium and nickel price swings (raw-material volatility >50% since 2021) can be passed through and squeeze margins. Long-term contracts and a shift between LFP and NMC chemistries partly mitigate exposure.
Semiconductors and ADAS stack
Advanced chips for ADAS/infotainment (domain controllers, GPUs) are sourced from a handful of global vendors (NVIDIA, NXP, Infineon, Qualcomm/Mobileye), concentrating supplier power; the automotive semiconductor market was roughly US$57 billion in 2024. Tight supply and rapid performance cycles raise switching costs, while software-hardware integration makes redesigns lengthy and capital-intensive. Xpeng’s XPILOT and strategic supplier partnerships help rebalance supplier leverage.

LiDAR, sensors, and specialized components
LiDAR, radar, high‑res cameras and e‑axles are supplied by specialized vendors with few substitutes, and automotive‑grade LiDAR unit costs fell from >$70,000 in early commercial systems to roughly $1,000–5,000 for production variants by 2024, preserving supplier leverage. Low per‑model volumes (often <50,000 units) amplify unit costs and bargaining power, while qualification and calibration commonly take 12+ months and raise switching frictions. XPeng can lower dependency via dual‑sourcing and modular e‑architecture, which over time reduces single‑supplier risk and cost exposure.

Charging ecosystem and energy services
Access to third-party charging networks and grid services shapes XPeng customer experience; China had over 2 million public chargers by 2024 and DC fast chargers grew ~30% YoY, strengthening utilities and charge-point operators who can dictate terms in key urban corridors. Equipment standards and land-use constraints limit XPeng’s bargaining power, though co-investment in fast-charging hubs and partnerships improve negotiating leverage.
- Third-party networks dominant — >2M chargers (2024)
- DC fast chargers +30% YoY (2024)
- Land-use & standards constrain OEMs
- Co-investment/partnerships raise leverage
Raw materials and logistics
Price swings in lithium (lithium carbonate down roughly 50% from 2022 peaks by 2024) and cobalt (≈40% decline) ripple through XPeng’s costs; rare earth and graphite bottlenecks still spike margins. Shipping and tariffs—container rates returned toward pre‑COVID levels by 2024—plus geopolitics lengthen lead times. Refiners and cathode/anode specialists extract rents in shortages, while XPeng’s push for vertical integration and battery recycling reduces supplier leverage.
- Raw material volatility: lithium down ≈50% vs 2022
- Shipping: container rates normalized by 2024
- Supplier rents climb in shortages
- Mitigation: vertical integration + recycling
Supplier concentration gives EV OEMs leverage risk: batteries, chips, LiDAR, chargers
XPeng depends on dominant battery suppliers (CATL ~33% of global EV battery shipments 2023–24), creating clear supplier leverage.
Automotive semiconductors (~US$57bn market 2024) and LiDAR/radar suppliers remain concentrated; LiDAR unit costs fell to ~$1,000–5,000 by 2024, preserving supplier power at low volumes.
Charging networks (>2M public chargers China 2024; DC fast chargers +30% YoY) and raw‑material swings (lithium ~‑50% vs 2022) further constrain XPeng; mitigation: partnerships, dual‑sourcing, vertical integration.
| Supplier | Metric | 2024 |
|---|---|---|
| Battery (CATL) | Share | ~33% |
| Semiconductors | Market size | US$57bn |
| Charging | Public chargers China | >2M |
| Lithium | Price vs 2022 | ≈‑50% |
What is included in the product
 Detailed Word Document
Tailored exclusively for XPeng, this Porter's Five Forces overview uncovers key drivers of competition, customer and supplier influence, entry barriers, substitutes and disruptive threats shaping its pricing power, profitability and strategic positioning in the EV market.

 Customizable Excel Spreadsheet
A concise one-sheet Porter's Five Forces for XPeng—instantly exposes competitive pressures, supplier/buyer dynamics and regulatory risk so teams can prioritize strategic moves and update assumptions for evolving EV market conditions.
Customers Bargaining Power

High price transparency
High price transparency lets EV buyers compare specs, range and prices across brands in real time, with China reaching roughly 30% NEV penetration in 2024 so comparison shopping intensified. Online configurators and rolling promotions amplify bargaining leverage and incentive-driven purchasing windows accelerate deal-seeking. XPeng responds with feature-led value propositions and flexible financing offers, including time-limited subsidies and structured loans to protect margins.
Low switching costs among EV brands
Low switching costs let consumers in 2024 move easily to Tesla, BYD, NIO, Li Auto or Huawei-backed models with minimal friction. Hardware parity in range and charging speeds reduces differentiation, while widespread test-drive access and fast delivery shorten decision cycles. XPeng’s software ecosystem and OTA roadmap aim to lock in loyalty through continuous feature updates.

Fleet and ride-hailing buyers
Commercial fleet and ride-hailing buyers extract volume discounts of roughly 10–20% and insist on SLAs tied to uptime and charging access; total cost of ownership drives over 60% of procurement decisions in fleet deployments. Uptime and charging access become contractual obligations with penalties for downtime. XPeng’s 2024 service network and telematics—deployed across 300+ service points—help win deals but compress margins.

After-sales expectations
Buyers demand robust warranties, maintenance and frequent OTA updates; poor responsiveness sparks churn and negative reviews, increasing post-sale leverage as warranty liabilities rise. XPeng’s OTA cadence and integrated service network—over 1,000 sales/service outlets by 2024—help reduce churn and defend margins.
- Warranties: raise buyer leverage
- Service speed: drives churn/public reviews
- OTA updates: retention tool
- 1,000+ outlets (2024): service moat
International market diversity
Overseas buyers confront varied safety standards, subsidy regimes and brand perceptions that weaken uniform bargaining for XPeng; import duties and certification costs often shift total ownership economics in favor of local makes. Local competitors and entrenched dealer models set price and service expectations, while XPeng’s tailored pricing and localized feature packs reduce buyer leverage abroad.
- Standards/subsidies vary by market
- Import duties alter value equations
- Local dealers shape expectations
- Localization blunts buyer power
Transparent prices and low switching costs lift buyers as NEV hits 30%
High price transparency and 30% NEV penetration (China, 2024) amplify customer bargaining power, aided by online configurators and promotions. Low switching costs and hardware parity let buyers shift to Tesla, BYD, NIO easily, while fleet purchasers extract 10–20% discounts. XPeng’s OTA updates, 300+ service points and 1,000+ outlets (2024) partially offset pressure.
| Metric | 2024 |
|---|---|
| China NEV penetration | ~30% |
| Fleet discounts | 10–20% |
| Service points | 300+ |
| Sales/service outlets | 1,000+ |
Preview Before You Purchase
XPeng Porter's Five Forces Analysis
This preview shows the exact XPeng Porter's Five Forces Analysis you'll receive immediately after purchase—no placeholders or summaries. The full document is fully formatted, professionally written, and ready for download and use the moment you buy. What you see is what you get.

A Must-Have Tool for Decision-Makers
XPeng faces intense competitive rivalry, moderate supplier power, growing buyer sophistication, regulatory and technological threats, and rising substitute risks from alternative mobility solutions; this snapshot highlights key pressure points and strategic levers. This brief only scratches the surface—unlock the full Porter’s Five Forces Analysis to explore XPeng’s competitive dynamics and market pressures in depth.
Suppliers Bargaining Power
Battery supplier concentration
XPeng depends on high-energy-density packs from dominant suppliers such as CATL, which held roughly 33% of global EV battery shipments in 2023–24, giving suppliers clear negotiating leverage.
Few qualified alternative vendors and 12–18 month qualification cycles increase dependency and switching costs. Battery systems remain ~30% of EV BOM, so lithium and nickel price swings (raw-material volatility >50% since 2021) can be passed through and squeeze margins. Long-term contracts and a shift between LFP and NMC chemistries partly mitigate exposure.
Semiconductors and ADAS stack
Advanced chips for ADAS/infotainment (domain controllers, GPUs) are sourced from a handful of global vendors (NVIDIA, NXP, Infineon, Qualcomm/Mobileye), concentrating supplier power; the automotive semiconductor market was roughly US$57 billion in 2024. Tight supply and rapid performance cycles raise switching costs, while software-hardware integration makes redesigns lengthy and capital-intensive. Xpeng’s XPILOT and strategic supplier partnerships help rebalance supplier leverage.
LiDAR, sensors, and specialized components
LiDAR, radar, high‑res cameras and e‑axles are supplied by specialized vendors with few substitutes, and automotive‑grade LiDAR unit costs fell from >$70,000 in early commercial systems to roughly $1,000–5,000 for production variants by 2024, preserving supplier leverage. Low per‑model volumes (often <50,000 units) amplify unit costs and bargaining power, while qualification and calibration commonly take 12+ months and raise switching frictions. XPeng can lower dependency via dual‑sourcing and modular e‑architecture, which over time reduces single‑supplier risk and cost exposure.
Charging ecosystem and energy services
Access to third-party charging networks and grid services shapes XPeng customer experience; China had over 2 million public chargers by 2024 and DC fast chargers grew ~30% YoY, strengthening utilities and charge-point operators who can dictate terms in key urban corridors. Equipment standards and land-use constraints limit XPeng’s bargaining power, though co-investment in fast-charging hubs and partnerships improve negotiating leverage.
- Third-party networks dominant — >2M chargers (2024)
- DC fast chargers +30% YoY (2024)
- Land-use & standards constrain OEMs
- Co-investment/partnerships raise leverage
Raw materials and logistics
Price swings in lithium (lithium carbonate down roughly 50% from 2022 peaks by 2024) and cobalt (≈40% decline) ripple through XPeng’s costs; rare earth and graphite bottlenecks still spike margins. Shipping and tariffs—container rates returned toward pre‑COVID levels by 2024—plus geopolitics lengthen lead times. Refiners and cathode/anode specialists extract rents in shortages, while XPeng’s push for vertical integration and battery recycling reduces supplier leverage.
- Raw material volatility: lithium down ≈50% vs 2022
- Shipping: container rates normalized by 2024
- Supplier rents climb in shortages
- Mitigation: vertical integration + recycling
Supplier concentration gives EV OEMs leverage risk: batteries, chips, LiDAR, chargers
XPeng depends on dominant battery suppliers (CATL ~33% of global EV battery shipments 2023–24), creating clear supplier leverage.
Automotive semiconductors (~US$57bn market 2024) and LiDAR/radar suppliers remain concentrated; LiDAR unit costs fell to ~$1,000–5,000 by 2024, preserving supplier power at low volumes.
Charging networks (>2M public chargers China 2024; DC fast chargers +30% YoY) and raw‑material swings (lithium ~‑50% vs 2022) further constrain XPeng; mitigation: partnerships, dual‑sourcing, vertical integration.
| Supplier | Metric | 2024 |
|---|---|---|
| Battery (CATL) | Share | ~33% |
| Semiconductors | Market size | US$57bn |
| Charging | Public chargers China | >2M |
| Lithium | Price vs 2022 | ≈‑50% |
What is included in the product
Detailed Word Document
Tailored exclusively for XPeng, this Porter's Five Forces overview uncovers key drivers of competition, customer and supplier influence, entry barriers, substitutes and disruptive threats shaping its pricing power, profitability and strategic positioning in the EV market.
Customizable Excel Spreadsheet
A concise one-sheet Porter's Five Forces for XPeng—instantly exposes competitive pressures, supplier/buyer dynamics and regulatory risk so teams can prioritize strategic moves and update assumptions for evolving EV market conditions.
Customers Bargaining Power
High price transparency
High price transparency lets EV buyers compare specs, range and prices across brands in real time, with China reaching roughly 30% NEV penetration in 2024 so comparison shopping intensified. Online configurators and rolling promotions amplify bargaining leverage and incentive-driven purchasing windows accelerate deal-seeking. XPeng responds with feature-led value propositions and flexible financing offers, including time-limited subsidies and structured loans to protect margins.
Low switching costs among EV brands
Low switching costs let consumers in 2024 move easily to Tesla, BYD, NIO, Li Auto or Huawei-backed models with minimal friction. Hardware parity in range and charging speeds reduces differentiation, while widespread test-drive access and fast delivery shorten decision cycles. XPeng’s software ecosystem and OTA roadmap aim to lock in loyalty through continuous feature updates.
Fleet and ride-hailing buyers
Commercial fleet and ride-hailing buyers extract volume discounts of roughly 10–20% and insist on SLAs tied to uptime and charging access; total cost of ownership drives over 60% of procurement decisions in fleet deployments. Uptime and charging access become contractual obligations with penalties for downtime. XPeng’s 2024 service network and telematics—deployed across 300+ service points—help win deals but compress margins.
After-sales expectations
Buyers demand robust warranties, maintenance and frequent OTA updates; poor responsiveness sparks churn and negative reviews, increasing post-sale leverage as warranty liabilities rise. XPeng’s OTA cadence and integrated service network—over 1,000 sales/service outlets by 2024—help reduce churn and defend margins.
- Warranties: raise buyer leverage
- Service speed: drives churn/public reviews
- OTA updates: retention tool
- 1,000+ outlets (2024): service moat
International market diversity
Overseas buyers confront varied safety standards, subsidy regimes and brand perceptions that weaken uniform bargaining for XPeng; import duties and certification costs often shift total ownership economics in favor of local makes. Local competitors and entrenched dealer models set price and service expectations, while XPeng’s tailored pricing and localized feature packs reduce buyer leverage abroad.
- Standards/subsidies vary by market
- Import duties alter value equations
- Local dealers shape expectations
- Localization blunts buyer power
Transparent prices and low switching costs lift buyers as NEV hits 30%
High price transparency and 30% NEV penetration (China, 2024) amplify customer bargaining power, aided by online configurators and promotions. Low switching costs and hardware parity let buyers shift to Tesla, BYD, NIO easily, while fleet purchasers extract 10–20% discounts. XPeng’s OTA updates, 300+ service points and 1,000+ outlets (2024) partially offset pressure.
| Metric | 2024 |
|---|---|
| China NEV penetration | ~30% |
| Fleet discounts | 10–20% |
| Service points | 300+ |
| Sales/service outlets | 1,000+ |
Preview Before You Purchase
XPeng Porter's Five Forces Analysis
This preview shows the exact XPeng Porter's Five Forces Analysis you'll receive immediately after purchase—no placeholders or summaries. The full document is fully formatted, professionally written, and ready for download and use the moment you buy. What you see is what you get.
Original: $10.00
-65%$10.00
$3.50Description
A Must-Have Tool for Decision-Makers
XPeng faces intense competitive rivalry, moderate supplier power, growing buyer sophistication, regulatory and technological threats, and rising substitute risks from alternative mobility solutions; this snapshot highlights key pressure points and strategic levers. This brief only scratches the surface—unlock the full Porter’s Five Forces Analysis to explore XPeng’s competitive dynamics and market pressures in depth.
Suppliers Bargaining Power
Battery supplier concentration
XPeng depends on high-energy-density packs from dominant suppliers such as CATL, which held roughly 33% of global EV battery shipments in 2023–24, giving suppliers clear negotiating leverage.
Few qualified alternative vendors and 12–18 month qualification cycles increase dependency and switching costs. Battery systems remain ~30% of EV BOM, so lithium and nickel price swings (raw-material volatility >50% since 2021) can be passed through and squeeze margins. Long-term contracts and a shift between LFP and NMC chemistries partly mitigate exposure.
Semiconductors and ADAS stack
Advanced chips for ADAS/infotainment (domain controllers, GPUs) are sourced from a handful of global vendors (NVIDIA, NXP, Infineon, Qualcomm/Mobileye), concentrating supplier power; the automotive semiconductor market was roughly US$57 billion in 2024. Tight supply and rapid performance cycles raise switching costs, while software-hardware integration makes redesigns lengthy and capital-intensive. Xpeng’s XPILOT and strategic supplier partnerships help rebalance supplier leverage.
LiDAR, sensors, and specialized components
LiDAR, radar, high‑res cameras and e‑axles are supplied by specialized vendors with few substitutes, and automotive‑grade LiDAR unit costs fell from >$70,000 in early commercial systems to roughly $1,000–5,000 for production variants by 2024, preserving supplier leverage. Low per‑model volumes (often <50,000 units) amplify unit costs and bargaining power, while qualification and calibration commonly take 12+ months and raise switching frictions. XPeng can lower dependency via dual‑sourcing and modular e‑architecture, which over time reduces single‑supplier risk and cost exposure.
Charging ecosystem and energy services
Access to third-party charging networks and grid services shapes XPeng customer experience; China had over 2 million public chargers by 2024 and DC fast chargers grew ~30% YoY, strengthening utilities and charge-point operators who can dictate terms in key urban corridors. Equipment standards and land-use constraints limit XPeng’s bargaining power, though co-investment in fast-charging hubs and partnerships improve negotiating leverage.
- Third-party networks dominant — >2M chargers (2024)
- DC fast chargers +30% YoY (2024)
- Land-use & standards constrain OEMs
- Co-investment/partnerships raise leverage
Raw materials and logistics
Price swings in lithium (lithium carbonate down roughly 50% from 2022 peaks by 2024) and cobalt (≈40% decline) ripple through XPeng’s costs; rare earth and graphite bottlenecks still spike margins. Shipping and tariffs—container rates returned toward pre‑COVID levels by 2024—plus geopolitics lengthen lead times. Refiners and cathode/anode specialists extract rents in shortages, while XPeng’s push for vertical integration and battery recycling reduces supplier leverage.
- Raw material volatility: lithium down ≈50% vs 2022
- Shipping: container rates normalized by 2024
- Supplier rents climb in shortages
- Mitigation: vertical integration + recycling
Supplier concentration gives EV OEMs leverage risk: batteries, chips, LiDAR, chargers
XPeng depends on dominant battery suppliers (CATL ~33% of global EV battery shipments 2023–24), creating clear supplier leverage.
Automotive semiconductors (~US$57bn market 2024) and LiDAR/radar suppliers remain concentrated; LiDAR unit costs fell to ~$1,000–5,000 by 2024, preserving supplier power at low volumes.
Charging networks (>2M public chargers China 2024; DC fast chargers +30% YoY) and raw‑material swings (lithium ~‑50% vs 2022) further constrain XPeng; mitigation: partnerships, dual‑sourcing, vertical integration.
| Supplier | Metric | 2024 |
|---|---|---|
| Battery (CATL) | Share | ~33% |
| Semiconductors | Market size | US$57bn |
| Charging | Public chargers China | >2M |
| Lithium | Price vs 2022 | ≈‑50% |
What is included in the product
Detailed Word Document
Tailored exclusively for XPeng, this Porter's Five Forces overview uncovers key drivers of competition, customer and supplier influence, entry barriers, substitutes and disruptive threats shaping its pricing power, profitability and strategic positioning in the EV market.
Customizable Excel Spreadsheet
A concise one-sheet Porter's Five Forces for XPeng—instantly exposes competitive pressures, supplier/buyer dynamics and regulatory risk so teams can prioritize strategic moves and update assumptions for evolving EV market conditions.
Customers Bargaining Power
High price transparency
High price transparency lets EV buyers compare specs, range and prices across brands in real time, with China reaching roughly 30% NEV penetration in 2024 so comparison shopping intensified. Online configurators and rolling promotions amplify bargaining leverage and incentive-driven purchasing windows accelerate deal-seeking. XPeng responds with feature-led value propositions and flexible financing offers, including time-limited subsidies and structured loans to protect margins.
Low switching costs among EV brands
Low switching costs let consumers in 2024 move easily to Tesla, BYD, NIO, Li Auto or Huawei-backed models with minimal friction. Hardware parity in range and charging speeds reduces differentiation, while widespread test-drive access and fast delivery shorten decision cycles. XPeng’s software ecosystem and OTA roadmap aim to lock in loyalty through continuous feature updates.
Fleet and ride-hailing buyers
Commercial fleet and ride-hailing buyers extract volume discounts of roughly 10–20% and insist on SLAs tied to uptime and charging access; total cost of ownership drives over 60% of procurement decisions in fleet deployments. Uptime and charging access become contractual obligations with penalties for downtime. XPeng’s 2024 service network and telematics—deployed across 300+ service points—help win deals but compress margins.
After-sales expectations
Buyers demand robust warranties, maintenance and frequent OTA updates; poor responsiveness sparks churn and negative reviews, increasing post-sale leverage as warranty liabilities rise. XPeng’s OTA cadence and integrated service network—over 1,000 sales/service outlets by 2024—help reduce churn and defend margins.
- Warranties: raise buyer leverage
- Service speed: drives churn/public reviews
- OTA updates: retention tool
- 1,000+ outlets (2024): service moat
International market diversity
Overseas buyers confront varied safety standards, subsidy regimes and brand perceptions that weaken uniform bargaining for XPeng; import duties and certification costs often shift total ownership economics in favor of local makes. Local competitors and entrenched dealer models set price and service expectations, while XPeng’s tailored pricing and localized feature packs reduce buyer leverage abroad.
- Standards/subsidies vary by market
- Import duties alter value equations
- Local dealers shape expectations
- Localization blunts buyer power
Transparent prices and low switching costs lift buyers as NEV hits 30%
High price transparency and 30% NEV penetration (China, 2024) amplify customer bargaining power, aided by online configurators and promotions. Low switching costs and hardware parity let buyers shift to Tesla, BYD, NIO easily, while fleet purchasers extract 10–20% discounts. XPeng’s OTA updates, 300+ service points and 1,000+ outlets (2024) partially offset pressure.
| Metric | 2024 |
|---|---|
| China NEV penetration | ~30% |
| Fleet discounts | 10–20% |
| Service points | 300+ |
| Sales/service outlets | 1,000+ |
Preview Before You Purchase
XPeng Porter's Five Forces Analysis
This preview shows the exact XPeng Porter's Five Forces Analysis you'll receive immediately after purchase—no placeholders or summaries. The full document is fully formatted, professionally written, and ready for download and use the moment you buy. What you see is what you get.











