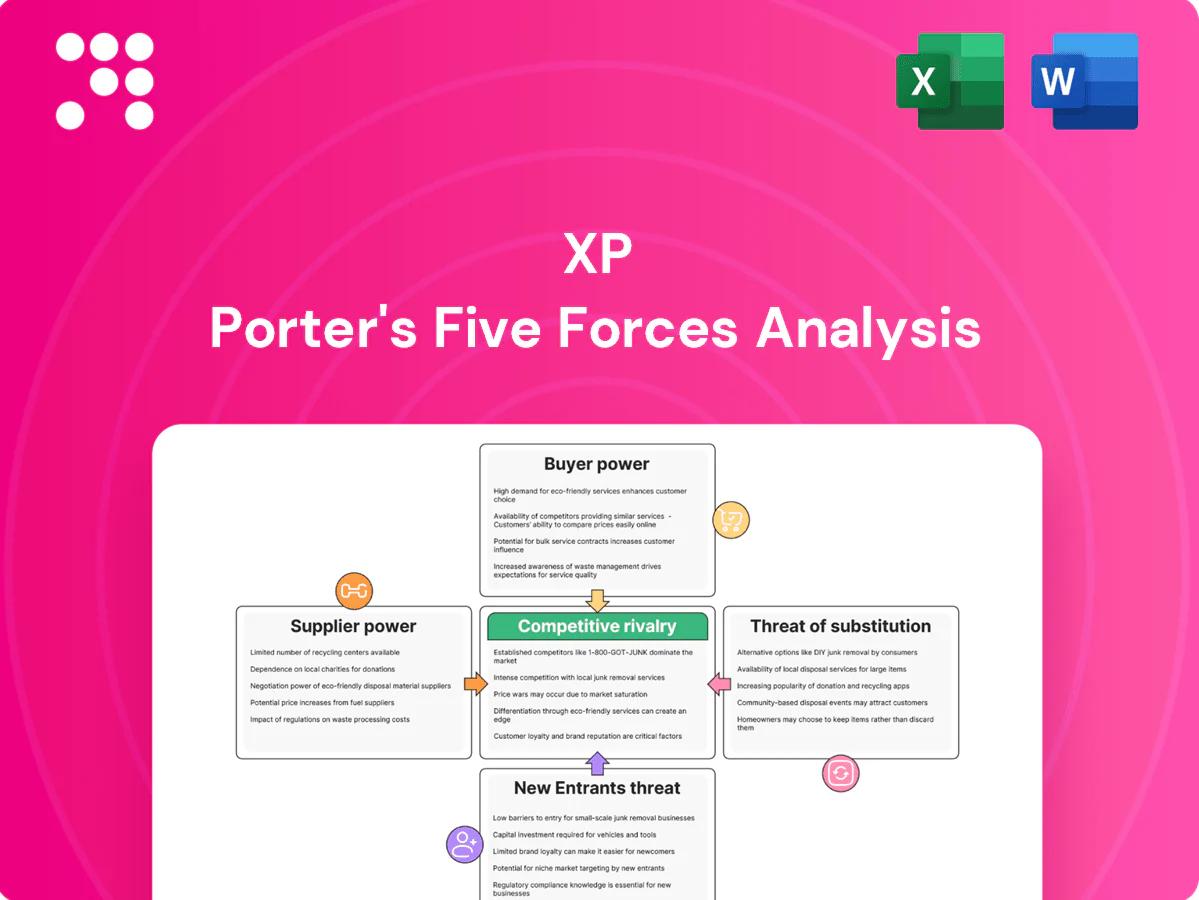
XP Porter's Five Forces Analysis

A Must-Have Tool for Decision-Makers
XP’s Porter's Five Forces snapshot highlights competitive intensity, buyer and supplier leverage, barriers to entry, and substitute risks shaping its strategy and margins. This concise overview spotlights key vulnerabilities and advantages but omits detailed ratings, visuals, and scenario analysis. Unlock the full Porter's Five Forces Analysis for force-by-force scores, actionable implications, and presentation-ready deliverables. Purchase the complete report to inform smarter investment and strategic decisions.
Suppliers Bargaining Power

Dependence on B3 exchange
XP routes most equity trades through B3, the sole domestic securities exchange in Brazil in 2024, giving B3 strong leverage over fees, connectivity standards and market-data pricing. Alternative venues remain limited, constraining XP’s bargaining room despite volume-tier discounts and long-term contracts that can partially mitigate costs. Concentration risk is material: any B3 fee or rule change flows directly into XP’s unit economics.
Product shelf from asset managers
Fund houses and structured product issuers compete for placement on XP’s product shelf, limiting supplier pricing power despite XP’s distribution to millions of retail and HNW clients in 2024. XP’s scale makes it a must-have channel for many managers, yet top-performing or exclusive strategies can negotiate improved fee splits. Co-distribution and revenue-sharing remain recurring negotiation levers.

Market data and technology vendors
In 2024, market data, analytics and trading tech are concentrated among a few specialized providers, giving suppliers oligopolistic leverage. Switching vendors incurs significant cost, retraining and operational risk, which raises supplier power. Multi-vendor architectures and selective in-house builds reduce lock-in. Volume-based, multi-year contracts and tiered pricing often temper headline pricing power.

Clearing, custody, and payment rails
Clearing, custody and payment rails are highly regulated and concentrated, with the top five global custodians controlling roughly 70% of the custody market in 2024, giving providers structural leverage over fees and SLAs. Stringent reliability and compliance needs limit XP’s feasible alternatives, while scale improves negotiation but systemic dependencies remain. Any disruption can materially affect client experience and regulatory KPIs.
- Concentration: top-5 ≈70% (2024)
- Reliability: uptime & settlement SLAs critical
- Dependency: few alternative rails
- Impact: disruptions affect client NPS and regulatory metrics
Advisor and specialist talent
High-performing advisors and specialists are scarce and mobile, giving them strong bargaining power; XP reported roughly 15,000 advisors in 2024 and faces industry turnover near 10%, pushing up compensation and platform-investment costs. XP’s platform, brand and tools raise acquisition and retention expenses, while its training ecosystem supplies talent and partially offsets scarcity. Non-competes and culture lower but do not eliminate attrition risk.
- talent pool ≈15,000 (2024)
- turnover ≈10%
- higher comp and platform costs
- training offsets scarcity
- non-competes reduce but don't stop exits
2024 monopoly increases fee & data leverage; custodians hold ≈70%
B3's 2024 monopoly on domestic equities gives it outsized fee and data leverage over XP. Top-5 custodians hold ≈70% of custody, constraining alternative rails and SLAs. Market-data vendors are oligopolistic and switching is costly; talent pool ≈15,000 advisors with ≈10% turnover raises compensation pressure.
| Item | 2024 metric |
|---|---|
| B3 market position | sole domestic exchange |
| Custody concentration | Top‑5 ≈70% |
| Advisors | ≈15,000 (turnover ≈10%) |
What is included in the product
 Detailed Word Document
Comprehensive Porter’s Five Forces analysis tailored for XP that uncovers competitive drivers, buyer and supplier power, entry barriers, substitutes and disruptive threats, evaluates pricing and profitability pressures, and is delivered in fully editable Word format for use in investor materials, strategy decks, business plans, or academic projects.

 Customizable Excel Spreadsheet
A single-sheet XP Porter’s Five Forces summary with customizable pressure levels and an instant spider chart—simplifies strategic decision-making and slides, easy to edit and integrates into dashboards with no macros required.
Customers Bargaining Power

Price-sensitive retail investors
Brazilian retail clients routinely compare fees across apps, pressuring commissions, spreads and advisory fees downward; zero-commission equity and promotional pricing have amplified buyer power. By 2024 XP served over 5 million clients, forcing emphasis on non-price differentiation. XP leans on breadth of products, investor education and UX to justify fees, but churn risk rises sharply when performance or service quality dips.
Institutional and HNW negotiation
Larger institutional and HNW clients extract custom pricing, tailored service tiers and prioritized execution, leveraging mandate concentration to negotiate fee schedules and product access. XP must consistently deliver alpha, deep liquidity and institutional-grade reporting to retain share, as absence drives rapid mandate reallocation. Deep relationships and integrated solutions mitigate pure price pressure by increasing switching costs.

Low switching costs and multi-homing
Opening multiple accounts is easy, enabling clients to split flows across platforms; XP reported 7.8 million clients and R$1.1 trillion AUM in 2024, underscoring scale but not exclusivity. Multi-homing erodes loyalty and strengthens buyer leverage in promos and rates, driving price-sensitive flows. XP invests in integrated journeys to raise switching frictions. Sticky services like wealth planning and credit increase lifetime value.

Demand for education and UX
Clients demand robust educational content, advanced tools and seamless mobile UX; failure to deliver prompts threats to move assets. XP’s education moat reduces pure price-based churn and supported R$1.05 trillion AUC in 2024, limiting pure price comparisons. Continuous feature velocity is required to sustain perceived value as mobile interaction dominates investor activity.
- Clients expect mobile-first experiences
- Education lowers price sensitivity
- Feature velocity = retention
Product transparency and regulation
Enhanced 2024 disclosures have made fees and risks far clearer, empowering buyers and accelerating fee-sensitive switching; benchmark platforms (Morningstar, ANBIMA tools) intensified comparison shopping. XP must craft outcome-based narratives to defend margins as underperformance sparks renegotiation or rapid outflows, seen in quarterly client flows after missed targets. Transparency raises bargaining leverage for customers.
Brazilian investors: 7.8m, R$1.1T AUM pressures fees
Brazilian clients wield strong price leverage: XP had 7.8 million clients and R$1.1 trillion AUM in 2024, driving fee compression and multi-homing. Institutional/HNW mandates negotiate bespoke fees, raising retention stakes. Education, UX and sticky credit/wealth services mitigate churn but require rapid feature velocity. Transparency and benchmarking tools increased switching after underperformance.
| Metric | 2024 | Implication |
|---|---|---|
| Clients | 7.8m | High buyer power |
| AUM | R$1.1T | Scale but not exclusivity |
| AUC | R$1.05T | Education lowers churn |
Same Document Delivered
XP Porter's Five Forces Analysis
This preview shows the exact XP Porter's Five Forces Analysis you'll receive immediately after purchase—no placeholders or samples. The document displayed here is the professionally written, fully formatted final file ready for download and use the moment you buy. You’re viewing the full deliverable; once payment is complete you’ll have instant access to this same document.

A Must-Have Tool for Decision-Makers
XP’s Porter's Five Forces snapshot highlights competitive intensity, buyer and supplier leverage, barriers to entry, and substitute risks shaping its strategy and margins. This concise overview spotlights key vulnerabilities and advantages but omits detailed ratings, visuals, and scenario analysis. Unlock the full Porter's Five Forces Analysis for force-by-force scores, actionable implications, and presentation-ready deliverables. Purchase the complete report to inform smarter investment and strategic decisions.
Suppliers Bargaining Power
Dependence on B3 exchange
XP routes most equity trades through B3, the sole domestic securities exchange in Brazil in 2024, giving B3 strong leverage over fees, connectivity standards and market-data pricing. Alternative venues remain limited, constraining XP’s bargaining room despite volume-tier discounts and long-term contracts that can partially mitigate costs. Concentration risk is material: any B3 fee or rule change flows directly into XP’s unit economics.
Product shelf from asset managers
Fund houses and structured product issuers compete for placement on XP’s product shelf, limiting supplier pricing power despite XP’s distribution to millions of retail and HNW clients in 2024. XP’s scale makes it a must-have channel for many managers, yet top-performing or exclusive strategies can negotiate improved fee splits. Co-distribution and revenue-sharing remain recurring negotiation levers.
Market data and technology vendors
In 2024, market data, analytics and trading tech are concentrated among a few specialized providers, giving suppliers oligopolistic leverage. Switching vendors incurs significant cost, retraining and operational risk, which raises supplier power. Multi-vendor architectures and selective in-house builds reduce lock-in. Volume-based, multi-year contracts and tiered pricing often temper headline pricing power.
Clearing, custody, and payment rails
Clearing, custody and payment rails are highly regulated and concentrated, with the top five global custodians controlling roughly 70% of the custody market in 2024, giving providers structural leverage over fees and SLAs. Stringent reliability and compliance needs limit XP’s feasible alternatives, while scale improves negotiation but systemic dependencies remain. Any disruption can materially affect client experience and regulatory KPIs.
- Concentration: top-5 ≈70% (2024)
- Reliability: uptime & settlement SLAs critical
- Dependency: few alternative rails
- Impact: disruptions affect client NPS and regulatory metrics
Advisor and specialist talent
High-performing advisors and specialists are scarce and mobile, giving them strong bargaining power; XP reported roughly 15,000 advisors in 2024 and faces industry turnover near 10%, pushing up compensation and platform-investment costs. XP’s platform, brand and tools raise acquisition and retention expenses, while its training ecosystem supplies talent and partially offsets scarcity. Non-competes and culture lower but do not eliminate attrition risk.
- talent pool ≈15,000 (2024)
- turnover ≈10%
- higher comp and platform costs
- training offsets scarcity
- non-competes reduce but don't stop exits
2024 monopoly increases fee & data leverage; custodians hold ≈70%
B3's 2024 monopoly on domestic equities gives it outsized fee and data leverage over XP. Top-5 custodians hold ≈70% of custody, constraining alternative rails and SLAs. Market-data vendors are oligopolistic and switching is costly; talent pool ≈15,000 advisors with ≈10% turnover raises compensation pressure.
| Item | 2024 metric |
|---|---|
| B3 market position | sole domestic exchange |
| Custody concentration | Top‑5 ≈70% |
| Advisors | ≈15,000 (turnover ≈10%) |
What is included in the product
Detailed Word Document
Comprehensive Porter’s Five Forces analysis tailored for XP that uncovers competitive drivers, buyer and supplier power, entry barriers, substitutes and disruptive threats, evaluates pricing and profitability pressures, and is delivered in fully editable Word format for use in investor materials, strategy decks, business plans, or academic projects.
Customizable Excel Spreadsheet
A single-sheet XP Porter’s Five Forces summary with customizable pressure levels and an instant spider chart—simplifies strategic decision-making and slides, easy to edit and integrates into dashboards with no macros required.
Customers Bargaining Power
Price-sensitive retail investors
Brazilian retail clients routinely compare fees across apps, pressuring commissions, spreads and advisory fees downward; zero-commission equity and promotional pricing have amplified buyer power. By 2024 XP served over 5 million clients, forcing emphasis on non-price differentiation. XP leans on breadth of products, investor education and UX to justify fees, but churn risk rises sharply when performance or service quality dips.
Institutional and HNW negotiation
Larger institutional and HNW clients extract custom pricing, tailored service tiers and prioritized execution, leveraging mandate concentration to negotiate fee schedules and product access. XP must consistently deliver alpha, deep liquidity and institutional-grade reporting to retain share, as absence drives rapid mandate reallocation. Deep relationships and integrated solutions mitigate pure price pressure by increasing switching costs.
Low switching costs and multi-homing
Opening multiple accounts is easy, enabling clients to split flows across platforms; XP reported 7.8 million clients and R$1.1 trillion AUM in 2024, underscoring scale but not exclusivity. Multi-homing erodes loyalty and strengthens buyer leverage in promos and rates, driving price-sensitive flows. XP invests in integrated journeys to raise switching frictions. Sticky services like wealth planning and credit increase lifetime value.
Demand for education and UX
Clients demand robust educational content, advanced tools and seamless mobile UX; failure to deliver prompts threats to move assets. XP’s education moat reduces pure price-based churn and supported R$1.05 trillion AUC in 2024, limiting pure price comparisons. Continuous feature velocity is required to sustain perceived value as mobile interaction dominates investor activity.
- Clients expect mobile-first experiences
- Education lowers price sensitivity
- Feature velocity = retention
Product transparency and regulation
Enhanced 2024 disclosures have made fees and risks far clearer, empowering buyers and accelerating fee-sensitive switching; benchmark platforms (Morningstar, ANBIMA tools) intensified comparison shopping. XP must craft outcome-based narratives to defend margins as underperformance sparks renegotiation or rapid outflows, seen in quarterly client flows after missed targets. Transparency raises bargaining leverage for customers.
Brazilian investors: 7.8m, R$1.1T AUM pressures fees
Brazilian clients wield strong price leverage: XP had 7.8 million clients and R$1.1 trillion AUM in 2024, driving fee compression and multi-homing. Institutional/HNW mandates negotiate bespoke fees, raising retention stakes. Education, UX and sticky credit/wealth services mitigate churn but require rapid feature velocity. Transparency and benchmarking tools increased switching after underperformance.
| Metric | 2024 | Implication |
|---|---|---|
| Clients | 7.8m | High buyer power |
| AUM | R$1.1T | Scale but not exclusivity |
| AUC | R$1.05T | Education lowers churn |
Same Document Delivered
XP Porter's Five Forces Analysis
This preview shows the exact XP Porter's Five Forces Analysis you'll receive immediately after purchase—no placeholders or samples. The document displayed here is the professionally written, fully formatted final file ready for download and use the moment you buy. You’re viewing the full deliverable; once payment is complete you’ll have instant access to this same document.
Original: $10.00
-65%$10.00
$3.50Description
A Must-Have Tool for Decision-Makers
XP’s Porter's Five Forces snapshot highlights competitive intensity, buyer and supplier leverage, barriers to entry, and substitute risks shaping its strategy and margins. This concise overview spotlights key vulnerabilities and advantages but omits detailed ratings, visuals, and scenario analysis. Unlock the full Porter's Five Forces Analysis for force-by-force scores, actionable implications, and presentation-ready deliverables. Purchase the complete report to inform smarter investment and strategic decisions.
Suppliers Bargaining Power
Dependence on B3 exchange
XP routes most equity trades through B3, the sole domestic securities exchange in Brazil in 2024, giving B3 strong leverage over fees, connectivity standards and market-data pricing. Alternative venues remain limited, constraining XP’s bargaining room despite volume-tier discounts and long-term contracts that can partially mitigate costs. Concentration risk is material: any B3 fee or rule change flows directly into XP’s unit economics.
Product shelf from asset managers
Fund houses and structured product issuers compete for placement on XP’s product shelf, limiting supplier pricing power despite XP’s distribution to millions of retail and HNW clients in 2024. XP’s scale makes it a must-have channel for many managers, yet top-performing or exclusive strategies can negotiate improved fee splits. Co-distribution and revenue-sharing remain recurring negotiation levers.
Market data and technology vendors
In 2024, market data, analytics and trading tech are concentrated among a few specialized providers, giving suppliers oligopolistic leverage. Switching vendors incurs significant cost, retraining and operational risk, which raises supplier power. Multi-vendor architectures and selective in-house builds reduce lock-in. Volume-based, multi-year contracts and tiered pricing often temper headline pricing power.
Clearing, custody, and payment rails
Clearing, custody and payment rails are highly regulated and concentrated, with the top five global custodians controlling roughly 70% of the custody market in 2024, giving providers structural leverage over fees and SLAs. Stringent reliability and compliance needs limit XP’s feasible alternatives, while scale improves negotiation but systemic dependencies remain. Any disruption can materially affect client experience and regulatory KPIs.
- Concentration: top-5 ≈70% (2024)
- Reliability: uptime & settlement SLAs critical
- Dependency: few alternative rails
- Impact: disruptions affect client NPS and regulatory metrics
Advisor and specialist talent
High-performing advisors and specialists are scarce and mobile, giving them strong bargaining power; XP reported roughly 15,000 advisors in 2024 and faces industry turnover near 10%, pushing up compensation and platform-investment costs. XP’s platform, brand and tools raise acquisition and retention expenses, while its training ecosystem supplies talent and partially offsets scarcity. Non-competes and culture lower but do not eliminate attrition risk.
- talent pool ≈15,000 (2024)
- turnover ≈10%
- higher comp and platform costs
- training offsets scarcity
- non-competes reduce but don't stop exits
2024 monopoly increases fee & data leverage; custodians hold ≈70%
B3's 2024 monopoly on domestic equities gives it outsized fee and data leverage over XP. Top-5 custodians hold ≈70% of custody, constraining alternative rails and SLAs. Market-data vendors are oligopolistic and switching is costly; talent pool ≈15,000 advisors with ≈10% turnover raises compensation pressure.
| Item | 2024 metric |
|---|---|
| B3 market position | sole domestic exchange |
| Custody concentration | Top‑5 ≈70% |
| Advisors | ≈15,000 (turnover ≈10%) |
What is included in the product
Detailed Word Document
Comprehensive Porter’s Five Forces analysis tailored for XP that uncovers competitive drivers, buyer and supplier power, entry barriers, substitutes and disruptive threats, evaluates pricing and profitability pressures, and is delivered in fully editable Word format for use in investor materials, strategy decks, business plans, or academic projects.
Customizable Excel Spreadsheet
A single-sheet XP Porter’s Five Forces summary with customizable pressure levels and an instant spider chart—simplifies strategic decision-making and slides, easy to edit and integrates into dashboards with no macros required.
Customers Bargaining Power
Price-sensitive retail investors
Brazilian retail clients routinely compare fees across apps, pressuring commissions, spreads and advisory fees downward; zero-commission equity and promotional pricing have amplified buyer power. By 2024 XP served over 5 million clients, forcing emphasis on non-price differentiation. XP leans on breadth of products, investor education and UX to justify fees, but churn risk rises sharply when performance or service quality dips.
Institutional and HNW negotiation
Larger institutional and HNW clients extract custom pricing, tailored service tiers and prioritized execution, leveraging mandate concentration to negotiate fee schedules and product access. XP must consistently deliver alpha, deep liquidity and institutional-grade reporting to retain share, as absence drives rapid mandate reallocation. Deep relationships and integrated solutions mitigate pure price pressure by increasing switching costs.
Low switching costs and multi-homing
Opening multiple accounts is easy, enabling clients to split flows across platforms; XP reported 7.8 million clients and R$1.1 trillion AUM in 2024, underscoring scale but not exclusivity. Multi-homing erodes loyalty and strengthens buyer leverage in promos and rates, driving price-sensitive flows. XP invests in integrated journeys to raise switching frictions. Sticky services like wealth planning and credit increase lifetime value.
Demand for education and UX
Clients demand robust educational content, advanced tools and seamless mobile UX; failure to deliver prompts threats to move assets. XP’s education moat reduces pure price-based churn and supported R$1.05 trillion AUC in 2024, limiting pure price comparisons. Continuous feature velocity is required to sustain perceived value as mobile interaction dominates investor activity.
- Clients expect mobile-first experiences
- Education lowers price sensitivity
- Feature velocity = retention
Product transparency and regulation
Enhanced 2024 disclosures have made fees and risks far clearer, empowering buyers and accelerating fee-sensitive switching; benchmark platforms (Morningstar, ANBIMA tools) intensified comparison shopping. XP must craft outcome-based narratives to defend margins as underperformance sparks renegotiation or rapid outflows, seen in quarterly client flows after missed targets. Transparency raises bargaining leverage for customers.
Brazilian investors: 7.8m, R$1.1T AUM pressures fees
Brazilian clients wield strong price leverage: XP had 7.8 million clients and R$1.1 trillion AUM in 2024, driving fee compression and multi-homing. Institutional/HNW mandates negotiate bespoke fees, raising retention stakes. Education, UX and sticky credit/wealth services mitigate churn but require rapid feature velocity. Transparency and benchmarking tools increased switching after underperformance.
| Metric | 2024 | Implication |
|---|---|---|
| Clients | 7.8m | High buyer power |
| AUM | R$1.1T | Scale but not exclusivity |
| AUC | R$1.05T | Education lowers churn |
Same Document Delivered
XP Porter's Five Forces Analysis
This preview shows the exact XP Porter's Five Forces Analysis you'll receive immediately after purchase—no placeholders or samples. The document displayed here is the professionally written, fully formatted final file ready for download and use the moment you buy. You’re viewing the full deliverable; once payment is complete you’ll have instant access to this same document.











