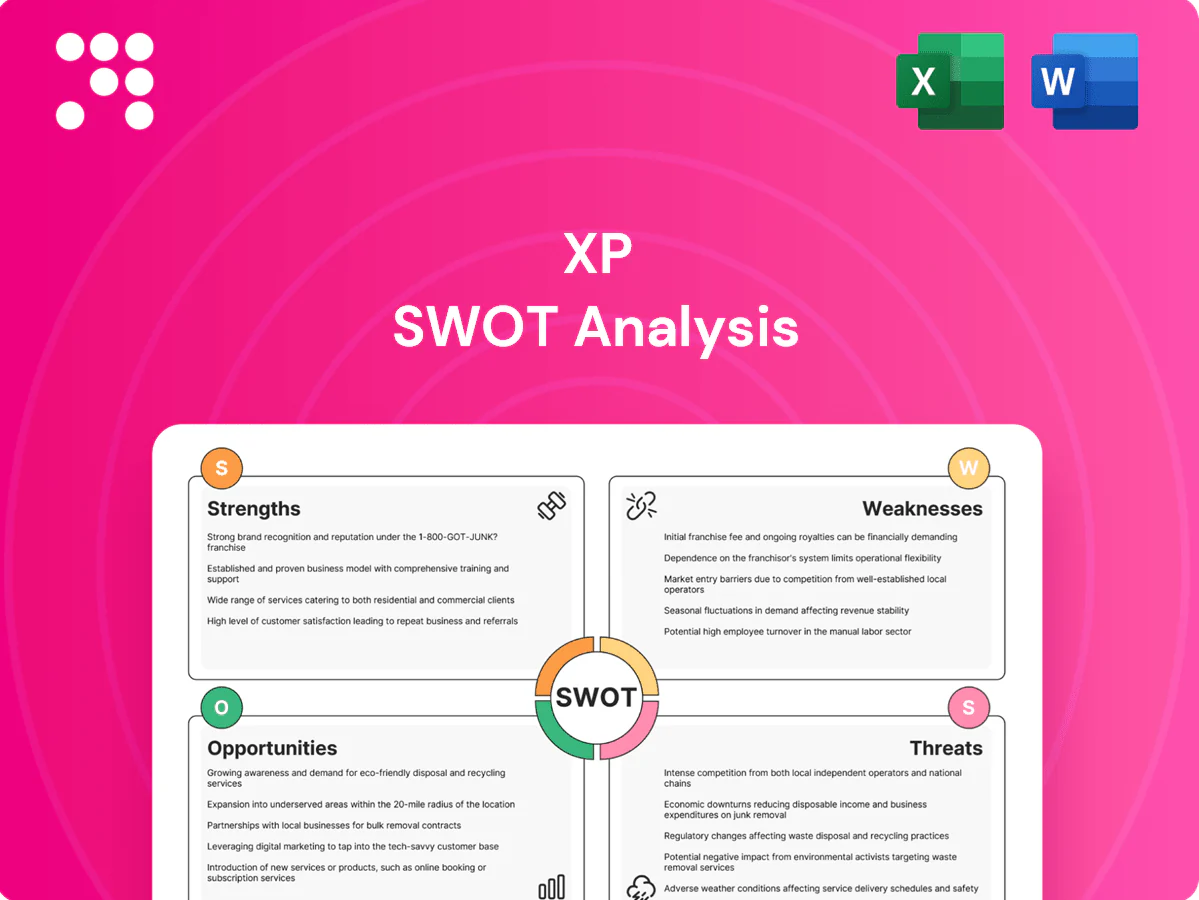
XP SWOT Analysis

Go Beyond the Preview—Access the Full Strategic Report
Uncover XP’s competitive edge, market risks, and growth levers with our concise SWOT preview—insightful, data-driven, and ready to inform strategy. For the full, editable analysis with expert commentary, financial context, and Excel tools, purchase the complete SWOT to plan, pitch, or invest with confidence.
Strengths

Dominant multi-asset brokerage platform
XP’s broad product shelf across equities, fixed income, funds, alternatives and structured notes drives both retail and institutional flows, supporting over 3 million clients and roughly R$1 trillion in assets under custody (AUC) by 2024.
Seamless digital execution, robust research and portfolio tools increase engagement and wallet share, with digital trading volumes and advisory uptake fueling higher revenue per client.
Integrated custody, reporting and advisory create high platform stickiness, while scale advantages lower unit costs and enhance pricing power.
Extensive distribution via independent advisors
XP’s nationwide network of over 8,000 independent investment agents expands client acquisition beyond bank channels, reaching diverse regions and driving recorded retail client growth to roughly 3.5 million accounts; advisor productivity programs, commission incentives and continuous training increase cross‑selling and AUM per client, while localized presence builds trust across heterogeneous markets and keeps expansion costs largely variable and scalable.

Strong brand and investor education ecosystem
XP is widely recognized in Brazil as a champion of financial literacy and open-architecture investing, with over R$1 trillion in assets under custody and more than 5 million clients as of 2024; its content, online courses and events onboard first-time investors and upgrade them into active users. Education-driven engagement measurably reduces churn, raises cross-sell rates and lowers acquisition costs, while the brand halo boosts uptake of premium wealth and private markets offerings.

Diversified revenue streams beyond brokerage
Technology and data-driven scalability
XP’s cloud-native, API-first stack enables rapid product launches and seamless integrations, supporting its multi-product platform and expanding partner ecosystem. Advanced analytics power personalization, fraud/risk detection and compliance monitoring, processing vast transaction data to sharpen suitability and retention. Automation in digital onboarding, suitability checks and back-office drives operating leverage; robust cyber investments and enterprise-grade uptime underpin client trust.
- Clients ~4.8M (2024)
- AUM/Custody >R$1.3T (2024)
- API-first, cloud-native platform
- Automation reduces manual ops, boosts scalability
- Enterprise cyber/up-time investments
Multi-asset open-architecture platform — ~4.8M clients, BRL 1.3T, 8,000 agents
XP’s multi-asset platform and open‑architecture distribution (advisory, AUM, credit, banking) drive diversified fee pools and cross‑sell, reducing cyclical brokerage exposure. Scale and reach—~4.8M clients and ~BRL 1.3T AUA (mid‑2025)—boost margin and pricing power while lowering unit costs. Cloud‑native, API‑first stack plus education and an 8,000‑agent network deepen engagement and retention.
| Metric | Value |
|---|---|
| Clients | ~4.8M (2024) |
| AUA/AUC | ~BRL 1.3T (mid‑2025) |
| Agents | ~8,000 |
What is included in the product
 Detailed Word Document
Delivers a strategic overview of XP’s internal and external business factors, outlining strengths, weaknesses, opportunities, and threats to assess its competitive position and future risks.

 Customizable Excel Spreadsheet
Identifies XP pain points and maps them to targeted strengths, weaknesses, opportunities and threats for rapid remediation. Editable, visual format enables fast updates and cross-team alignment for immediate action.
Weaknesses

Exposure to Brazilian macro volatility
XP is highly sensitive to Brazilian macro swings: changes in the Selic rate (which peaked at 13.75% in 2023) and inflation cycles alter deposit flows, credit demand and trading volumes. Revenue remains concentrated in Brazil—over 90% of net revenue is generated domestically—creating concentration risk tied to local market activity. Risk-off periods compress trading activity and IPO/ECM fees, and episodic political cycles can sharply depress volumes. That drives greater earnings volatility versus globally diversified peers.
Dependence on third-party product providers
Dependence on external asset managers and issuers means a large portion of XP’s shelf is supplied by third parties, exposing revenue to fee changes and distribution re-prioritization. Margin compression can occur if manufacturers cut fees or steer products elsewhere. This reliance creates potential conflicts and raises due diligence burdens around product quality and governance. XP has limited control over underlying asset performance and tail risks.

Regulatory complexity of advisor network
Independent agents—which Cerulli Group reported as roughly 48% of the US advisor channel in 2024—create compliance risks around suitability and best-interest rules (SEC Reg BI in force since 2020), forcing higher supervision, training and surveillance spend. Misconduct at point of sale carries material reputational and enforcement exposure as SEC/FINRA actions stayed elevated through 2023–24. Operational frictions spike when rules tighten or documentation demands increase, slowing sales and raising processing costs.

Competition from incumbent banks and fintechs
Competition from incumbent banks and scaling neobrokers is compressing fees and intensifying marketing as platforms upgrade; bundled banking perks, credit and loyalty programs are actively used to poach clients, raising expectations for zero-commission trading and high-yield cash, and forcing higher retention spend that worsens unit economics.
- Price compression
- Client poaching via bundles
- Zero-commission demand
- Higher retention costs
Concentration in home market and currency
- revenue concentration: ~90% Brazil (2024)
- currency exposure: BRL vs USD risk for foreign investors
- limited geographic diversification vs global peers
- cross‑border access and advisor‑led scale barriers
Brazil concentration ~90%, Selic volatility (13.75%) pressures margins
High Brazil concentration (~90% of net revenue in 2024) and BRL exposure raise country and FX risk; macro swings (Selic peaked 13.75% in 2023) materially affect flows. Heavy reliance on third‑party product distribution and advisor-led sales compresses margins and raises supervision costs. Intense competition and fee compression force higher retention spend and earnings volatility.
| Metric | Value | Impact |
|---|---|---|
| Revenue concentration | ~90% Brazil (2024) | Concentration risk |
| Selic peak | 13.75% (2023) | Flow volatility |
Preview the Actual Deliverable
XP SWOT Analysis
This is the actual SWOT analysis document you’ll receive upon purchase—no surprises, just professional quality. The preview below is taken directly from the full SWOT report you'll get; purchase unlocks the entire in-depth, editable version. You're viewing a live excerpt of the complete file and will download the full document immediately after checkout.

Go Beyond the Preview—Access the Full Strategic Report
Uncover XP’s competitive edge, market risks, and growth levers with our concise SWOT preview—insightful, data-driven, and ready to inform strategy. For the full, editable analysis with expert commentary, financial context, and Excel tools, purchase the complete SWOT to plan, pitch, or invest with confidence.
Strengths
Dominant multi-asset brokerage platform
XP’s broad product shelf across equities, fixed income, funds, alternatives and structured notes drives both retail and institutional flows, supporting over 3 million clients and roughly R$1 trillion in assets under custody (AUC) by 2024.
Seamless digital execution, robust research and portfolio tools increase engagement and wallet share, with digital trading volumes and advisory uptake fueling higher revenue per client.
Integrated custody, reporting and advisory create high platform stickiness, while scale advantages lower unit costs and enhance pricing power.
Extensive distribution via independent advisors
XP’s nationwide network of over 8,000 independent investment agents expands client acquisition beyond bank channels, reaching diverse regions and driving recorded retail client growth to roughly 3.5 million accounts; advisor productivity programs, commission incentives and continuous training increase cross‑selling and AUM per client, while localized presence builds trust across heterogeneous markets and keeps expansion costs largely variable and scalable.
Strong brand and investor education ecosystem
XP is widely recognized in Brazil as a champion of financial literacy and open-architecture investing, with over R$1 trillion in assets under custody and more than 5 million clients as of 2024; its content, online courses and events onboard first-time investors and upgrade them into active users. Education-driven engagement measurably reduces churn, raises cross-sell rates and lowers acquisition costs, while the brand halo boosts uptake of premium wealth and private markets offerings.
Diversified revenue streams beyond brokerage
Technology and data-driven scalability
XP’s cloud-native, API-first stack enables rapid product launches and seamless integrations, supporting its multi-product platform and expanding partner ecosystem. Advanced analytics power personalization, fraud/risk detection and compliance monitoring, processing vast transaction data to sharpen suitability and retention. Automation in digital onboarding, suitability checks and back-office drives operating leverage; robust cyber investments and enterprise-grade uptime underpin client trust.
- Clients ~4.8M (2024)
- AUM/Custody >R$1.3T (2024)
- API-first, cloud-native platform
- Automation reduces manual ops, boosts scalability
- Enterprise cyber/up-time investments
Multi-asset open-architecture platform — ~4.8M clients, BRL 1.3T, 8,000 agents
XP’s multi-asset platform and open‑architecture distribution (advisory, AUM, credit, banking) drive diversified fee pools and cross‑sell, reducing cyclical brokerage exposure. Scale and reach—~4.8M clients and ~BRL 1.3T AUA (mid‑2025)—boost margin and pricing power while lowering unit costs. Cloud‑native, API‑first stack plus education and an 8,000‑agent network deepen engagement and retention.
| Metric | Value |
|---|---|
| Clients | ~4.8M (2024) |
| AUA/AUC | ~BRL 1.3T (mid‑2025) |
| Agents | ~8,000 |
What is included in the product
Detailed Word Document
Delivers a strategic overview of XP’s internal and external business factors, outlining strengths, weaknesses, opportunities, and threats to assess its competitive position and future risks.
Customizable Excel Spreadsheet
Identifies XP pain points and maps them to targeted strengths, weaknesses, opportunities and threats for rapid remediation. Editable, visual format enables fast updates and cross-team alignment for immediate action.
Weaknesses
Exposure to Brazilian macro volatility
XP is highly sensitive to Brazilian macro swings: changes in the Selic rate (which peaked at 13.75% in 2023) and inflation cycles alter deposit flows, credit demand and trading volumes. Revenue remains concentrated in Brazil—over 90% of net revenue is generated domestically—creating concentration risk tied to local market activity. Risk-off periods compress trading activity and IPO/ECM fees, and episodic political cycles can sharply depress volumes. That drives greater earnings volatility versus globally diversified peers.
Dependence on third-party product providers
Dependence on external asset managers and issuers means a large portion of XP’s shelf is supplied by third parties, exposing revenue to fee changes and distribution re-prioritization. Margin compression can occur if manufacturers cut fees or steer products elsewhere. This reliance creates potential conflicts and raises due diligence burdens around product quality and governance. XP has limited control over underlying asset performance and tail risks.
Regulatory complexity of advisor network
Independent agents—which Cerulli Group reported as roughly 48% of the US advisor channel in 2024—create compliance risks around suitability and best-interest rules (SEC Reg BI in force since 2020), forcing higher supervision, training and surveillance spend. Misconduct at point of sale carries material reputational and enforcement exposure as SEC/FINRA actions stayed elevated through 2023–24. Operational frictions spike when rules tighten or documentation demands increase, slowing sales and raising processing costs.
Competition from incumbent banks and fintechs
Competition from incumbent banks and scaling neobrokers is compressing fees and intensifying marketing as platforms upgrade; bundled banking perks, credit and loyalty programs are actively used to poach clients, raising expectations for zero-commission trading and high-yield cash, and forcing higher retention spend that worsens unit economics.
- Price compression
- Client poaching via bundles
- Zero-commission demand
- Higher retention costs
Concentration in home market and currency
- revenue concentration: ~90% Brazil (2024)
- currency exposure: BRL vs USD risk for foreign investors
- limited geographic diversification vs global peers
- cross‑border access and advisor‑led scale barriers
Brazil concentration ~90%, Selic volatility (13.75%) pressures margins
High Brazil concentration (~90% of net revenue in 2024) and BRL exposure raise country and FX risk; macro swings (Selic peaked 13.75% in 2023) materially affect flows. Heavy reliance on third‑party product distribution and advisor-led sales compresses margins and raises supervision costs. Intense competition and fee compression force higher retention spend and earnings volatility.
| Metric | Value | Impact |
|---|---|---|
| Revenue concentration | ~90% Brazil (2024) | Concentration risk |
| Selic peak | 13.75% (2023) | Flow volatility |
Preview the Actual Deliverable
XP SWOT Analysis
This is the actual SWOT analysis document you’ll receive upon purchase—no surprises, just professional quality. The preview below is taken directly from the full SWOT report you'll get; purchase unlocks the entire in-depth, editable version. You're viewing a live excerpt of the complete file and will download the full document immediately after checkout.
Original: $10.00
-65%$10.00
$3.50Description
Go Beyond the Preview—Access the Full Strategic Report
Uncover XP’s competitive edge, market risks, and growth levers with our concise SWOT preview—insightful, data-driven, and ready to inform strategy. For the full, editable analysis with expert commentary, financial context, and Excel tools, purchase the complete SWOT to plan, pitch, or invest with confidence.
Strengths
Dominant multi-asset brokerage platform
XP’s broad product shelf across equities, fixed income, funds, alternatives and structured notes drives both retail and institutional flows, supporting over 3 million clients and roughly R$1 trillion in assets under custody (AUC) by 2024.
Seamless digital execution, robust research and portfolio tools increase engagement and wallet share, with digital trading volumes and advisory uptake fueling higher revenue per client.
Integrated custody, reporting and advisory create high platform stickiness, while scale advantages lower unit costs and enhance pricing power.
Extensive distribution via independent advisors
XP’s nationwide network of over 8,000 independent investment agents expands client acquisition beyond bank channels, reaching diverse regions and driving recorded retail client growth to roughly 3.5 million accounts; advisor productivity programs, commission incentives and continuous training increase cross‑selling and AUM per client, while localized presence builds trust across heterogeneous markets and keeps expansion costs largely variable and scalable.
Strong brand and investor education ecosystem
XP is widely recognized in Brazil as a champion of financial literacy and open-architecture investing, with over R$1 trillion in assets under custody and more than 5 million clients as of 2024; its content, online courses and events onboard first-time investors and upgrade them into active users. Education-driven engagement measurably reduces churn, raises cross-sell rates and lowers acquisition costs, while the brand halo boosts uptake of premium wealth and private markets offerings.
Diversified revenue streams beyond brokerage
Technology and data-driven scalability
XP’s cloud-native, API-first stack enables rapid product launches and seamless integrations, supporting its multi-product platform and expanding partner ecosystem. Advanced analytics power personalization, fraud/risk detection and compliance monitoring, processing vast transaction data to sharpen suitability and retention. Automation in digital onboarding, suitability checks and back-office drives operating leverage; robust cyber investments and enterprise-grade uptime underpin client trust.
- Clients ~4.8M (2024)
- AUM/Custody >R$1.3T (2024)
- API-first, cloud-native platform
- Automation reduces manual ops, boosts scalability
- Enterprise cyber/up-time investments
Multi-asset open-architecture platform — ~4.8M clients, BRL 1.3T, 8,000 agents
XP’s multi-asset platform and open‑architecture distribution (advisory, AUM, credit, banking) drive diversified fee pools and cross‑sell, reducing cyclical brokerage exposure. Scale and reach—~4.8M clients and ~BRL 1.3T AUA (mid‑2025)—boost margin and pricing power while lowering unit costs. Cloud‑native, API‑first stack plus education and an 8,000‑agent network deepen engagement and retention.
| Metric | Value |
|---|---|
| Clients | ~4.8M (2024) |
| AUA/AUC | ~BRL 1.3T (mid‑2025) |
| Agents | ~8,000 |
What is included in the product
Detailed Word Document
Delivers a strategic overview of XP’s internal and external business factors, outlining strengths, weaknesses, opportunities, and threats to assess its competitive position and future risks.
Customizable Excel Spreadsheet
Identifies XP pain points and maps them to targeted strengths, weaknesses, opportunities and threats for rapid remediation. Editable, visual format enables fast updates and cross-team alignment for immediate action.
Weaknesses
Exposure to Brazilian macro volatility
XP is highly sensitive to Brazilian macro swings: changes in the Selic rate (which peaked at 13.75% in 2023) and inflation cycles alter deposit flows, credit demand and trading volumes. Revenue remains concentrated in Brazil—over 90% of net revenue is generated domestically—creating concentration risk tied to local market activity. Risk-off periods compress trading activity and IPO/ECM fees, and episodic political cycles can sharply depress volumes. That drives greater earnings volatility versus globally diversified peers.
Dependence on third-party product providers
Dependence on external asset managers and issuers means a large portion of XP’s shelf is supplied by third parties, exposing revenue to fee changes and distribution re-prioritization. Margin compression can occur if manufacturers cut fees or steer products elsewhere. This reliance creates potential conflicts and raises due diligence burdens around product quality and governance. XP has limited control over underlying asset performance and tail risks.
Regulatory complexity of advisor network
Independent agents—which Cerulli Group reported as roughly 48% of the US advisor channel in 2024—create compliance risks around suitability and best-interest rules (SEC Reg BI in force since 2020), forcing higher supervision, training and surveillance spend. Misconduct at point of sale carries material reputational and enforcement exposure as SEC/FINRA actions stayed elevated through 2023–24. Operational frictions spike when rules tighten or documentation demands increase, slowing sales and raising processing costs.
Competition from incumbent banks and fintechs
Competition from incumbent banks and scaling neobrokers is compressing fees and intensifying marketing as platforms upgrade; bundled banking perks, credit and loyalty programs are actively used to poach clients, raising expectations for zero-commission trading and high-yield cash, and forcing higher retention spend that worsens unit economics.
- Price compression
- Client poaching via bundles
- Zero-commission demand
- Higher retention costs
Concentration in home market and currency
- revenue concentration: ~90% Brazil (2024)
- currency exposure: BRL vs USD risk for foreign investors
- limited geographic diversification vs global peers
- cross‑border access and advisor‑led scale barriers
Brazil concentration ~90%, Selic volatility (13.75%) pressures margins
High Brazil concentration (~90% of net revenue in 2024) and BRL exposure raise country and FX risk; macro swings (Selic peaked 13.75% in 2023) materially affect flows. Heavy reliance on third‑party product distribution and advisor-led sales compresses margins and raises supervision costs. Intense competition and fee compression force higher retention spend and earnings volatility.
| Metric | Value | Impact |
|---|---|---|
| Revenue concentration | ~90% Brazil (2024) | Concentration risk |
| Selic peak | 13.75% (2023) | Flow volatility |
Preview the Actual Deliverable
XP SWOT Analysis
This is the actual SWOT analysis document you’ll receive upon purchase—no surprises, just professional quality. The preview below is taken directly from the full SWOT report you'll get; purchase unlocks the entire in-depth, editable version. You're viewing a live excerpt of the complete file and will download the full document immediately after checkout.











