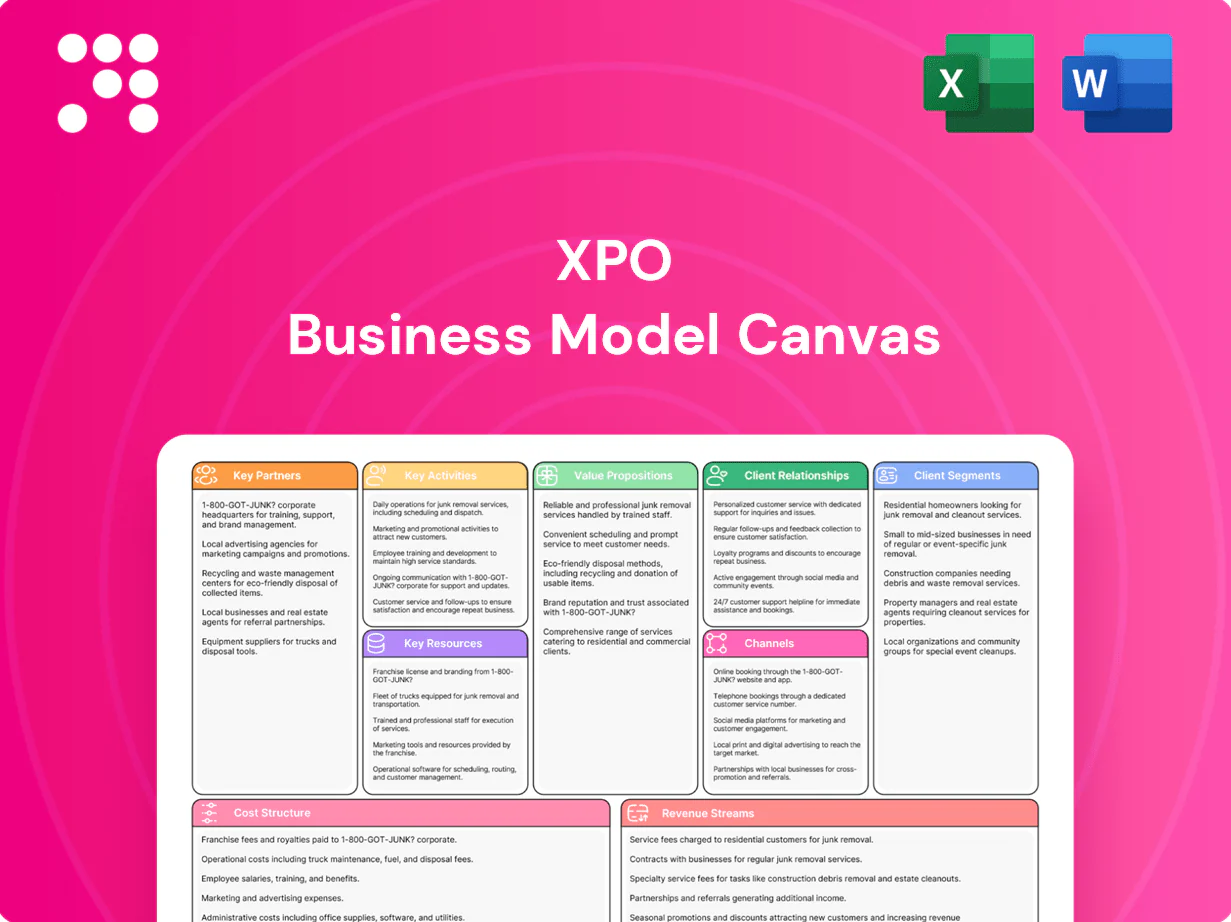
XPO Business Model Canvas

Discover a concise, actionable Business Model Canvas for investors and strategists
Discover XPO's Business Model Canvas—concise, actionable mapping of its value propositions, customer segments, channels and revenue drivers. Perfect for investors, consultants, and founders seeking strategic clarity. Download the full canvas for section-by-section insights and editable Word/Excel files. Turn analysis into competitive advantage today.
Partnerships

OEMs and Equipment Leasing
Partnerships with tractor, trailer and forklift OEMs plus leasing firms secure access to modern, fuel-efficient equipment and flexible financing. Service agreements in 2024 (fleet refresh cycles averaging 3–5 years) reduce downtime and stabilize maintenance costs. These relationships underpin network reliability and improve cost predictability for XPO’s operations.
Technology and Telemetry Vendors
Technology and telemetry vendors—TMS, routing, telematics and visibility platforms—are integrated into XPO operations, supplying APIs, ELDs, sensors and analytics tools to optimize linehaul and P&D. The US ELD mandate (implemented December 2017) underpins widespread fleet connectivity, while co-development drives real-time tracking and predictive ETAs. These alliances accelerate innovation and enhance customer visibility.

Interline and Regional Carrier Partners
Interline and regional LTL agreements extend XPOs geographic reach, enabling coverage to secondary markets and off-network lanes that together span roughly 95% of US ZIP codes; reciprocal volume from partners helps keep unit costs down and utilization high (often improving trailer fill by ~8–12%). Service-level alignment preserves transit times and damage standards across the combined network, balancing flows and capacity regionally.

Cross-Border and Customs Brokers
Cross-border customs brokers clear regulatory requirements for U.S.-Canada-Mexico moves, handling duties, paperwork and security filings to support XPO’s cross-border lanes. Integrated ACE/ABI data flows (ACE processes over 95% of commercial entries) reduce border exceptions and delays, enabling predictable transit across borders for shippers amid North American merchandise trade exceeding $4 trillion in 2023.
- Role: customs clearance, duties, security filings
- Data: ACE >95% commercial entry processing
- Impact: fewer exceptions, more predictable transit
Fuel, Maintenance, and Facility Providers
Fuel, maintenance and facility partners span fuel suppliers, tire and parts vendors, third-party shops and landlords for terminals; volume purchasing stabilizes input costs and ensures availability. With US diesel averaging about 4.00 USD/gal in 2024 (EIA), on-site and mobile maintenance shorten repair cycles and reduce downtime, while facility partners enable scalable cross-dock operations in key markets.
- Volume buying: stabilizes pricing and supply
- On-site/mobile maintenance: faster turnarounds, less downtime
- Third-party shops: cost-effective specialty repairs
- Real estate partners: scalable cross-dock capacity in priority hubs
Carrier partners, tech and customs align to stabilize costs, improve reach and reliability
XPO partners with OEMs/leasing firms (fleet refresh 3–5 yrs), tech vendors (ELD mandate, real‑time visibility), interline LTLs (reach ~95% US ZIPs, +8–12% trailer fill) and customs brokers (ACE >95% entries) to stabilize costs and ensure reliability; fuel/maintenance partners mitigate input volatility (US diesel ≈ $4.00/gal in 2024).
| Partner | Metric | 2024 |
|---|---|---|
| Geographic reach | US ZIP coverage | ~95% |
| Trailer fill | Improvement | +8–12% |
| Diesel | Avg price | $4.00/gal |
What is included in the product
 Detailed Word Document
A comprehensive Business Model Canvas tailored to XPO's logistics and transportation strategy, covering customer segments, channels, value propositions, key activities, partners, resources, cost structure and revenue streams across the 9 classic blocks. Ideal for presentations and investor discussions, it includes competitive advantage analysis, SWOT-linked insights and practical validation using real company operations.

 Customizable Excel Spreadsheet
High-level view of XPO's business model with editable cells that simplify complex logistics and permit quick alignment across teams. Shareable, boardroom-ready layout that saves hours and helps compare strategic options side-by-side.
Activities

Linehaul and P&D Operations
Linehaul and P&D operations coordinate long‑haul scheduling with local pickup-and-delivery to balance trailer loads, cube and routing for service and cost. In 2024 XPO emphasized reducing empty miles and dwell through dynamic routing and cross‑dock balancing to boost trailer utilization. Execution of these plans directly drives on‑time performance and overall network efficiency.
Cross-Dock and Terminal Management
Cross-dock and terminal management at XPO focuses on sorting, consolidation and deconsolidation of freight across over 300 service centers in North America and Europe, using standardized processes that materially reduce misloads and damage. Dock planning synchronizes labor with trailer flow to smooth peak throughput. This capability underpins transit-time reliability and supports on-time performance targets above 90% reported in 2024.

Network Planning and Optimization
Network planning models lanes, bidirectional flows and break-bulk routing so algorithms can generate load plans and relays that maximize asset utilization and reduce empty miles. Seasonal peaks of up to 30% in e-commerce volume require demand-driven adjustments to preserve on-time service. Continuous improvement programs have driven year-over-year unit cost per hundredweight reductions of about 5%, improving margin on high-density lanes.

Customer Service and Shipment Visibility
Customer service and shipment visibility provide tracking, exceptions handling, and proactive notifications, with agents and digital tools managing inquiries and changes. Real-time ETAs reduce friction for shippers and improve scheduling. Strong service drives retention and wallet share; XPO reported roughly $13.0 billion revenue in 2024, reflecting commercial strength.
- Tracking, exceptions, proactive alerts
- Agents + digital tools for inquiries
- Real-time ETAs cut operational friction
- Service boosts retention & wallet share
Pricing, Yield, and Compliance Management
Pricing, yield, and compliance set tariffs, contracts, discounts, and accessorials to hit margin targets; XPO reported 2024 revenue above $10B supporting scale in price leverage. Yield management aligns product mix with capacity constraints to protect utilization and drive 3–5% pricing lift. Safety and regulatory compliance shield operations and reputation. Data-led governance enforces consistent, profitable decisions.
- Tariffs & contracts
- Yield vs capacity
- Safety & compliance
- Data governance
Ops cut empty miles: $13.0B, >90%, ~5%
Linehaul, P&D and cross-dock ops optimize routing, reduce empty miles and drove ~5% unit cost/HC improvement in 2024. Network planning across 300+ service centers sustained >90% on-time performance, handling seasonal e-commerce spikes up to 30%. Customer visibility, pricing and compliance preserved yield and supported ~$13.0B revenue in 2024.
| Metric | 2024 |
|---|---|
| Revenue | $13.0B |
| Service centers | 300+ |
| On-time | >90% |
| Unit cost ↓ | ~5% |
What You See Is What You Get
Business Model Canvas
The document previewed here is the actual XPO Business Model Canvas you will receive—it's not a mockup. Upon purchase you'll download this exact, fully editable file formatted for immediate use in Word and Excel. What you see is the complete deliverable, ready to present, edit, and implement.

Discover a concise, actionable Business Model Canvas for investors and strategists
Discover XPO's Business Model Canvas—concise, actionable mapping of its value propositions, customer segments, channels and revenue drivers. Perfect for investors, consultants, and founders seeking strategic clarity. Download the full canvas for section-by-section insights and editable Word/Excel files. Turn analysis into competitive advantage today.
Partnerships
OEMs and Equipment Leasing
Partnerships with tractor, trailer and forklift OEMs plus leasing firms secure access to modern, fuel-efficient equipment and flexible financing. Service agreements in 2024 (fleet refresh cycles averaging 3–5 years) reduce downtime and stabilize maintenance costs. These relationships underpin network reliability and improve cost predictability for XPO’s operations.
Technology and Telemetry Vendors
Technology and telemetry vendors—TMS, routing, telematics and visibility platforms—are integrated into XPO operations, supplying APIs, ELDs, sensors and analytics tools to optimize linehaul and P&D. The US ELD mandate (implemented December 2017) underpins widespread fleet connectivity, while co-development drives real-time tracking and predictive ETAs. These alliances accelerate innovation and enhance customer visibility.
Interline and Regional Carrier Partners
Interline and regional LTL agreements extend XPOs geographic reach, enabling coverage to secondary markets and off-network lanes that together span roughly 95% of US ZIP codes; reciprocal volume from partners helps keep unit costs down and utilization high (often improving trailer fill by ~8–12%). Service-level alignment preserves transit times and damage standards across the combined network, balancing flows and capacity regionally.
Cross-Border and Customs Brokers
Cross-border customs brokers clear regulatory requirements for U.S.-Canada-Mexico moves, handling duties, paperwork and security filings to support XPO’s cross-border lanes. Integrated ACE/ABI data flows (ACE processes over 95% of commercial entries) reduce border exceptions and delays, enabling predictable transit across borders for shippers amid North American merchandise trade exceeding $4 trillion in 2023.
- Role: customs clearance, duties, security filings
- Data: ACE >95% commercial entry processing
- Impact: fewer exceptions, more predictable transit
Fuel, Maintenance, and Facility Providers
Fuel, maintenance and facility partners span fuel suppliers, tire and parts vendors, third-party shops and landlords for terminals; volume purchasing stabilizes input costs and ensures availability. With US diesel averaging about 4.00 USD/gal in 2024 (EIA), on-site and mobile maintenance shorten repair cycles and reduce downtime, while facility partners enable scalable cross-dock operations in key markets.
- Volume buying: stabilizes pricing and supply
- On-site/mobile maintenance: faster turnarounds, less downtime
- Third-party shops: cost-effective specialty repairs
- Real estate partners: scalable cross-dock capacity in priority hubs
Carrier partners, tech and customs align to stabilize costs, improve reach and reliability
XPO partners with OEMs/leasing firms (fleet refresh 3–5 yrs), tech vendors (ELD mandate, real‑time visibility), interline LTLs (reach ~95% US ZIPs, +8–12% trailer fill) and customs brokers (ACE >95% entries) to stabilize costs and ensure reliability; fuel/maintenance partners mitigate input volatility (US diesel ≈ $4.00/gal in 2024).
| Partner | Metric | 2024 |
|---|---|---|
| Geographic reach | US ZIP coverage | ~95% |
| Trailer fill | Improvement | +8–12% |
| Diesel | Avg price | $4.00/gal |
What is included in the product
Detailed Word Document
A comprehensive Business Model Canvas tailored to XPO's logistics and transportation strategy, covering customer segments, channels, value propositions, key activities, partners, resources, cost structure and revenue streams across the 9 classic blocks. Ideal for presentations and investor discussions, it includes competitive advantage analysis, SWOT-linked insights and practical validation using real company operations.
Customizable Excel Spreadsheet
High-level view of XPO's business model with editable cells that simplify complex logistics and permit quick alignment across teams. Shareable, boardroom-ready layout that saves hours and helps compare strategic options side-by-side.
Activities
Linehaul and P&D Operations
Linehaul and P&D operations coordinate long‑haul scheduling with local pickup-and-delivery to balance trailer loads, cube and routing for service and cost. In 2024 XPO emphasized reducing empty miles and dwell through dynamic routing and cross‑dock balancing to boost trailer utilization. Execution of these plans directly drives on‑time performance and overall network efficiency.
Cross-Dock and Terminal Management
Cross-dock and terminal management at XPO focuses on sorting, consolidation and deconsolidation of freight across over 300 service centers in North America and Europe, using standardized processes that materially reduce misloads and damage. Dock planning synchronizes labor with trailer flow to smooth peak throughput. This capability underpins transit-time reliability and supports on-time performance targets above 90% reported in 2024.
Network Planning and Optimization
Network planning models lanes, bidirectional flows and break-bulk routing so algorithms can generate load plans and relays that maximize asset utilization and reduce empty miles. Seasonal peaks of up to 30% in e-commerce volume require demand-driven adjustments to preserve on-time service. Continuous improvement programs have driven year-over-year unit cost per hundredweight reductions of about 5%, improving margin on high-density lanes.
Customer Service and Shipment Visibility
Customer service and shipment visibility provide tracking, exceptions handling, and proactive notifications, with agents and digital tools managing inquiries and changes. Real-time ETAs reduce friction for shippers and improve scheduling. Strong service drives retention and wallet share; XPO reported roughly $13.0 billion revenue in 2024, reflecting commercial strength.
- Tracking, exceptions, proactive alerts
- Agents + digital tools for inquiries
- Real-time ETAs cut operational friction
- Service boosts retention & wallet share
Pricing, Yield, and Compliance Management
Pricing, yield, and compliance set tariffs, contracts, discounts, and accessorials to hit margin targets; XPO reported 2024 revenue above $10B supporting scale in price leverage. Yield management aligns product mix with capacity constraints to protect utilization and drive 3–5% pricing lift. Safety and regulatory compliance shield operations and reputation. Data-led governance enforces consistent, profitable decisions.
- Tariffs & contracts
- Yield vs capacity
- Safety & compliance
- Data governance
Ops cut empty miles: $13.0B, >90%, ~5%
Linehaul, P&D and cross-dock ops optimize routing, reduce empty miles and drove ~5% unit cost/HC improvement in 2024. Network planning across 300+ service centers sustained >90% on-time performance, handling seasonal e-commerce spikes up to 30%. Customer visibility, pricing and compliance preserved yield and supported ~$13.0B revenue in 2024.
| Metric | 2024 |
|---|---|
| Revenue | $13.0B |
| Service centers | 300+ |
| On-time | >90% |
| Unit cost ↓ | ~5% |
What You See Is What You Get
Business Model Canvas
The document previewed here is the actual XPO Business Model Canvas you will receive—it's not a mockup. Upon purchase you'll download this exact, fully editable file formatted for immediate use in Word and Excel. What you see is the complete deliverable, ready to present, edit, and implement.
Description
Discover a concise, actionable Business Model Canvas for investors and strategists
Discover XPO's Business Model Canvas—concise, actionable mapping of its value propositions, customer segments, channels and revenue drivers. Perfect for investors, consultants, and founders seeking strategic clarity. Download the full canvas for section-by-section insights and editable Word/Excel files. Turn analysis into competitive advantage today.
Partnerships
OEMs and Equipment Leasing
Partnerships with tractor, trailer and forklift OEMs plus leasing firms secure access to modern, fuel-efficient equipment and flexible financing. Service agreements in 2024 (fleet refresh cycles averaging 3–5 years) reduce downtime and stabilize maintenance costs. These relationships underpin network reliability and improve cost predictability for XPO’s operations.
Technology and Telemetry Vendors
Technology and telemetry vendors—TMS, routing, telematics and visibility platforms—are integrated into XPO operations, supplying APIs, ELDs, sensors and analytics tools to optimize linehaul and P&D. The US ELD mandate (implemented December 2017) underpins widespread fleet connectivity, while co-development drives real-time tracking and predictive ETAs. These alliances accelerate innovation and enhance customer visibility.
Interline and Regional Carrier Partners
Interline and regional LTL agreements extend XPOs geographic reach, enabling coverage to secondary markets and off-network lanes that together span roughly 95% of US ZIP codes; reciprocal volume from partners helps keep unit costs down and utilization high (often improving trailer fill by ~8–12%). Service-level alignment preserves transit times and damage standards across the combined network, balancing flows and capacity regionally.
Cross-Border and Customs Brokers
Cross-border customs brokers clear regulatory requirements for U.S.-Canada-Mexico moves, handling duties, paperwork and security filings to support XPO’s cross-border lanes. Integrated ACE/ABI data flows (ACE processes over 95% of commercial entries) reduce border exceptions and delays, enabling predictable transit across borders for shippers amid North American merchandise trade exceeding $4 trillion in 2023.
- Role: customs clearance, duties, security filings
- Data: ACE >95% commercial entry processing
- Impact: fewer exceptions, more predictable transit
Fuel, Maintenance, and Facility Providers
Fuel, maintenance and facility partners span fuel suppliers, tire and parts vendors, third-party shops and landlords for terminals; volume purchasing stabilizes input costs and ensures availability. With US diesel averaging about 4.00 USD/gal in 2024 (EIA), on-site and mobile maintenance shorten repair cycles and reduce downtime, while facility partners enable scalable cross-dock operations in key markets.
- Volume buying: stabilizes pricing and supply
- On-site/mobile maintenance: faster turnarounds, less downtime
- Third-party shops: cost-effective specialty repairs
- Real estate partners: scalable cross-dock capacity in priority hubs
Carrier partners, tech and customs align to stabilize costs, improve reach and reliability
XPO partners with OEMs/leasing firms (fleet refresh 3–5 yrs), tech vendors (ELD mandate, real‑time visibility), interline LTLs (reach ~95% US ZIPs, +8–12% trailer fill) and customs brokers (ACE >95% entries) to stabilize costs and ensure reliability; fuel/maintenance partners mitigate input volatility (US diesel ≈ $4.00/gal in 2024).
| Partner | Metric | 2024 |
|---|---|---|
| Geographic reach | US ZIP coverage | ~95% |
| Trailer fill | Improvement | +8–12% |
| Diesel | Avg price | $4.00/gal |
What is included in the product
Detailed Word Document
A comprehensive Business Model Canvas tailored to XPO's logistics and transportation strategy, covering customer segments, channels, value propositions, key activities, partners, resources, cost structure and revenue streams across the 9 classic blocks. Ideal for presentations and investor discussions, it includes competitive advantage analysis, SWOT-linked insights and practical validation using real company operations.
Customizable Excel Spreadsheet
High-level view of XPO's business model with editable cells that simplify complex logistics and permit quick alignment across teams. Shareable, boardroom-ready layout that saves hours and helps compare strategic options side-by-side.
Activities
Linehaul and P&D Operations
Linehaul and P&D operations coordinate long‑haul scheduling with local pickup-and-delivery to balance trailer loads, cube and routing for service and cost. In 2024 XPO emphasized reducing empty miles and dwell through dynamic routing and cross‑dock balancing to boost trailer utilization. Execution of these plans directly drives on‑time performance and overall network efficiency.
Cross-Dock and Terminal Management
Cross-dock and terminal management at XPO focuses on sorting, consolidation and deconsolidation of freight across over 300 service centers in North America and Europe, using standardized processes that materially reduce misloads and damage. Dock planning synchronizes labor with trailer flow to smooth peak throughput. This capability underpins transit-time reliability and supports on-time performance targets above 90% reported in 2024.
Network Planning and Optimization
Network planning models lanes, bidirectional flows and break-bulk routing so algorithms can generate load plans and relays that maximize asset utilization and reduce empty miles. Seasonal peaks of up to 30% in e-commerce volume require demand-driven adjustments to preserve on-time service. Continuous improvement programs have driven year-over-year unit cost per hundredweight reductions of about 5%, improving margin on high-density lanes.
Customer Service and Shipment Visibility
Customer service and shipment visibility provide tracking, exceptions handling, and proactive notifications, with agents and digital tools managing inquiries and changes. Real-time ETAs reduce friction for shippers and improve scheduling. Strong service drives retention and wallet share; XPO reported roughly $13.0 billion revenue in 2024, reflecting commercial strength.
- Tracking, exceptions, proactive alerts
- Agents + digital tools for inquiries
- Real-time ETAs cut operational friction
- Service boosts retention & wallet share
Pricing, Yield, and Compliance Management
Pricing, yield, and compliance set tariffs, contracts, discounts, and accessorials to hit margin targets; XPO reported 2024 revenue above $10B supporting scale in price leverage. Yield management aligns product mix with capacity constraints to protect utilization and drive 3–5% pricing lift. Safety and regulatory compliance shield operations and reputation. Data-led governance enforces consistent, profitable decisions.
- Tariffs & contracts
- Yield vs capacity
- Safety & compliance
- Data governance
Ops cut empty miles: $13.0B, >90%, ~5%
Linehaul, P&D and cross-dock ops optimize routing, reduce empty miles and drove ~5% unit cost/HC improvement in 2024. Network planning across 300+ service centers sustained >90% on-time performance, handling seasonal e-commerce spikes up to 30%. Customer visibility, pricing and compliance preserved yield and supported ~$13.0B revenue in 2024.
| Metric | 2024 |
|---|---|
| Revenue | $13.0B |
| Service centers | 300+ |
| On-time | >90% |
| Unit cost ↓ | ~5% |
What You See Is What You Get
Business Model Canvas
The document previewed here is the actual XPO Business Model Canvas you will receive—it's not a mockup. Upon purchase you'll download this exact, fully editable file formatted for immediate use in Word and Excel. What you see is the complete deliverable, ready to present, edit, and implement.











