XPO Porter's Five Forces Analysis

Don't Miss the Bigger Picture
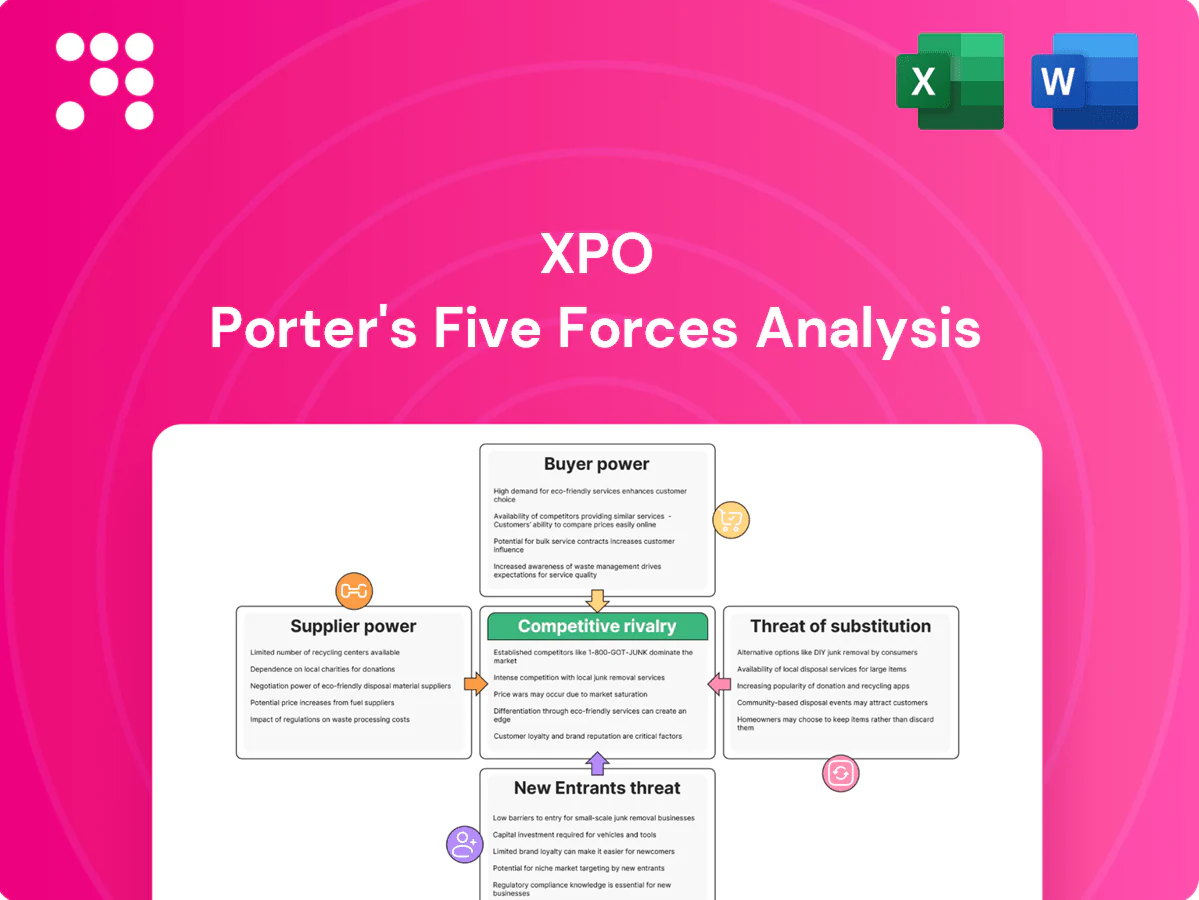
XPO's Porter's Five Forces snapshot highlights intense buyer power, moderate supplier influence, high rivalry, and growing substitute and entrant threats driven by tech and asset-light competitors. This brief overview outlines strategic pressures on margins, pricing flexibility, and capacity decisions. Unlock the full Porter's Five Forces Analysis to access force-by-force ratings, visuals, and actionable strategies to inform investments or corporate planning.
Suppliers Bargaining Power

Concentrated truck OEMs
Heavy tractor and trailer supply is concentrated among a few OEMs (Freightliner, PACCAR, Volvo, Navistar), with the top five accounting for roughly 75% of the U.S. Class 8 market in 2024, allowing pricing and lead-time pressure. XPO mitigates exposure via multi-sourcing and fleet standardization, but remains vulnerable to chassis and parts cycles; tight post-downturn supply pushed lead times into many quarters and raised maintenance costs. Strong procurement, long-term OEM relationships and an active used-equipment channel partially offset OEM leverage and shortened effective replacement timelines.
Fuel providers and volatility
Fuel is a critical input and XPO typically uses fuel surcharges to pass costs to customers, with U.S. retail diesel averaging about $3.70/gal in 2024. Timing gaps between price moves and surcharge adjustments plus competitive pressure can compress margins during rapid swings. Regional fuel availability and rack price spreads (often $0.20–$0.50/gal) materially affect lane profitability. Hedging policies and network planning reduce but do not eliminate supplier influence.

Labor markets and contractors
Tight labor markets (US unemployment ~3.7% in Dec 2024) make drivers, dockworkers and maintenance technicians scarce, boosting wage pressure and overtime costs during peaks. XPO leverages training pipelines and retention programs to mitigate churn, but third-party capacity reliance in surges adds upward rate pressure. Limited union exposure relative to peers reduces collective bargaining risk.

Terminal real estate and landlords
In 2024 U.S. industrial vacancy was about 4.4% (CBRE), making high-quality cross-dock terminals scarce and giving landlords strong negotiating leverage. Long-term leases (commonly 5–15 years) and strategic ownership reduce renewal risk, but acquisition/construction and competition raise expansion costs while zoning and permitting often add 12–24 months. Concentration of commerce in top metros (≈70% of GDP) heightens dependence on select sites.
- Scarcity: vacancy ~4.4% 2024
- Leases: 5–15 years → lower renewal risk
- Permitting: 12–24 month delays
- Concentration: top metros ≈70% GDP
Technology and telematics vendors
XPO relies on routing, visibility, and telematics systems with meaningful switching costs, giving concentrated TMS/telematics vendors pricing power especially where bespoke integrations exist; XPO offsets this via API integrations and selective in-house development to reclaim control. Cybersecurity posture and uptime SLAs are primary negotiation levers that materially affect operational risk and costs.
- Vendor concentration: increases supplier leverage
- Switching costs: high for integrated TMS/telematics
- API + in-house: reduces dependence
- Cybersecurity & SLAs: key contractual controls
Class 8 OEMs ~75%; diesel $3.70/gal; tight labor
Supplier power is moderate‑high: Class 8 OEMs hold ~75% share (2024), giving pricing/lead‑time leverage; fuel averaged ~$3.70/gal (2024) with surcharge lag; tight labor (U.S. unemployment ~3.7% Dec 2024) raises wage pressure; real estate vacancy ~4.4% (2024) and concentrated TMS vendors add negotiating leverage, partially offset by XPO multi‑sourcing, procurement and used equipment channels.
| Input | 2024 Metric |
|---|---|
| Class 8 OEM share | ~75% |
| Diesel (U.S.) | $3.70/gal |
| Unemployment (Dec) | 3.7% |
| Industrial vacancy | 4.4% |
What is included in the product
 Detailed Word Document
Concise Porter's Five Forces assessment tailored to XPO that uncovers competitive drivers, supplier and buyer power, threat of entrants and substitutes, and disruptive risks, with strategic commentary to inform pricing, profitability, and defensive positioning.

 Customizable Excel Spreadsheet
A concise XPO Porter’s Five Forces one-sheet that instantly highlights competitive pain points for faster decisions; customizable pressure levels, spider-chart visuals and export-ready layout make it boardroom-ready without macros or complex setup.
Customers Bargaining Power

Large shippers and RFP cycles
Enterprise customers run competitive RFPs that compress prices and tighten payment and service terms, leveraging concentrated volume and multi-carrier strategies to extract concessions.
XPO defends yield by competing on service quality, network density and faster transit times to justify premiums rather than lowest-cost bids.
Contract design, minimum-volume commitments and lane-level profitability analytics are deployed to protect margins and prioritize lanes with positive unit economics.
Moderate switching costs
Customers can shift volumes across LTL carriers, especially on commoditized lanes, but onboarding friction from EDI/API integration and service predictability limits churn; US LTL market size was about $46B in 2024, amplifying competition. Network performance on specific origin–destination pairs often anchors relationships, while superior visibility and claims performance measurably reduce churn risk.

Service quality sensitivity
Buyers prioritize on-time performance, low damage rates and rapid exception handling; industry surveys in 2024 show roughly 80% of shippers rate on-time delivery as a top-three buying criterion. Superior KPIs let XPO command premiums—often cited up to 10% on critical lanes—while SLA failures rapidly trigger bid events or volume reallocation within weeks. Real-time, tech-enabled tracking boosts stickiness and price realization, with visibility-related retention uplifts near 15% in 2024 studies.

Fuel surcharge and accessorial scrutiny
Shippers in 2024 closely audit fuel tables and accessorials (liftgate, residential, detention), increasing contract scrutiny and dispute prevention. Transparent, consistently applied surcharges reduce disputes but limit upside for carriers. Well-designed accessorials steer shipper behavior and protect margins. Data-backed negotiations raise buyer acceptance and speed resolution.
- 2024: heightened audit focus
- Transparency reduces disputes but caps revenue
- Accessorial design = behavioral steering
- Data-driven pricing improves acceptance
3PLs aggregating demand
Third-party logistics firms bundle volumes and negotiate aggressively, shifting freight across carriers by price and service; global 3PL market size reached about $1.2 trillion in 2024, increasing buyer leverage. XPO captured incremental volume but faced tighter yields as 2024 revenue was near $11.6 billion, pressuring per-load margins. Enhanced connectivity and tailored programs can move XPO relationships from transactional to strategic.
- 3PL aggregation: market ~$1.2T (2024)
- XPO scale: revenue ~$11.6B (2024)
- Buyer leverage: faster carrier switching lowers yields
- Opportunity: connectivity + tailored programs = strategic partnerships
RFPs compress LTL yields; network-dense carriers command premiums with faster transit, +15% vis
Enterprise shippers run aggressive RFPs, leveraging 3PL aggregation and a ~$46B US LTL market to compress yields. XPO defends pricing via network density, faster transit and tech-enabled visibility (visibility retention +15% in 2024) to justify premiums. Key levers: contract minimums, lane-level analytics and strict accessorials; on-time delivery ranked top-three by ~80% of shippers in 2024.
| Metric | 2024 |
|---|---|
| US LTL market | $46B |
| 3PL market | $1.2T |
| XPO revenue | $11.6B |
| On-time priority | ~80% |
| Visibility retention uplift | ~15% |
Preview Before You Purchase
XPO Porter's Five Forces Analysis
This preview shows the exact XPO Porter's Five Forces Analysis you'll receive immediately after purchase—no placeholders or samples. The document displayed is the professionally formatted, ready-to-use file available for instant download once you buy. What you see here is what you get.

Don't Miss the Bigger Picture
XPO's Porter's Five Forces snapshot highlights intense buyer power, moderate supplier influence, high rivalry, and growing substitute and entrant threats driven by tech and asset-light competitors. This brief overview outlines strategic pressures on margins, pricing flexibility, and capacity decisions. Unlock the full Porter's Five Forces Analysis to access force-by-force ratings, visuals, and actionable strategies to inform investments or corporate planning.
Suppliers Bargaining Power
Concentrated truck OEMs
Heavy tractor and trailer supply is concentrated among a few OEMs (Freightliner, PACCAR, Volvo, Navistar), with the top five accounting for roughly 75% of the U.S. Class 8 market in 2024, allowing pricing and lead-time pressure. XPO mitigates exposure via multi-sourcing and fleet standardization, but remains vulnerable to chassis and parts cycles; tight post-downturn supply pushed lead times into many quarters and raised maintenance costs. Strong procurement, long-term OEM relationships and an active used-equipment channel partially offset OEM leverage and shortened effective replacement timelines.
Fuel providers and volatility
Fuel is a critical input and XPO typically uses fuel surcharges to pass costs to customers, with U.S. retail diesel averaging about $3.70/gal in 2024. Timing gaps between price moves and surcharge adjustments plus competitive pressure can compress margins during rapid swings. Regional fuel availability and rack price spreads (often $0.20–$0.50/gal) materially affect lane profitability. Hedging policies and network planning reduce but do not eliminate supplier influence.
Labor markets and contractors
Tight labor markets (US unemployment ~3.7% in Dec 2024) make drivers, dockworkers and maintenance technicians scarce, boosting wage pressure and overtime costs during peaks. XPO leverages training pipelines and retention programs to mitigate churn, but third-party capacity reliance in surges adds upward rate pressure. Limited union exposure relative to peers reduces collective bargaining risk.
Terminal real estate and landlords
In 2024 U.S. industrial vacancy was about 4.4% (CBRE), making high-quality cross-dock terminals scarce and giving landlords strong negotiating leverage. Long-term leases (commonly 5–15 years) and strategic ownership reduce renewal risk, but acquisition/construction and competition raise expansion costs while zoning and permitting often add 12–24 months. Concentration of commerce in top metros (≈70% of GDP) heightens dependence on select sites.
- Scarcity: vacancy ~4.4% 2024
- Leases: 5–15 years → lower renewal risk
- Permitting: 12–24 month delays
- Concentration: top metros ≈70% GDP
Technology and telematics vendors
XPO relies on routing, visibility, and telematics systems with meaningful switching costs, giving concentrated TMS/telematics vendors pricing power especially where bespoke integrations exist; XPO offsets this via API integrations and selective in-house development to reclaim control. Cybersecurity posture and uptime SLAs are primary negotiation levers that materially affect operational risk and costs.
- Vendor concentration: increases supplier leverage
- Switching costs: high for integrated TMS/telematics
- API + in-house: reduces dependence
- Cybersecurity & SLAs: key contractual controls
Class 8 OEMs ~75%; diesel $3.70/gal; tight labor
Supplier power is moderate‑high: Class 8 OEMs hold ~75% share (2024), giving pricing/lead‑time leverage; fuel averaged ~$3.70/gal (2024) with surcharge lag; tight labor (U.S. unemployment ~3.7% Dec 2024) raises wage pressure; real estate vacancy ~4.4% (2024) and concentrated TMS vendors add negotiating leverage, partially offset by XPO multi‑sourcing, procurement and used equipment channels.
| Input | 2024 Metric |
|---|---|
| Class 8 OEM share | ~75% |
| Diesel (U.S.) | $3.70/gal |
| Unemployment (Dec) | 3.7% |
| Industrial vacancy | 4.4% |
What is included in the product
Detailed Word Document
Concise Porter's Five Forces assessment tailored to XPO that uncovers competitive drivers, supplier and buyer power, threat of entrants and substitutes, and disruptive risks, with strategic commentary to inform pricing, profitability, and defensive positioning.
Customizable Excel Spreadsheet
A concise XPO Porter’s Five Forces one-sheet that instantly highlights competitive pain points for faster decisions; customizable pressure levels, spider-chart visuals and export-ready layout make it boardroom-ready without macros or complex setup.
Customers Bargaining Power
Large shippers and RFP cycles
Enterprise customers run competitive RFPs that compress prices and tighten payment and service terms, leveraging concentrated volume and multi-carrier strategies to extract concessions.
XPO defends yield by competing on service quality, network density and faster transit times to justify premiums rather than lowest-cost bids.
Contract design, minimum-volume commitments and lane-level profitability analytics are deployed to protect margins and prioritize lanes with positive unit economics.
Moderate switching costs
Customers can shift volumes across LTL carriers, especially on commoditized lanes, but onboarding friction from EDI/API integration and service predictability limits churn; US LTL market size was about $46B in 2024, amplifying competition. Network performance on specific origin–destination pairs often anchors relationships, while superior visibility and claims performance measurably reduce churn risk.
Service quality sensitivity
Buyers prioritize on-time performance, low damage rates and rapid exception handling; industry surveys in 2024 show roughly 80% of shippers rate on-time delivery as a top-three buying criterion. Superior KPIs let XPO command premiums—often cited up to 10% on critical lanes—while SLA failures rapidly trigger bid events or volume reallocation within weeks. Real-time, tech-enabled tracking boosts stickiness and price realization, with visibility-related retention uplifts near 15% in 2024 studies.
Fuel surcharge and accessorial scrutiny
Shippers in 2024 closely audit fuel tables and accessorials (liftgate, residential, detention), increasing contract scrutiny and dispute prevention. Transparent, consistently applied surcharges reduce disputes but limit upside for carriers. Well-designed accessorials steer shipper behavior and protect margins. Data-backed negotiations raise buyer acceptance and speed resolution.
- 2024: heightened audit focus
- Transparency reduces disputes but caps revenue
- Accessorial design = behavioral steering
- Data-driven pricing improves acceptance
3PLs aggregating demand
Third-party logistics firms bundle volumes and negotiate aggressively, shifting freight across carriers by price and service; global 3PL market size reached about $1.2 trillion in 2024, increasing buyer leverage. XPO captured incremental volume but faced tighter yields as 2024 revenue was near $11.6 billion, pressuring per-load margins. Enhanced connectivity and tailored programs can move XPO relationships from transactional to strategic.
- 3PL aggregation: market ~$1.2T (2024)
- XPO scale: revenue ~$11.6B (2024)
- Buyer leverage: faster carrier switching lowers yields
- Opportunity: connectivity + tailored programs = strategic partnerships
RFPs compress LTL yields; network-dense carriers command premiums with faster transit, +15% vis
Enterprise shippers run aggressive RFPs, leveraging 3PL aggregation and a ~$46B US LTL market to compress yields. XPO defends pricing via network density, faster transit and tech-enabled visibility (visibility retention +15% in 2024) to justify premiums. Key levers: contract minimums, lane-level analytics and strict accessorials; on-time delivery ranked top-three by ~80% of shippers in 2024.
| Metric | 2024 |
|---|---|
| US LTL market | $46B |
| 3PL market | $1.2T |
| XPO revenue | $11.6B |
| On-time priority | ~80% |
| Visibility retention uplift | ~15% |
Preview Before You Purchase
XPO Porter's Five Forces Analysis
This preview shows the exact XPO Porter's Five Forces Analysis you'll receive immediately after purchase—no placeholders or samples. The document displayed is the professionally formatted, ready-to-use file available for instant download once you buy. What you see here is what you get.
Description
Don't Miss the Bigger Picture
XPO's Porter's Five Forces snapshot highlights intense buyer power, moderate supplier influence, high rivalry, and growing substitute and entrant threats driven by tech and asset-light competitors. This brief overview outlines strategic pressures on margins, pricing flexibility, and capacity decisions. Unlock the full Porter's Five Forces Analysis to access force-by-force ratings, visuals, and actionable strategies to inform investments or corporate planning.
Suppliers Bargaining Power
Concentrated truck OEMs
Heavy tractor and trailer supply is concentrated among a few OEMs (Freightliner, PACCAR, Volvo, Navistar), with the top five accounting for roughly 75% of the U.S. Class 8 market in 2024, allowing pricing and lead-time pressure. XPO mitigates exposure via multi-sourcing and fleet standardization, but remains vulnerable to chassis and parts cycles; tight post-downturn supply pushed lead times into many quarters and raised maintenance costs. Strong procurement, long-term OEM relationships and an active used-equipment channel partially offset OEM leverage and shortened effective replacement timelines.
Fuel providers and volatility
Fuel is a critical input and XPO typically uses fuel surcharges to pass costs to customers, with U.S. retail diesel averaging about $3.70/gal in 2024. Timing gaps between price moves and surcharge adjustments plus competitive pressure can compress margins during rapid swings. Regional fuel availability and rack price spreads (often $0.20–$0.50/gal) materially affect lane profitability. Hedging policies and network planning reduce but do not eliminate supplier influence.
Labor markets and contractors
Tight labor markets (US unemployment ~3.7% in Dec 2024) make drivers, dockworkers and maintenance technicians scarce, boosting wage pressure and overtime costs during peaks. XPO leverages training pipelines and retention programs to mitigate churn, but third-party capacity reliance in surges adds upward rate pressure. Limited union exposure relative to peers reduces collective bargaining risk.
Terminal real estate and landlords
In 2024 U.S. industrial vacancy was about 4.4% (CBRE), making high-quality cross-dock terminals scarce and giving landlords strong negotiating leverage. Long-term leases (commonly 5–15 years) and strategic ownership reduce renewal risk, but acquisition/construction and competition raise expansion costs while zoning and permitting often add 12–24 months. Concentration of commerce in top metros (≈70% of GDP) heightens dependence on select sites.
- Scarcity: vacancy ~4.4% 2024
- Leases: 5–15 years → lower renewal risk
- Permitting: 12–24 month delays
- Concentration: top metros ≈70% GDP
Technology and telematics vendors
XPO relies on routing, visibility, and telematics systems with meaningful switching costs, giving concentrated TMS/telematics vendors pricing power especially where bespoke integrations exist; XPO offsets this via API integrations and selective in-house development to reclaim control. Cybersecurity posture and uptime SLAs are primary negotiation levers that materially affect operational risk and costs.
- Vendor concentration: increases supplier leverage
- Switching costs: high for integrated TMS/telematics
- API + in-house: reduces dependence
- Cybersecurity & SLAs: key contractual controls
Class 8 OEMs ~75%; diesel $3.70/gal; tight labor
Supplier power is moderate‑high: Class 8 OEMs hold ~75% share (2024), giving pricing/lead‑time leverage; fuel averaged ~$3.70/gal (2024) with surcharge lag; tight labor (U.S. unemployment ~3.7% Dec 2024) raises wage pressure; real estate vacancy ~4.4% (2024) and concentrated TMS vendors add negotiating leverage, partially offset by XPO multi‑sourcing, procurement and used equipment channels.
| Input | 2024 Metric |
|---|---|
| Class 8 OEM share | ~75% |
| Diesel (U.S.) | $3.70/gal |
| Unemployment (Dec) | 3.7% |
| Industrial vacancy | 4.4% |
What is included in the product
Detailed Word Document
Concise Porter's Five Forces assessment tailored to XPO that uncovers competitive drivers, supplier and buyer power, threat of entrants and substitutes, and disruptive risks, with strategic commentary to inform pricing, profitability, and defensive positioning.
Customizable Excel Spreadsheet
A concise XPO Porter’s Five Forces one-sheet that instantly highlights competitive pain points for faster decisions; customizable pressure levels, spider-chart visuals and export-ready layout make it boardroom-ready without macros or complex setup.
Customers Bargaining Power
Large shippers and RFP cycles
Enterprise customers run competitive RFPs that compress prices and tighten payment and service terms, leveraging concentrated volume and multi-carrier strategies to extract concessions.
XPO defends yield by competing on service quality, network density and faster transit times to justify premiums rather than lowest-cost bids.
Contract design, minimum-volume commitments and lane-level profitability analytics are deployed to protect margins and prioritize lanes with positive unit economics.
Moderate switching costs
Customers can shift volumes across LTL carriers, especially on commoditized lanes, but onboarding friction from EDI/API integration and service predictability limits churn; US LTL market size was about $46B in 2024, amplifying competition. Network performance on specific origin–destination pairs often anchors relationships, while superior visibility and claims performance measurably reduce churn risk.
Service quality sensitivity
Buyers prioritize on-time performance, low damage rates and rapid exception handling; industry surveys in 2024 show roughly 80% of shippers rate on-time delivery as a top-three buying criterion. Superior KPIs let XPO command premiums—often cited up to 10% on critical lanes—while SLA failures rapidly trigger bid events or volume reallocation within weeks. Real-time, tech-enabled tracking boosts stickiness and price realization, with visibility-related retention uplifts near 15% in 2024 studies.
Fuel surcharge and accessorial scrutiny
Shippers in 2024 closely audit fuel tables and accessorials (liftgate, residential, detention), increasing contract scrutiny and dispute prevention. Transparent, consistently applied surcharges reduce disputes but limit upside for carriers. Well-designed accessorials steer shipper behavior and protect margins. Data-backed negotiations raise buyer acceptance and speed resolution.
- 2024: heightened audit focus
- Transparency reduces disputes but caps revenue
- Accessorial design = behavioral steering
- Data-driven pricing improves acceptance
3PLs aggregating demand
Third-party logistics firms bundle volumes and negotiate aggressively, shifting freight across carriers by price and service; global 3PL market size reached about $1.2 trillion in 2024, increasing buyer leverage. XPO captured incremental volume but faced tighter yields as 2024 revenue was near $11.6 billion, pressuring per-load margins. Enhanced connectivity and tailored programs can move XPO relationships from transactional to strategic.
- 3PL aggregation: market ~$1.2T (2024)
- XPO scale: revenue ~$11.6B (2024)
- Buyer leverage: faster carrier switching lowers yields
- Opportunity: connectivity + tailored programs = strategic partnerships
RFPs compress LTL yields; network-dense carriers command premiums with faster transit, +15% vis
Enterprise shippers run aggressive RFPs, leveraging 3PL aggregation and a ~$46B US LTL market to compress yields. XPO defends pricing via network density, faster transit and tech-enabled visibility (visibility retention +15% in 2024) to justify premiums. Key levers: contract minimums, lane-level analytics and strict accessorials; on-time delivery ranked top-three by ~80% of shippers in 2024.
| Metric | 2024 |
|---|---|
| US LTL market | $46B |
| 3PL market | $1.2T |
| XPO revenue | $11.6B |
| On-time priority | ~80% |
| Visibility retention uplift | ~15% |
Preview Before You Purchase
XPO Porter's Five Forces Analysis
This preview shows the exact XPO Porter's Five Forces Analysis you'll receive immediately after purchase—no placeholders or samples. The document displayed is the professionally formatted, ready-to-use file available for instant download once you buy. What you see here is what you get.











