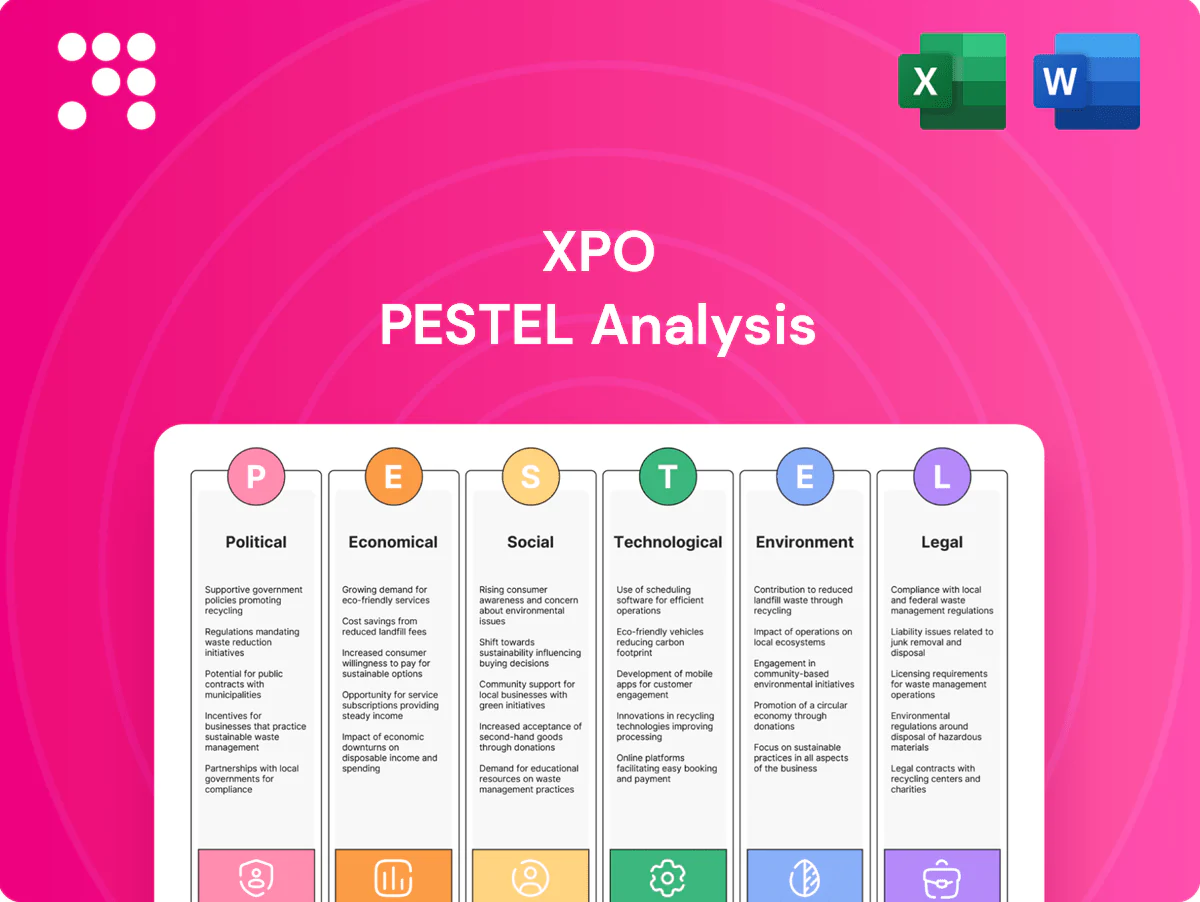
XPO PESTLE Analysis

Your Competitive Advantage Starts with This Report
Gain strategic clarity with our PESTLE analysis of XPO—three concise sections reveal how political, economic, social, technological, legal and environmental forces shape its trajectory. Use these insights to spot risks and growth levers for investors and strategists. Purchase the full report for detailed, ready-to-use intelligence.
Political factors

USMCA cross-border policy
Stable USMCA rules underpin over $1.5 trillion in annual trilateral trade, supporting cross-border LTL volumes and lane density critical to XPO's network. Tariff shifts, customs bottlenecks or cabotage debates can increase transit times and costs for shippers. XPO must maintain robust compliance, brokerage partnerships and proactive engagement with border authorities to preserve service reliability.
Federal infrastructure spending
Federal infrastructure spending from the 2021 Bipartisan Infrastructure Law (1.2 trillion total, including roughly 110 billion for roads and bridges) can cut congestion and boost LTL productivity by improving highway and bridge capacity. Delays or earmark shifts can defer these efficiency gains and raise maintenance costs. XPO should align terminal siting and lane planning with funded corridors and pursue discretionary grants (RAISE/INFRA) to influence freight-critical allocations.

State-level incentives and regulations
State-level divergence in equipment grants, EV subsidies and tolling materially shapes XPOs cost-to-serve; the federal EV tax credit under the Inflation Reduction Act provides up to 7,500 per vehicle while California, with ~12% of US population and the nation’s largest freight market, enforces stricter fleet rules that can accelerate electrification. XPO can capture grant and tax relief to lower capex but must budget for compliance and retrofit costs. Network design must mirror state-by-state regulatory friction and toll regimes, balancing savings opportunities against operational complexity.

Public safety and security agendas
Increased emphasis on road safety—WHO reports about 1.35 million annual road deaths—drives tighter enforcement, inspections and lower speed limits that can slow XPO pickup/delivery cycles. Security directives for hazardous materials and sensitive border zones add procedural steps and paperwork, raising risk of dwell and fines across jurisdictions. XPO must standardize cross-border protocols and transparent reporting to maintain stakeholder trust and aid policy dialogue.
- Enforcement: higher inspection frequency → potential route delays
- Hazmat rules: extra manifests and checks → compliance costs
- Standardization: unified SOPs reduce dwell and fines
- Reporting: transparent KPIs bolster regulator relations
Geopolitical energy dynamics
Geopolitical tensions push Brent crude and diesel volatility, with Brent averaging about $82/barrel in 2024 and US diesel retail near $3.85/gal (EIA), driving fuel-surcharge pressure; sanctions or reserve releases can swing regional diesel availability by ~0.5–1.0 mb/d. XPO must keep hedging bands and dynamic surcharge formulas adaptive and communicate pass-through impacts clearly to customers.
- Brent 2024 ~82 USD/barrel
- US diesel 2024 ~3.85 USD/gal (EIA)
- Supply shocks ~0.5–1.0 mb/d impact
- Adapt hedges; clarify pass-throughs
USMCA, infrastructure and IRA credits reshape cross-border LTL, electrification and fuel risk
Stable USMCA trade (~1.5T) and the 2021 Bipartisan Infrastructure Law (1.2T; ~110B roads) underpin XPO’s cross‑border LTL and productivity; tariff shifts or customs bottlenecks raise costs and delays. State EV policies and IRA credit (up to 7,500) shape electrification capex and retrofit timing. Fuel/geopolitics (Brent ~82$/bbl; US diesel ~3.85$/gal, 2024) force adaptive hedging.
| Indicator | 2024/2025 | Impact |
|---|---|---|
| USMCA trade | ~1.5T | support LTL lanes |
| Infra law | 1.2T (110B roads) | reduce congestion |
| IRA EV credit | up to 7,500 | lower capex |
| Brent | ~82 $/bbl | fuel cost volatility |
What is included in the product
 Detailed Word Document
Explores how political, economic, social, technological, environmental and legal factors uniquely affect XPO, with data-backed trends and region/industry-specific examples. Designed for executives and investors, it delivers clean, forward-looking insights to guide strategy, risk management, and funding decisions.

 Customizable Excel Spreadsheet
A concise, visually segmented PESTLE summary of XPO that’s easily dropped into presentations or shared across teams, enabling quick alignment on external risks, regulatory changes, and market positioning; editable for region- or business-line–specific notes to support faster planning and client reporting.
Economic factors

Freight cycle sensitivity
LTL demand tracks industrial production, retail restocking and housing flows—U.S. industrial production rose about 1.2% y/y in 2024 and housing starts averaged ~1.46M units, lifting freight volumes. Downcycles compress yields and mix; upcycles reward strict capacity discipline and drive rate recovery. XPO mitigates swings by flexing linehaul, buying supplemental transportation and charging accessorials to protect margins. Advanced pricing science and yield management preserve rate integrity through cycles.
Fuel costs and surcharges
Diesel volatility drives 20-30% of trucking operating expenses and directly increases customers' total landed cost, pressuring margins during spikes. Surcharge formulas help offset swings but often lag rapid price moves, creating short-term exposure for XPO and its clients. XPO leverages fuel-efficient specs and route-optimization tech to reduce burn, while transparent surcharge structures support customer retention.

Interest rates and capex
With the US policy rate at 5.25–5.50% (July 2025), higher borrowing costs lift financing for fleet, real estate, and technology, forcing terminal expansions and tractor purchases to clear elevated hurdle rates. XPO should target ROI-heavy automation and density-building lanes to shorten payback, while using lease-versus-buy decisions and pursuing federal/state grants to optimize capital structure and preserve liquidity.

Shipper mix and pricing power
XPO’s balanced shipper mix across industrial, retail and healthcare reduces demand cyclicality, while tight capacity periods raise yield-management leverage and capacity gluts compress margins. The company’s on-time, damage-free service proposition supports premium pricing, and contract indexation to fuel and wage indices helps shield margins from input shocks.
- Shipper mix: diversification lowers volatility
- Capacity: tight = pricing power; excess = margin pressure
- Service differentiation: enables premiums
- Indexed contracts: protect against input cost swings
Labor availability and wage inflation
Labor tightness in driver and dock-worker markets (ATA estimated a US driver shortfall of about 80,000 in 2022) raises service variability and overtime exposure for XPO.
Wage escalation and sign-on bonuses, often running into several thousand dollars, elevate unit costs; XPO’s training pipelines and retention programs aim to lower churn, while productivity tools boost throughput to help offset labor inflation.
- Driver shortfall: ATA ~80,000 (2022)
- Sign-on bonuses: several thousand dollars
- Retention via training: reduces churn
- Productivity tools: increase throughput to offset costs
USMCA, infrastructure and IRA credits reshape cross-border LTL, electrification and fuel risk
Industrial production +1.2% y/y (2024) and housing starts ~1.46M lift LTL volumes; diesel volatility (20–30% of opex) and ATA driver shortfall ~80,000 (2022) pressure margins. Fed funds 5.25–5.50% (Jul 2025) raises capex hurdle, pushing lease vs buy and ROI focus. XPO offsets with yield management, surcharges, automation and density plays.
| Metric | Value |
|---|---|
| Industrial prod (2024) | +1.2% y/y |
| Housing starts | ~1.46M |
| Diesel share | 20–30% opex |
| Fed funds (Jul 2025) | 5.25–5.50% |
| Driver shortfall (ATA) | ~80,000 (2022) |
What You See Is What You Get
XPO PESTLE Analysis
The XPO PESTLE Analysis shown here is the exact document you’ll receive after purchase—fully formatted and ready to use. The layout, content, and structure visible in this preview are identical to the file you’ll download instantly after checkout. No placeholders, no surprises.

Your Competitive Advantage Starts with This Report
Gain strategic clarity with our PESTLE analysis of XPO—three concise sections reveal how political, economic, social, technological, legal and environmental forces shape its trajectory. Use these insights to spot risks and growth levers for investors and strategists. Purchase the full report for detailed, ready-to-use intelligence.
Political factors
USMCA cross-border policy
Stable USMCA rules underpin over $1.5 trillion in annual trilateral trade, supporting cross-border LTL volumes and lane density critical to XPO's network. Tariff shifts, customs bottlenecks or cabotage debates can increase transit times and costs for shippers. XPO must maintain robust compliance, brokerage partnerships and proactive engagement with border authorities to preserve service reliability.
Federal infrastructure spending
Federal infrastructure spending from the 2021 Bipartisan Infrastructure Law (1.2 trillion total, including roughly 110 billion for roads and bridges) can cut congestion and boost LTL productivity by improving highway and bridge capacity. Delays or earmark shifts can defer these efficiency gains and raise maintenance costs. XPO should align terminal siting and lane planning with funded corridors and pursue discretionary grants (RAISE/INFRA) to influence freight-critical allocations.
State-level incentives and regulations
State-level divergence in equipment grants, EV subsidies and tolling materially shapes XPOs cost-to-serve; the federal EV tax credit under the Inflation Reduction Act provides up to 7,500 per vehicle while California, with ~12% of US population and the nation’s largest freight market, enforces stricter fleet rules that can accelerate electrification. XPO can capture grant and tax relief to lower capex but must budget for compliance and retrofit costs. Network design must mirror state-by-state regulatory friction and toll regimes, balancing savings opportunities against operational complexity.
Public safety and security agendas
Increased emphasis on road safety—WHO reports about 1.35 million annual road deaths—drives tighter enforcement, inspections and lower speed limits that can slow XPO pickup/delivery cycles. Security directives for hazardous materials and sensitive border zones add procedural steps and paperwork, raising risk of dwell and fines across jurisdictions. XPO must standardize cross-border protocols and transparent reporting to maintain stakeholder trust and aid policy dialogue.
- Enforcement: higher inspection frequency → potential route delays
- Hazmat rules: extra manifests and checks → compliance costs
- Standardization: unified SOPs reduce dwell and fines
- Reporting: transparent KPIs bolster regulator relations
Geopolitical energy dynamics
Geopolitical tensions push Brent crude and diesel volatility, with Brent averaging about $82/barrel in 2024 and US diesel retail near $3.85/gal (EIA), driving fuel-surcharge pressure; sanctions or reserve releases can swing regional diesel availability by ~0.5–1.0 mb/d. XPO must keep hedging bands and dynamic surcharge formulas adaptive and communicate pass-through impacts clearly to customers.
- Brent 2024 ~82 USD/barrel
- US diesel 2024 ~3.85 USD/gal (EIA)
- Supply shocks ~0.5–1.0 mb/d impact
- Adapt hedges; clarify pass-throughs
USMCA, infrastructure and IRA credits reshape cross-border LTL, electrification and fuel risk
Stable USMCA trade (~1.5T) and the 2021 Bipartisan Infrastructure Law (1.2T; ~110B roads) underpin XPO’s cross‑border LTL and productivity; tariff shifts or customs bottlenecks raise costs and delays. State EV policies and IRA credit (up to 7,500) shape electrification capex and retrofit timing. Fuel/geopolitics (Brent ~82$/bbl; US diesel ~3.85$/gal, 2024) force adaptive hedging.
| Indicator | 2024/2025 | Impact |
|---|---|---|
| USMCA trade | ~1.5T | support LTL lanes |
| Infra law | 1.2T (110B roads) | reduce congestion |
| IRA EV credit | up to 7,500 | lower capex |
| Brent | ~82 $/bbl | fuel cost volatility |
What is included in the product
Detailed Word Document
Explores how political, economic, social, technological, environmental and legal factors uniquely affect XPO, with data-backed trends and region/industry-specific examples. Designed for executives and investors, it delivers clean, forward-looking insights to guide strategy, risk management, and funding decisions.
Customizable Excel Spreadsheet
A concise, visually segmented PESTLE summary of XPO that’s easily dropped into presentations or shared across teams, enabling quick alignment on external risks, regulatory changes, and market positioning; editable for region- or business-line–specific notes to support faster planning and client reporting.
Economic factors
Freight cycle sensitivity
LTL demand tracks industrial production, retail restocking and housing flows—U.S. industrial production rose about 1.2% y/y in 2024 and housing starts averaged ~1.46M units, lifting freight volumes. Downcycles compress yields and mix; upcycles reward strict capacity discipline and drive rate recovery. XPO mitigates swings by flexing linehaul, buying supplemental transportation and charging accessorials to protect margins. Advanced pricing science and yield management preserve rate integrity through cycles.
Fuel costs and surcharges
Diesel volatility drives 20-30% of trucking operating expenses and directly increases customers' total landed cost, pressuring margins during spikes. Surcharge formulas help offset swings but often lag rapid price moves, creating short-term exposure for XPO and its clients. XPO leverages fuel-efficient specs and route-optimization tech to reduce burn, while transparent surcharge structures support customer retention.
Interest rates and capex
With the US policy rate at 5.25–5.50% (July 2025), higher borrowing costs lift financing for fleet, real estate, and technology, forcing terminal expansions and tractor purchases to clear elevated hurdle rates. XPO should target ROI-heavy automation and density-building lanes to shorten payback, while using lease-versus-buy decisions and pursuing federal/state grants to optimize capital structure and preserve liquidity.
Shipper mix and pricing power
XPO’s balanced shipper mix across industrial, retail and healthcare reduces demand cyclicality, while tight capacity periods raise yield-management leverage and capacity gluts compress margins. The company’s on-time, damage-free service proposition supports premium pricing, and contract indexation to fuel and wage indices helps shield margins from input shocks.
- Shipper mix: diversification lowers volatility
- Capacity: tight = pricing power; excess = margin pressure
- Service differentiation: enables premiums
- Indexed contracts: protect against input cost swings
Labor availability and wage inflation
Labor tightness in driver and dock-worker markets (ATA estimated a US driver shortfall of about 80,000 in 2022) raises service variability and overtime exposure for XPO.
Wage escalation and sign-on bonuses, often running into several thousand dollars, elevate unit costs; XPO’s training pipelines and retention programs aim to lower churn, while productivity tools boost throughput to help offset labor inflation.
- Driver shortfall: ATA ~80,000 (2022)
- Sign-on bonuses: several thousand dollars
- Retention via training: reduces churn
- Productivity tools: increase throughput to offset costs
USMCA, infrastructure and IRA credits reshape cross-border LTL, electrification and fuel risk
Industrial production +1.2% y/y (2024) and housing starts ~1.46M lift LTL volumes; diesel volatility (20–30% of opex) and ATA driver shortfall ~80,000 (2022) pressure margins. Fed funds 5.25–5.50% (Jul 2025) raises capex hurdle, pushing lease vs buy and ROI focus. XPO offsets with yield management, surcharges, automation and density plays.
| Metric | Value |
|---|---|
| Industrial prod (2024) | +1.2% y/y |
| Housing starts | ~1.46M |
| Diesel share | 20–30% opex |
| Fed funds (Jul 2025) | 5.25–5.50% |
| Driver shortfall (ATA) | ~80,000 (2022) |
What You See Is What You Get
XPO PESTLE Analysis
The XPO PESTLE Analysis shown here is the exact document you’ll receive after purchase—fully formatted and ready to use. The layout, content, and structure visible in this preview are identical to the file you’ll download instantly after checkout. No placeholders, no surprises.
Original: $10.00
-65%$10.00
$3.50Description
Your Competitive Advantage Starts with This Report
Gain strategic clarity with our PESTLE analysis of XPO—three concise sections reveal how political, economic, social, technological, legal and environmental forces shape its trajectory. Use these insights to spot risks and growth levers for investors and strategists. Purchase the full report for detailed, ready-to-use intelligence.
Political factors
USMCA cross-border policy
Stable USMCA rules underpin over $1.5 trillion in annual trilateral trade, supporting cross-border LTL volumes and lane density critical to XPO's network. Tariff shifts, customs bottlenecks or cabotage debates can increase transit times and costs for shippers. XPO must maintain robust compliance, brokerage partnerships and proactive engagement with border authorities to preserve service reliability.
Federal infrastructure spending
Federal infrastructure spending from the 2021 Bipartisan Infrastructure Law (1.2 trillion total, including roughly 110 billion for roads and bridges) can cut congestion and boost LTL productivity by improving highway and bridge capacity. Delays or earmark shifts can defer these efficiency gains and raise maintenance costs. XPO should align terminal siting and lane planning with funded corridors and pursue discretionary grants (RAISE/INFRA) to influence freight-critical allocations.
State-level incentives and regulations
State-level divergence in equipment grants, EV subsidies and tolling materially shapes XPOs cost-to-serve; the federal EV tax credit under the Inflation Reduction Act provides up to 7,500 per vehicle while California, with ~12% of US population and the nation’s largest freight market, enforces stricter fleet rules that can accelerate electrification. XPO can capture grant and tax relief to lower capex but must budget for compliance and retrofit costs. Network design must mirror state-by-state regulatory friction and toll regimes, balancing savings opportunities against operational complexity.
Public safety and security agendas
Increased emphasis on road safety—WHO reports about 1.35 million annual road deaths—drives tighter enforcement, inspections and lower speed limits that can slow XPO pickup/delivery cycles. Security directives for hazardous materials and sensitive border zones add procedural steps and paperwork, raising risk of dwell and fines across jurisdictions. XPO must standardize cross-border protocols and transparent reporting to maintain stakeholder trust and aid policy dialogue.
- Enforcement: higher inspection frequency → potential route delays
- Hazmat rules: extra manifests and checks → compliance costs
- Standardization: unified SOPs reduce dwell and fines
- Reporting: transparent KPIs bolster regulator relations
Geopolitical energy dynamics
Geopolitical tensions push Brent crude and diesel volatility, with Brent averaging about $82/barrel in 2024 and US diesel retail near $3.85/gal (EIA), driving fuel-surcharge pressure; sanctions or reserve releases can swing regional diesel availability by ~0.5–1.0 mb/d. XPO must keep hedging bands and dynamic surcharge formulas adaptive and communicate pass-through impacts clearly to customers.
- Brent 2024 ~82 USD/barrel
- US diesel 2024 ~3.85 USD/gal (EIA)
- Supply shocks ~0.5–1.0 mb/d impact
- Adapt hedges; clarify pass-throughs
USMCA, infrastructure and IRA credits reshape cross-border LTL, electrification and fuel risk
Stable USMCA trade (~1.5T) and the 2021 Bipartisan Infrastructure Law (1.2T; ~110B roads) underpin XPO’s cross‑border LTL and productivity; tariff shifts or customs bottlenecks raise costs and delays. State EV policies and IRA credit (up to 7,500) shape electrification capex and retrofit timing. Fuel/geopolitics (Brent ~82$/bbl; US diesel ~3.85$/gal, 2024) force adaptive hedging.
| Indicator | 2024/2025 | Impact |
|---|---|---|
| USMCA trade | ~1.5T | support LTL lanes |
| Infra law | 1.2T (110B roads) | reduce congestion |
| IRA EV credit | up to 7,500 | lower capex |
| Brent | ~82 $/bbl | fuel cost volatility |
What is included in the product
Detailed Word Document
Explores how political, economic, social, technological, environmental and legal factors uniquely affect XPO, with data-backed trends and region/industry-specific examples. Designed for executives and investors, it delivers clean, forward-looking insights to guide strategy, risk management, and funding decisions.
Customizable Excel Spreadsheet
A concise, visually segmented PESTLE summary of XPO that’s easily dropped into presentations or shared across teams, enabling quick alignment on external risks, regulatory changes, and market positioning; editable for region- or business-line–specific notes to support faster planning and client reporting.
Economic factors
Freight cycle sensitivity
LTL demand tracks industrial production, retail restocking and housing flows—U.S. industrial production rose about 1.2% y/y in 2024 and housing starts averaged ~1.46M units, lifting freight volumes. Downcycles compress yields and mix; upcycles reward strict capacity discipline and drive rate recovery. XPO mitigates swings by flexing linehaul, buying supplemental transportation and charging accessorials to protect margins. Advanced pricing science and yield management preserve rate integrity through cycles.
Fuel costs and surcharges
Diesel volatility drives 20-30% of trucking operating expenses and directly increases customers' total landed cost, pressuring margins during spikes. Surcharge formulas help offset swings but often lag rapid price moves, creating short-term exposure for XPO and its clients. XPO leverages fuel-efficient specs and route-optimization tech to reduce burn, while transparent surcharge structures support customer retention.
Interest rates and capex
With the US policy rate at 5.25–5.50% (July 2025), higher borrowing costs lift financing for fleet, real estate, and technology, forcing terminal expansions and tractor purchases to clear elevated hurdle rates. XPO should target ROI-heavy automation and density-building lanes to shorten payback, while using lease-versus-buy decisions and pursuing federal/state grants to optimize capital structure and preserve liquidity.
Shipper mix and pricing power
XPO’s balanced shipper mix across industrial, retail and healthcare reduces demand cyclicality, while tight capacity periods raise yield-management leverage and capacity gluts compress margins. The company’s on-time, damage-free service proposition supports premium pricing, and contract indexation to fuel and wage indices helps shield margins from input shocks.
- Shipper mix: diversification lowers volatility
- Capacity: tight = pricing power; excess = margin pressure
- Service differentiation: enables premiums
- Indexed contracts: protect against input cost swings
Labor availability and wage inflation
Labor tightness in driver and dock-worker markets (ATA estimated a US driver shortfall of about 80,000 in 2022) raises service variability and overtime exposure for XPO.
Wage escalation and sign-on bonuses, often running into several thousand dollars, elevate unit costs; XPO’s training pipelines and retention programs aim to lower churn, while productivity tools boost throughput to help offset labor inflation.
- Driver shortfall: ATA ~80,000 (2022)
- Sign-on bonuses: several thousand dollars
- Retention via training: reduces churn
- Productivity tools: increase throughput to offset costs
USMCA, infrastructure and IRA credits reshape cross-border LTL, electrification and fuel risk
Industrial production +1.2% y/y (2024) and housing starts ~1.46M lift LTL volumes; diesel volatility (20–30% of opex) and ATA driver shortfall ~80,000 (2022) pressure margins. Fed funds 5.25–5.50% (Jul 2025) raises capex hurdle, pushing lease vs buy and ROI focus. XPO offsets with yield management, surcharges, automation and density plays.
| Metric | Value |
|---|---|
| Industrial prod (2024) | +1.2% y/y |
| Housing starts | ~1.46M |
| Diesel share | 20–30% opex |
| Fed funds (Jul 2025) | 5.25–5.50% |
| Driver shortfall (ATA) | ~80,000 (2022) |
What You See Is What You Get
XPO PESTLE Analysis
The XPO PESTLE Analysis shown here is the exact document you’ll receive after purchase—fully formatted and ready to use. The layout, content, and structure visible in this preview are identical to the file you’ll download instantly after checkout. No placeholders, no surprises.











