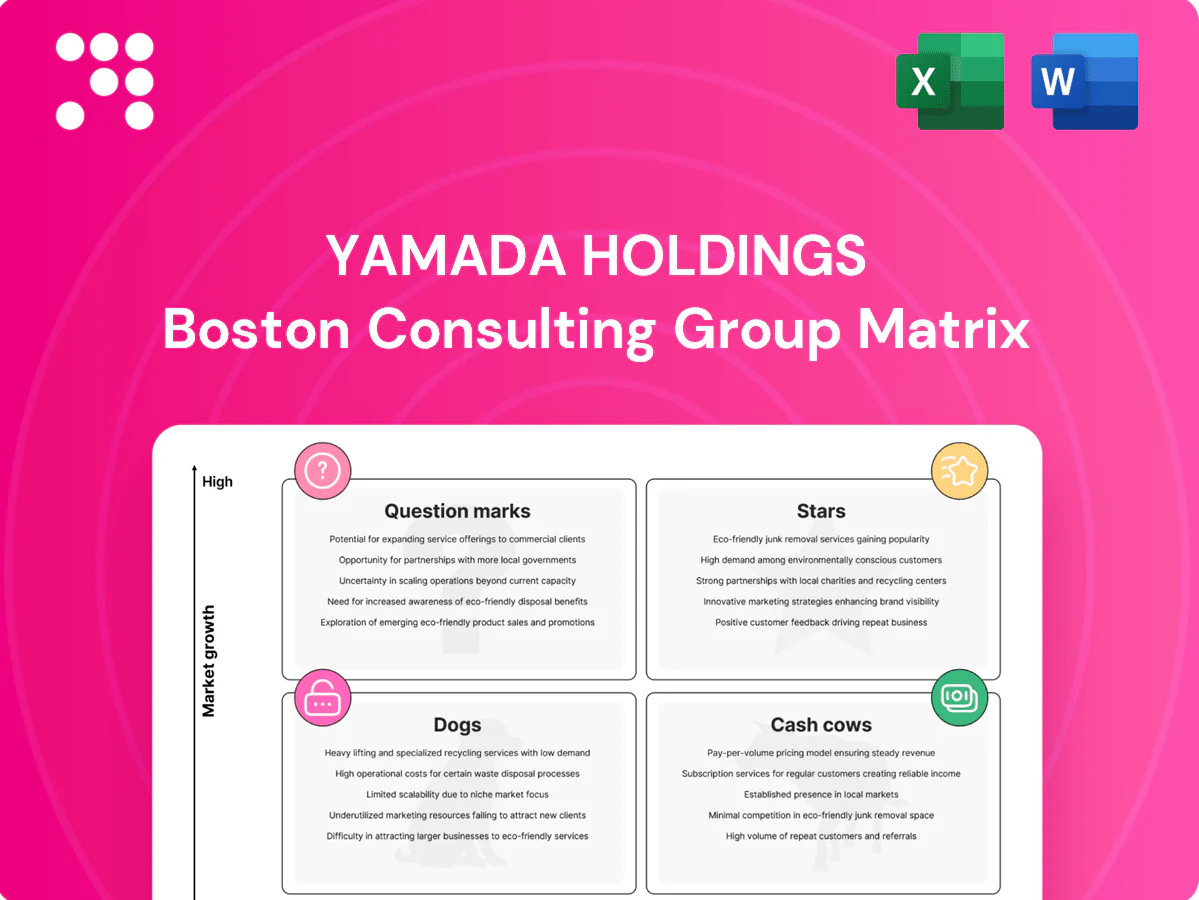
Yamada Holdings Boston Consulting Group Matrix

Actionable Strategy Starts Here
Quick snapshot: Yamada Holdings’ BCG Matrix shows where products are winning, where they’re sucking cash, and which ones could explode with the right push. This preview teases quadrant placements and high-level moves, but the full BCG Matrix gives you the quadrant-by-quadrant breakdown, data-backed recommendations, and ready-to-use Word and Excel deliverables. Buy the complete report to skip the guesswork and get a strategic roadmap you can act on—fast.
Stars

Omnichannel electronics retail engine
In 2024 Yamada Holdings leverages its national footprint plus a strong e-commerce funnel to lead a fast-shifting electronics market. Click-and-collect, ship-from-store and endless-aisle give it operational leverage to convert physical traffic into online sales. The category is still growing online and Yamada already owns significant customer touchpoints. Priorities: inventory velocity, app stickiness and data-driven promotions to monetize owned traffic.
Smart home & energy solutions bundles
Heat‑pump ACs, high‑efficiency appliances and solar+storage with pro install saw sharply rising demand in 2024; Yamada can leverage its ~700‑store footprint (2024) and in‑store tech advisors to capture point‑of‑need sales. Attach rates on installation and maintenance ran near 30% in 2024, keeping LTV high. Pour capex into trained crews and installer partnerships while growth is hot.

Private‑label appliances with installation
House brands ride Yamada’s shelf dominance and price control, with private‑label appliances delivering roughly 4–6 percentage points higher gross margins and accounting for about 12% of appliance revenue in 2024. Attach services (installation/warranty) boost cash conversion by accelerating upfront receipts and raised service attach to ~18% of units. The value segment expanded in 2024 as wallet pressure grew; scale SKUs, defend quality and keep supply tight to avoid stock‑outs.

Mobile devices with carrier tie‑ups
Mobile devices with carrier tie‑ups remain Stars for Yamada: 5G upgrades and standard 3‑year device cycles keep steady footfall, with the majority of smartphone sales 5G‑capable in 2024, and carrier bundles/trade‑ins lowering purchase friction to sustain share. Promotion‑heavy selling yields high-margin cross‑sell opportunities; keep co‑op marketing and counter plan comparison optimized to capture ARPU lift.
- 5G majority in 2024
- Carrier bundles + trade‑ins = higher share
- Promotion drives traffic for cross‑sell
- Maintain co‑op marketing & counter plan tools
Refurb & trade‑in marketplace
Stars: Refurb & trade‑in marketplace — used devices are booming as consumers seek value and sustainability; the global refurbished electronics market exceeded $50 billion in 2024. Yamada’s network of over 400 stores and in‑house testing gives scale competitors lack, enabling fast turnaround, pricing power and higher trust. Invest in diagnostics, standardized grading and extended warranties to lock leadership.
- Scale: >400 stores intake
- Market: >$50B (2024)
- Edge: fast turnaround = pricing power
- Capex: diagnostics, grading, warranties
Scale: 700 stores, 5G bundles, refurbs unlock >$50B
Yamada’s Stars (2024): national 700‑store footprint plus e‑commerce drives category leadership; mobile 5G upgrades and carrier bundles sustain traffic; high‑efficiency appliances and solar/heat‑pump installs show ~30% attach rates; refurbished marketplace taps >400‑store intake into a >$50B global market, house brands add ~4–6ppt gross margin and 12% of appliance revenue.
| Metric | 2024 | Priority |
|---|---|---|
| Store footprint | ~700 | Omnichannel ops |
| Install attach | ~30% | Train crews |
| Refurb market | >$50B | Diagnostics+warranties |
| Private‑label | 12% rev / +4–6ppt GM | SKU scale |
What is included in the product
 Detailed Word Document
In-depth BCG analysis of Yamada Holdings' portfolio, with strategic recommendations for Stars, Cash Cows, Question Marks, and Dogs.

 Customizable Excel Spreadsheet
One-page Yamada Holdings BCG Matrix highlighting priority units and clearing portfolio pain points for C‑level decisions.
Cash Cows

Core in‑store consumer electronics
Core in‑store consumer electronics — TVs, white goods and small appliances — remain cash cows for Yamada, contributing the bulk of its ¥1.1 trillion FY2024 consolidated revenue with in‑store sales still dominant. Yamada’s share is entrenched via ~620 prime urban and suburban stores and broad SKU depth that sustains category leadership. Promotion needs are modest outside year‑end and Golden Week peaks. Margin and cash conversion are driven by tight planograms, vendor funding programs and rigorous shrink control.
Extended warranties & after‑sales service
Extended warranties and after‑sales services are true cash cows for Yamada Holdings: once the service network is set the incremental cost is minimal while margins remain significantly above retail product margins. Attach at checkout is predictable and sticky, supporting recurring revenue and improving customer lifetime value in 2024. Leveraging claims data in 2024 helps price risk more accurately and reduce leakage, so maintaining trust, streamlining claims, and keeping attach scripts sharp preserves margin and penetration.

Delivery, haul‑away & installation
Logistics is a moat in bulky goods for Yamada: delivery, haul‑away and installation generate stable volume and high repeatability, with the segment supporting margin expansion—Yamada Group reported consolidated revenue near ¥1.1 trillion in FY2023 and services drive double‑digit attach rates on large appliances. Routes are largely optimized, and a single truck roll yields add‑on revenue of ¥5,000–¥12,000 on average; investing in routing software and boosting technician utilization by 5–10% can meaningfully lift cash flow.

In‑store vendor marketing & endcaps
Brand partners pay to win the aisle; Yamada monetizes a steady in‑store audience, converting predictable footfall into a tidy annuity—Japan population ~125.5M (2024) underpins retail density. Low operational cost and high predictability make margins resilient; enforce firm rate cards and allocate endcap space by measurable ROI, not politics.
- Paid placement: direct revenue stream
- Steady footfall: predictable annuity
- Low ops cost: high margin
- Policy: firm rate cards, ROI allocation
Store credit & basic financing
Private-label credit and simple installment plans at Yamada Holdings act as cash cows, delivering steady fee and interest income with limited growth CAPEX; industry practice in 2024 shows retail card units driving high-margin financing revenue while requiring minimal reinvestment. Approval funnels are standardized and risk‑managed, enabling consistent charge-off control and predictable cash generation. Cross‑sell conversion to extended warranties and accessories remains a proven uplifter; maintain strict underwriting and minimize POS friction to protect net yield.
- 2024: standardized approvals, low incremental capex
- High-margin recurring financing revenue
- Cross-sell to warranty/accessories boosts ARPU
- Key actions: underwriting discipline, minimal POS friction
¥1.1T from 620 stores: warranties, logistics and credit power high-margin growth
Core in‑store electronics remain cash cows, driving the bulk of ¥1.1 trillion FY2024 revenue via ≈620 stores. Extended warranties and after‑sales yield high margins with attach rates >10% in 2024. Logistics (delivery/installation) generates ¥5,000–¥12,000 add‑on per truck roll. Private‑label credit supplies steady high‑margin financing income with low incremental CAPEX.
| Category | 2024 metric | Margin/Notes |
|---|---|---|
| In‑store sales | Bulk of ¥1.1T | High, low promo |
| Warranties | Attach >10% | High margin |
| Logistics | ¥5k–¥12k/roll | Repeatable |
| Credit | Steady fee income | Low CAPEX |
What You’re Viewing Is Included
Yamada Holdings BCG Matrix
The file you're previewing is the exact Yamada Holdings BCG Matrix you'll receive after purchase. No watermarks, no placeholder content—just a fully formatted, analysis-ready report built for strategic clarity. After buying, the complete document is instantly downloadable and editable, ready for presentations, planning, or client decks. This is the real deliverable—no surprises, no extra revisions required.

Actionable Strategy Starts Here
Quick snapshot: Yamada Holdings’ BCG Matrix shows where products are winning, where they’re sucking cash, and which ones could explode with the right push. This preview teases quadrant placements and high-level moves, but the full BCG Matrix gives you the quadrant-by-quadrant breakdown, data-backed recommendations, and ready-to-use Word and Excel deliverables. Buy the complete report to skip the guesswork and get a strategic roadmap you can act on—fast.
Stars
Omnichannel electronics retail engine
In 2024 Yamada Holdings leverages its national footprint plus a strong e-commerce funnel to lead a fast-shifting electronics market. Click-and-collect, ship-from-store and endless-aisle give it operational leverage to convert physical traffic into online sales. The category is still growing online and Yamada already owns significant customer touchpoints. Priorities: inventory velocity, app stickiness and data-driven promotions to monetize owned traffic.
Smart home & energy solutions bundles
Heat‑pump ACs, high‑efficiency appliances and solar+storage with pro install saw sharply rising demand in 2024; Yamada can leverage its ~700‑store footprint (2024) and in‑store tech advisors to capture point‑of‑need sales. Attach rates on installation and maintenance ran near 30% in 2024, keeping LTV high. Pour capex into trained crews and installer partnerships while growth is hot.
Private‑label appliances with installation
House brands ride Yamada’s shelf dominance and price control, with private‑label appliances delivering roughly 4–6 percentage points higher gross margins and accounting for about 12% of appliance revenue in 2024. Attach services (installation/warranty) boost cash conversion by accelerating upfront receipts and raised service attach to ~18% of units. The value segment expanded in 2024 as wallet pressure grew; scale SKUs, defend quality and keep supply tight to avoid stock‑outs.
Mobile devices with carrier tie‑ups
Mobile devices with carrier tie‑ups remain Stars for Yamada: 5G upgrades and standard 3‑year device cycles keep steady footfall, with the majority of smartphone sales 5G‑capable in 2024, and carrier bundles/trade‑ins lowering purchase friction to sustain share. Promotion‑heavy selling yields high-margin cross‑sell opportunities; keep co‑op marketing and counter plan comparison optimized to capture ARPU lift.
- 5G majority in 2024
- Carrier bundles + trade‑ins = higher share
- Promotion drives traffic for cross‑sell
- Maintain co‑op marketing & counter plan tools
Refurb & trade‑in marketplace
Stars: Refurb & trade‑in marketplace — used devices are booming as consumers seek value and sustainability; the global refurbished electronics market exceeded $50 billion in 2024. Yamada’s network of over 400 stores and in‑house testing gives scale competitors lack, enabling fast turnaround, pricing power and higher trust. Invest in diagnostics, standardized grading and extended warranties to lock leadership.
- Scale: >400 stores intake
- Market: >$50B (2024)
- Edge: fast turnaround = pricing power
- Capex: diagnostics, grading, warranties
Scale: 700 stores, 5G bundles, refurbs unlock >$50B
Yamada’s Stars (2024): national 700‑store footprint plus e‑commerce drives category leadership; mobile 5G upgrades and carrier bundles sustain traffic; high‑efficiency appliances and solar/heat‑pump installs show ~30% attach rates; refurbished marketplace taps >400‑store intake into a >$50B global market, house brands add ~4–6ppt gross margin and 12% of appliance revenue.
| Metric | 2024 | Priority |
|---|---|---|
| Store footprint | ~700 | Omnichannel ops |
| Install attach | ~30% | Train crews |
| Refurb market | >$50B | Diagnostics+warranties |
| Private‑label | 12% rev / +4–6ppt GM | SKU scale |
What is included in the product
Detailed Word Document
In-depth BCG analysis of Yamada Holdings' portfolio, with strategic recommendations for Stars, Cash Cows, Question Marks, and Dogs.
Customizable Excel Spreadsheet
One-page Yamada Holdings BCG Matrix highlighting priority units and clearing portfolio pain points for C‑level decisions.
Cash Cows
Core in‑store consumer electronics
Core in‑store consumer electronics — TVs, white goods and small appliances — remain cash cows for Yamada, contributing the bulk of its ¥1.1 trillion FY2024 consolidated revenue with in‑store sales still dominant. Yamada’s share is entrenched via ~620 prime urban and suburban stores and broad SKU depth that sustains category leadership. Promotion needs are modest outside year‑end and Golden Week peaks. Margin and cash conversion are driven by tight planograms, vendor funding programs and rigorous shrink control.
Extended warranties & after‑sales service
Extended warranties and after‑sales services are true cash cows for Yamada Holdings: once the service network is set the incremental cost is minimal while margins remain significantly above retail product margins. Attach at checkout is predictable and sticky, supporting recurring revenue and improving customer lifetime value in 2024. Leveraging claims data in 2024 helps price risk more accurately and reduce leakage, so maintaining trust, streamlining claims, and keeping attach scripts sharp preserves margin and penetration.
Delivery, haul‑away & installation
Logistics is a moat in bulky goods for Yamada: delivery, haul‑away and installation generate stable volume and high repeatability, with the segment supporting margin expansion—Yamada Group reported consolidated revenue near ¥1.1 trillion in FY2023 and services drive double‑digit attach rates on large appliances. Routes are largely optimized, and a single truck roll yields add‑on revenue of ¥5,000–¥12,000 on average; investing in routing software and boosting technician utilization by 5–10% can meaningfully lift cash flow.
In‑store vendor marketing & endcaps
Brand partners pay to win the aisle; Yamada monetizes a steady in‑store audience, converting predictable footfall into a tidy annuity—Japan population ~125.5M (2024) underpins retail density. Low operational cost and high predictability make margins resilient; enforce firm rate cards and allocate endcap space by measurable ROI, not politics.
- Paid placement: direct revenue stream
- Steady footfall: predictable annuity
- Low ops cost: high margin
- Policy: firm rate cards, ROI allocation
Store credit & basic financing
Private-label credit and simple installment plans at Yamada Holdings act as cash cows, delivering steady fee and interest income with limited growth CAPEX; industry practice in 2024 shows retail card units driving high-margin financing revenue while requiring minimal reinvestment. Approval funnels are standardized and risk‑managed, enabling consistent charge-off control and predictable cash generation. Cross‑sell conversion to extended warranties and accessories remains a proven uplifter; maintain strict underwriting and minimize POS friction to protect net yield.
- 2024: standardized approvals, low incremental capex
- High-margin recurring financing revenue
- Cross-sell to warranty/accessories boosts ARPU
- Key actions: underwriting discipline, minimal POS friction
¥1.1T from 620 stores: warranties, logistics and credit power high-margin growth
Core in‑store electronics remain cash cows, driving the bulk of ¥1.1 trillion FY2024 revenue via ≈620 stores. Extended warranties and after‑sales yield high margins with attach rates >10% in 2024. Logistics (delivery/installation) generates ¥5,000–¥12,000 add‑on per truck roll. Private‑label credit supplies steady high‑margin financing income with low incremental CAPEX.
| Category | 2024 metric | Margin/Notes |
|---|---|---|
| In‑store sales | Bulk of ¥1.1T | High, low promo |
| Warranties | Attach >10% | High margin |
| Logistics | ¥5k–¥12k/roll | Repeatable |
| Credit | Steady fee income | Low CAPEX |
What You’re Viewing Is Included
Yamada Holdings BCG Matrix
The file you're previewing is the exact Yamada Holdings BCG Matrix you'll receive after purchase. No watermarks, no placeholder content—just a fully formatted, analysis-ready report built for strategic clarity. After buying, the complete document is instantly downloadable and editable, ready for presentations, planning, or client decks. This is the real deliverable—no surprises, no extra revisions required.
Original: $10.00
-65%$10.00
$3.50Description
Actionable Strategy Starts Here
Quick snapshot: Yamada Holdings’ BCG Matrix shows where products are winning, where they’re sucking cash, and which ones could explode with the right push. This preview teases quadrant placements and high-level moves, but the full BCG Matrix gives you the quadrant-by-quadrant breakdown, data-backed recommendations, and ready-to-use Word and Excel deliverables. Buy the complete report to skip the guesswork and get a strategic roadmap you can act on—fast.
Stars
Omnichannel electronics retail engine
In 2024 Yamada Holdings leverages its national footprint plus a strong e-commerce funnel to lead a fast-shifting electronics market. Click-and-collect, ship-from-store and endless-aisle give it operational leverage to convert physical traffic into online sales. The category is still growing online and Yamada already owns significant customer touchpoints. Priorities: inventory velocity, app stickiness and data-driven promotions to monetize owned traffic.
Smart home & energy solutions bundles
Heat‑pump ACs, high‑efficiency appliances and solar+storage with pro install saw sharply rising demand in 2024; Yamada can leverage its ~700‑store footprint (2024) and in‑store tech advisors to capture point‑of‑need sales. Attach rates on installation and maintenance ran near 30% in 2024, keeping LTV high. Pour capex into trained crews and installer partnerships while growth is hot.
Private‑label appliances with installation
House brands ride Yamada’s shelf dominance and price control, with private‑label appliances delivering roughly 4–6 percentage points higher gross margins and accounting for about 12% of appliance revenue in 2024. Attach services (installation/warranty) boost cash conversion by accelerating upfront receipts and raised service attach to ~18% of units. The value segment expanded in 2024 as wallet pressure grew; scale SKUs, defend quality and keep supply tight to avoid stock‑outs.
Mobile devices with carrier tie‑ups
Mobile devices with carrier tie‑ups remain Stars for Yamada: 5G upgrades and standard 3‑year device cycles keep steady footfall, with the majority of smartphone sales 5G‑capable in 2024, and carrier bundles/trade‑ins lowering purchase friction to sustain share. Promotion‑heavy selling yields high-margin cross‑sell opportunities; keep co‑op marketing and counter plan comparison optimized to capture ARPU lift.
- 5G majority in 2024
- Carrier bundles + trade‑ins = higher share
- Promotion drives traffic for cross‑sell
- Maintain co‑op marketing & counter plan tools
Refurb & trade‑in marketplace
Stars: Refurb & trade‑in marketplace — used devices are booming as consumers seek value and sustainability; the global refurbished electronics market exceeded $50 billion in 2024. Yamada’s network of over 400 stores and in‑house testing gives scale competitors lack, enabling fast turnaround, pricing power and higher trust. Invest in diagnostics, standardized grading and extended warranties to lock leadership.
- Scale: >400 stores intake
- Market: >$50B (2024)
- Edge: fast turnaround = pricing power
- Capex: diagnostics, grading, warranties
Scale: 700 stores, 5G bundles, refurbs unlock >$50B
Yamada’s Stars (2024): national 700‑store footprint plus e‑commerce drives category leadership; mobile 5G upgrades and carrier bundles sustain traffic; high‑efficiency appliances and solar/heat‑pump installs show ~30% attach rates; refurbished marketplace taps >400‑store intake into a >$50B global market, house brands add ~4–6ppt gross margin and 12% of appliance revenue.
| Metric | 2024 | Priority |
|---|---|---|
| Store footprint | ~700 | Omnichannel ops |
| Install attach | ~30% | Train crews |
| Refurb market | >$50B | Diagnostics+warranties |
| Private‑label | 12% rev / +4–6ppt GM | SKU scale |
What is included in the product
Detailed Word Document
In-depth BCG analysis of Yamada Holdings' portfolio, with strategic recommendations for Stars, Cash Cows, Question Marks, and Dogs.
Customizable Excel Spreadsheet
One-page Yamada Holdings BCG Matrix highlighting priority units and clearing portfolio pain points for C‑level decisions.
Cash Cows
Core in‑store consumer electronics
Core in‑store consumer electronics — TVs, white goods and small appliances — remain cash cows for Yamada, contributing the bulk of its ¥1.1 trillion FY2024 consolidated revenue with in‑store sales still dominant. Yamada’s share is entrenched via ~620 prime urban and suburban stores and broad SKU depth that sustains category leadership. Promotion needs are modest outside year‑end and Golden Week peaks. Margin and cash conversion are driven by tight planograms, vendor funding programs and rigorous shrink control.
Extended warranties & after‑sales service
Extended warranties and after‑sales services are true cash cows for Yamada Holdings: once the service network is set the incremental cost is minimal while margins remain significantly above retail product margins. Attach at checkout is predictable and sticky, supporting recurring revenue and improving customer lifetime value in 2024. Leveraging claims data in 2024 helps price risk more accurately and reduce leakage, so maintaining trust, streamlining claims, and keeping attach scripts sharp preserves margin and penetration.
Delivery, haul‑away & installation
Logistics is a moat in bulky goods for Yamada: delivery, haul‑away and installation generate stable volume and high repeatability, with the segment supporting margin expansion—Yamada Group reported consolidated revenue near ¥1.1 trillion in FY2023 and services drive double‑digit attach rates on large appliances. Routes are largely optimized, and a single truck roll yields add‑on revenue of ¥5,000–¥12,000 on average; investing in routing software and boosting technician utilization by 5–10% can meaningfully lift cash flow.
In‑store vendor marketing & endcaps
Brand partners pay to win the aisle; Yamada monetizes a steady in‑store audience, converting predictable footfall into a tidy annuity—Japan population ~125.5M (2024) underpins retail density. Low operational cost and high predictability make margins resilient; enforce firm rate cards and allocate endcap space by measurable ROI, not politics.
- Paid placement: direct revenue stream
- Steady footfall: predictable annuity
- Low ops cost: high margin
- Policy: firm rate cards, ROI allocation
Store credit & basic financing
Private-label credit and simple installment plans at Yamada Holdings act as cash cows, delivering steady fee and interest income with limited growth CAPEX; industry practice in 2024 shows retail card units driving high-margin financing revenue while requiring minimal reinvestment. Approval funnels are standardized and risk‑managed, enabling consistent charge-off control and predictable cash generation. Cross‑sell conversion to extended warranties and accessories remains a proven uplifter; maintain strict underwriting and minimize POS friction to protect net yield.
- 2024: standardized approvals, low incremental capex
- High-margin recurring financing revenue
- Cross-sell to warranty/accessories boosts ARPU
- Key actions: underwriting discipline, minimal POS friction
¥1.1T from 620 stores: warranties, logistics and credit power high-margin growth
Core in‑store electronics remain cash cows, driving the bulk of ¥1.1 trillion FY2024 revenue via ≈620 stores. Extended warranties and after‑sales yield high margins with attach rates >10% in 2024. Logistics (delivery/installation) generates ¥5,000–¥12,000 add‑on per truck roll. Private‑label credit supplies steady high‑margin financing income with low incremental CAPEX.
| Category | 2024 metric | Margin/Notes |
|---|---|---|
| In‑store sales | Bulk of ¥1.1T | High, low promo |
| Warranties | Attach >10% | High margin |
| Logistics | ¥5k–¥12k/roll | Repeatable |
| Credit | Steady fee income | Low CAPEX |
What You’re Viewing Is Included
Yamada Holdings BCG Matrix
The file you're previewing is the exact Yamada Holdings BCG Matrix you'll receive after purchase. No watermarks, no placeholder content—just a fully formatted, analysis-ready report built for strategic clarity. After buying, the complete document is instantly downloadable and editable, ready for presentations, planning, or client decks. This is the real deliverable—no surprises, no extra revisions required.











