Yingli Solar Business Model Canvas

Solar manufacturer Business Model Canvas: integrated manufacturing, partners, revenue drivers
Explore Yingli Solar’s Business Model Canvas to uncover how the company creates value through integrated manufacturing, strategic partnerships, and global distribution. This concise snapshot highlights customer segments, revenue streams, and cost drivers that sustain scale. Ideal for investors and strategists seeking practical insights. Purchase the full canvas for a downloadable, section-by-section strategic guide.
Partnerships

Polysilicon and wafer suppliers
Securing reliable polysilicon and wafer suppliers ensures consistent module quality and tighter cost control, crucial as polysilicon and wafer inputs drive a large share of module BOM costs. Long-term supply agreements hedge commodity volatility and help stabilize margins across cycles, especially amid 2024 market swings. Close supplier collaboration enables process alignment and yield improvements on production lines. Co-development partnerships can unlock higher-efficiency cell architectures and material-led gains.
Equipment and technology providers
Partnerships with tool makers let Yingli deploy advanced cell lines and drive throughput gains, leveraging historical manufacturing scale (Yingli reached over 5 GW nameplate capacity in past years) to ramp output. Joint pilots with equipment vendors shorten time-to-market for new processes, accelerating commercialization timelines. Access to proprietary equipment improves conversion efficiency and lowers customer LCOE, while service agreements and SLAs minimize factory downtime and maintain yield stability.

EPCs and project developers
Partnering with EPCs embeds Yingli modules into bankable system designs, leveraging EPC engineering to meet lender technical due diligence as global cumulative PV capacity surpassed 1 TW by 2024. Co-bidding on utility and C&I tenders has raised win rates (about 20% uplift in comparable collaborations). Tight forecasting and coordinated logistics cut project delays and site hold-ups, while EPC feedback loops accelerate product roadmaps and BOS cost optimization.

Distributors and installers
Regional distributors and certified installers extend Yingli Solar into residential and SME segments, leveraging local licensing and service networks to increase rooftop adoption in 2024.
Stocking programs at regional hubs improve availability and delivery times, while training and co-marketing with partners drive pull-through demand and brand preference.
Integrated after-sales coordination and warranty handling boost customer satisfaction and referrals, reinforcing channel retention and repeat business.
- Regional reach: local licensing and service networks
- Stocking: regional hubs for faster delivery
- Training & co-marketing: boost pull-through demand
- After-sales: warranty coordination increases referrals
Financial and policy stakeholders
Relationships with banks and insurers bolster project bankability, often cutting financing spreads and lowering capital costs by roughly 1–3 percentage points; collaboration with standards bodies ensures IEC/UL certifications and smoother market access. Active policy engagement influences tariffs, feed-in rates and compliance, while green finance channels—part of a global sustainable finance market exceeding $500 billion in 2024—accelerate deployments.
- Bank/insurer support: reduces risk, lowers spreads
- Standards: IEC/UL certification = market access
- Policy: shapes tariffs, incentives
- Green finance: >$500bn 2024, cuts capital costs 1–3ppt
Supply security, scale and green finance cut costs and boost PV tender wins
Securing long-term polysilicon/wafer supply and tool-maker co-development stabilizes costs and boosts yield; Yingli leveraged >5 GW nameplate scale. EPC and distributor partnerships improved tender win rates ~20% and accelerated market reach as global PV surpassed 1 TW in 2024. Bank/insurer and green finance links (global sustainable finance >$500bn in 2024) cut capital spreads ~1–3 ppt.
| Metric | Value |
|---|---|
| Nameplate capacity | >5 GW |
| Global PV | >1 TW (2024) |
| Tender win uplift | ~20% |
| Green finance | >$500bn (2024) |
| Financing spread reduction | 1–3 ppt |
What is included in the product
 Detailed Word Document
A comprehensive, pre-written Business Model Canvas for Yingli Solar that maps customer segments, channels, value propositions, key activities, partners, resources, cost structure and revenue streams into nine cohesive blocks. Ideal for presentations and investor discussions, it reflects real-world operations, competitive advantages, and includes linked SWOT insights to support strategic decisions and validation.

 Customizable Excel Spreadsheet
High-level, editable Business Model Canvas for Yingli Solar that isolates core value propositions, cost drivers, and revenue streams to quickly relieve strategic blind spots. Ideal for teams and boardrooms—saves hours of setup and makes stakeholder alignment and competitive comparison fast and actionable.
Activities

PV module manufacturing
High-volume production of mono PERC and newer cell technologies, with commercial mono PERC module efficiencies around 20–22% in 2024, underpins Yingli Solar’s revenue base. Rigorous quality assurance and yield management protect 25-year performance and product warranties and limit field failure costs. Continuous process optimization targets steady cost-per-watt reduction, while capacity planning is synchronized with market cycles and tender schedules.
R&D and product innovation
Yingli's R&D focuses on higher-efficiency cells and modules—industry average mono-crystalline module efficiency reached about 21% in 2024—sustaining competitiveness in utility and rooftop markets. Rigorous IEC reliability testing improves field performance and bankability. BOM engineering reduces cost, boosts durability and recyclability. Roadmapping aligns product specs with evolving utility and rooftop requirements.

Global supply chain management
Multi-region sourcing (reducing reliance on China, which accounted for about 80% of PV module manufacturing in 2024) mitigates geopolitical and tariff risks while preserving supply continuity. Rigorous inventory and logistics planning target on-time delivery for projects and reduce lead times. Strict compliance with trade, ESG, and customs rules preserves market access. Ongoing supplier development raises quality and resilience across the chain.

Sales, tendering, and channel enablement
Responding to utility RFPs and framework agreements drives volume and secured project pipelines, with utility tenders accounting for the majority of large-scale procurement in 2024.
Channel training and certification expand downstream capability among installers and developers, while pricing and contracting optimize risk allocation and cash conversion cycles.
Targeted marketing sustains brand preference with developers and installers, supporting tender win rates and aftermarket sales.
- RFPs: volume-driven
- Training: installer capability
- Pricing: risk vs cash conversion
- Marketing: brand preference
After-sales service and warranties
After-sales service and warranties anchor Yingli’s financing and long-term value: industry-standard 25-year performance guarantees and typical 10-year product warranties support project lenders and investors. Fast claims handling and 48–72 hour field-response SLAs protect reputation and reduce downtime. Remote monitoring and analytics (typical module degradation ~0.5%/yr) drive product improvements. Fee-based service tiers create upsell and retention opportunities.
- Warranties: 25-year performance, 10-year product
- Claims: 48–72h SLA
- Analytics: ~0.5%/yr degradation data
- Services: paid O&M upsell, retention
High-volume PERC modules (20–22% eff), 25-yr warranty, 48–72h claims SLA, yield & R&D cut LCOE
High-volume mono PERC production (module efficiency 20–22% in 2024) and yield management secure revenues and 25-year performance guarantees. R&D on higher-efficiency cells, IEC reliability testing and BOM optimization reduce LCOE and failure rates. Multi-region sourcing (China ~80% of manufacturing in 2024), tender-driven sales and 48–72h claims SLAs sustain market access and bankability.
| Metric | 2024 |
|---|---|
| Module eff. | 20–22% |
| China share | ~80% |
| Warranty | 25 yr |
| Degradation | ~0.5%/yr |
| Claims SLA | 48–72h |
Preview Before You Purchase
Business Model Canvas
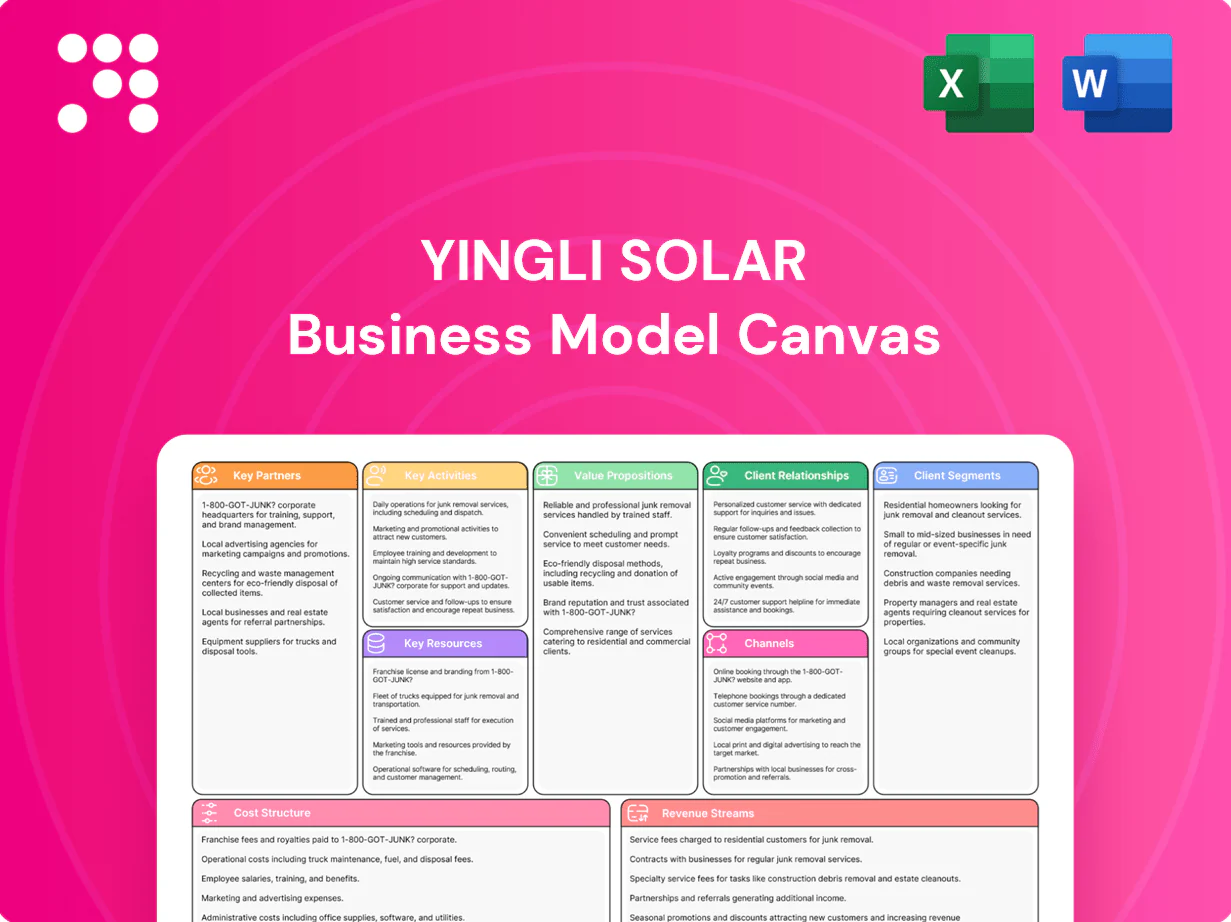
The Yingli Solar Business Model Canvas previewed here is the exact deliverable you'll receive—no mockups or samples. Upon purchase you'll get this same complete, editable document in Word and Excel, formatted and structured exactly as shown. It's ready for presentation, analysis, and customization.

Solar manufacturer Business Model Canvas: integrated manufacturing, partners, revenue drivers
Explore Yingli Solar’s Business Model Canvas to uncover how the company creates value through integrated manufacturing, strategic partnerships, and global distribution. This concise snapshot highlights customer segments, revenue streams, and cost drivers that sustain scale. Ideal for investors and strategists seeking practical insights. Purchase the full canvas for a downloadable, section-by-section strategic guide.
Partnerships
Polysilicon and wafer suppliers
Securing reliable polysilicon and wafer suppliers ensures consistent module quality and tighter cost control, crucial as polysilicon and wafer inputs drive a large share of module BOM costs. Long-term supply agreements hedge commodity volatility and help stabilize margins across cycles, especially amid 2024 market swings. Close supplier collaboration enables process alignment and yield improvements on production lines. Co-development partnerships can unlock higher-efficiency cell architectures and material-led gains.
Equipment and technology providers
Partnerships with tool makers let Yingli deploy advanced cell lines and drive throughput gains, leveraging historical manufacturing scale (Yingli reached over 5 GW nameplate capacity in past years) to ramp output. Joint pilots with equipment vendors shorten time-to-market for new processes, accelerating commercialization timelines. Access to proprietary equipment improves conversion efficiency and lowers customer LCOE, while service agreements and SLAs minimize factory downtime and maintain yield stability.
EPCs and project developers
Partnering with EPCs embeds Yingli modules into bankable system designs, leveraging EPC engineering to meet lender technical due diligence as global cumulative PV capacity surpassed 1 TW by 2024. Co-bidding on utility and C&I tenders has raised win rates (about 20% uplift in comparable collaborations). Tight forecasting and coordinated logistics cut project delays and site hold-ups, while EPC feedback loops accelerate product roadmaps and BOS cost optimization.
Distributors and installers
Regional distributors and certified installers extend Yingli Solar into residential and SME segments, leveraging local licensing and service networks to increase rooftop adoption in 2024.
Stocking programs at regional hubs improve availability and delivery times, while training and co-marketing with partners drive pull-through demand and brand preference.
Integrated after-sales coordination and warranty handling boost customer satisfaction and referrals, reinforcing channel retention and repeat business.
- Regional reach: local licensing and service networks
- Stocking: regional hubs for faster delivery
- Training & co-marketing: boost pull-through demand
- After-sales: warranty coordination increases referrals
Financial and policy stakeholders
Relationships with banks and insurers bolster project bankability, often cutting financing spreads and lowering capital costs by roughly 1–3 percentage points; collaboration with standards bodies ensures IEC/UL certifications and smoother market access. Active policy engagement influences tariffs, feed-in rates and compliance, while green finance channels—part of a global sustainable finance market exceeding $500 billion in 2024—accelerate deployments.
- Bank/insurer support: reduces risk, lowers spreads
- Standards: IEC/UL certification = market access
- Policy: shapes tariffs, incentives
- Green finance: >$500bn 2024, cuts capital costs 1–3ppt
Supply security, scale and green finance cut costs and boost PV tender wins
Securing long-term polysilicon/wafer supply and tool-maker co-development stabilizes costs and boosts yield; Yingli leveraged >5 GW nameplate scale. EPC and distributor partnerships improved tender win rates ~20% and accelerated market reach as global PV surpassed 1 TW in 2024. Bank/insurer and green finance links (global sustainable finance >$500bn in 2024) cut capital spreads ~1–3 ppt.
| Metric | Value |
|---|---|
| Nameplate capacity | >5 GW |
| Global PV | >1 TW (2024) |
| Tender win uplift | ~20% |
| Green finance | >$500bn (2024) |
| Financing spread reduction | 1–3 ppt |
What is included in the product
Detailed Word Document
A comprehensive, pre-written Business Model Canvas for Yingli Solar that maps customer segments, channels, value propositions, key activities, partners, resources, cost structure and revenue streams into nine cohesive blocks. Ideal for presentations and investor discussions, it reflects real-world operations, competitive advantages, and includes linked SWOT insights to support strategic decisions and validation.
Customizable Excel Spreadsheet
High-level, editable Business Model Canvas for Yingli Solar that isolates core value propositions, cost drivers, and revenue streams to quickly relieve strategic blind spots. Ideal for teams and boardrooms—saves hours of setup and makes stakeholder alignment and competitive comparison fast and actionable.
Activities
PV module manufacturing
High-volume production of mono PERC and newer cell technologies, with commercial mono PERC module efficiencies around 20–22% in 2024, underpins Yingli Solar’s revenue base. Rigorous quality assurance and yield management protect 25-year performance and product warranties and limit field failure costs. Continuous process optimization targets steady cost-per-watt reduction, while capacity planning is synchronized with market cycles and tender schedules.
R&D and product innovation
Yingli's R&D focuses on higher-efficiency cells and modules—industry average mono-crystalline module efficiency reached about 21% in 2024—sustaining competitiveness in utility and rooftop markets. Rigorous IEC reliability testing improves field performance and bankability. BOM engineering reduces cost, boosts durability and recyclability. Roadmapping aligns product specs with evolving utility and rooftop requirements.
Global supply chain management
Multi-region sourcing (reducing reliance on China, which accounted for about 80% of PV module manufacturing in 2024) mitigates geopolitical and tariff risks while preserving supply continuity. Rigorous inventory and logistics planning target on-time delivery for projects and reduce lead times. Strict compliance with trade, ESG, and customs rules preserves market access. Ongoing supplier development raises quality and resilience across the chain.
Sales, tendering, and channel enablement
Responding to utility RFPs and framework agreements drives volume and secured project pipelines, with utility tenders accounting for the majority of large-scale procurement in 2024.
Channel training and certification expand downstream capability among installers and developers, while pricing and contracting optimize risk allocation and cash conversion cycles.
Targeted marketing sustains brand preference with developers and installers, supporting tender win rates and aftermarket sales.
- RFPs: volume-driven
- Training: installer capability
- Pricing: risk vs cash conversion
- Marketing: brand preference
After-sales service and warranties
After-sales service and warranties anchor Yingli’s financing and long-term value: industry-standard 25-year performance guarantees and typical 10-year product warranties support project lenders and investors. Fast claims handling and 48–72 hour field-response SLAs protect reputation and reduce downtime. Remote monitoring and analytics (typical module degradation ~0.5%/yr) drive product improvements. Fee-based service tiers create upsell and retention opportunities.
- Warranties: 25-year performance, 10-year product
- Claims: 48–72h SLA
- Analytics: ~0.5%/yr degradation data
- Services: paid O&M upsell, retention
High-volume PERC modules (20–22% eff), 25-yr warranty, 48–72h claims SLA, yield & R&D cut LCOE
High-volume mono PERC production (module efficiency 20–22% in 2024) and yield management secure revenues and 25-year performance guarantees. R&D on higher-efficiency cells, IEC reliability testing and BOM optimization reduce LCOE and failure rates. Multi-region sourcing (China ~80% of manufacturing in 2024), tender-driven sales and 48–72h claims SLAs sustain market access and bankability.
| Metric | 2024 |
|---|---|
| Module eff. | 20–22% |
| China share | ~80% |
| Warranty | 25 yr |
| Degradation | ~0.5%/yr |
| Claims SLA | 48–72h |
Preview Before You Purchase
Business Model Canvas
The Yingli Solar Business Model Canvas previewed here is the exact deliverable you'll receive—no mockups or samples. Upon purchase you'll get this same complete, editable document in Word and Excel, formatted and structured exactly as shown. It's ready for presentation, analysis, and customization.
Original: $10.00
-65%$10.00
$3.50Description
Solar manufacturer Business Model Canvas: integrated manufacturing, partners, revenue drivers
Explore Yingli Solar’s Business Model Canvas to uncover how the company creates value through integrated manufacturing, strategic partnerships, and global distribution. This concise snapshot highlights customer segments, revenue streams, and cost drivers that sustain scale. Ideal for investors and strategists seeking practical insights. Purchase the full canvas for a downloadable, section-by-section strategic guide.
Partnerships
Polysilicon and wafer suppliers
Securing reliable polysilicon and wafer suppliers ensures consistent module quality and tighter cost control, crucial as polysilicon and wafer inputs drive a large share of module BOM costs. Long-term supply agreements hedge commodity volatility and help stabilize margins across cycles, especially amid 2024 market swings. Close supplier collaboration enables process alignment and yield improvements on production lines. Co-development partnerships can unlock higher-efficiency cell architectures and material-led gains.
Equipment and technology providers
Partnerships with tool makers let Yingli deploy advanced cell lines and drive throughput gains, leveraging historical manufacturing scale (Yingli reached over 5 GW nameplate capacity in past years) to ramp output. Joint pilots with equipment vendors shorten time-to-market for new processes, accelerating commercialization timelines. Access to proprietary equipment improves conversion efficiency and lowers customer LCOE, while service agreements and SLAs minimize factory downtime and maintain yield stability.
EPCs and project developers
Partnering with EPCs embeds Yingli modules into bankable system designs, leveraging EPC engineering to meet lender technical due diligence as global cumulative PV capacity surpassed 1 TW by 2024. Co-bidding on utility and C&I tenders has raised win rates (about 20% uplift in comparable collaborations). Tight forecasting and coordinated logistics cut project delays and site hold-ups, while EPC feedback loops accelerate product roadmaps and BOS cost optimization.
Distributors and installers
Regional distributors and certified installers extend Yingli Solar into residential and SME segments, leveraging local licensing and service networks to increase rooftop adoption in 2024.
Stocking programs at regional hubs improve availability and delivery times, while training and co-marketing with partners drive pull-through demand and brand preference.
Integrated after-sales coordination and warranty handling boost customer satisfaction and referrals, reinforcing channel retention and repeat business.
- Regional reach: local licensing and service networks
- Stocking: regional hubs for faster delivery
- Training & co-marketing: boost pull-through demand
- After-sales: warranty coordination increases referrals
Financial and policy stakeholders
Relationships with banks and insurers bolster project bankability, often cutting financing spreads and lowering capital costs by roughly 1–3 percentage points; collaboration with standards bodies ensures IEC/UL certifications and smoother market access. Active policy engagement influences tariffs, feed-in rates and compliance, while green finance channels—part of a global sustainable finance market exceeding $500 billion in 2024—accelerate deployments.
- Bank/insurer support: reduces risk, lowers spreads
- Standards: IEC/UL certification = market access
- Policy: shapes tariffs, incentives
- Green finance: >$500bn 2024, cuts capital costs 1–3ppt
Supply security, scale and green finance cut costs and boost PV tender wins
Securing long-term polysilicon/wafer supply and tool-maker co-development stabilizes costs and boosts yield; Yingli leveraged >5 GW nameplate scale. EPC and distributor partnerships improved tender win rates ~20% and accelerated market reach as global PV surpassed 1 TW in 2024. Bank/insurer and green finance links (global sustainable finance >$500bn in 2024) cut capital spreads ~1–3 ppt.
| Metric | Value |
|---|---|
| Nameplate capacity | >5 GW |
| Global PV | >1 TW (2024) |
| Tender win uplift | ~20% |
| Green finance | >$500bn (2024) |
| Financing spread reduction | 1–3 ppt |
What is included in the product
Detailed Word Document
A comprehensive, pre-written Business Model Canvas for Yingli Solar that maps customer segments, channels, value propositions, key activities, partners, resources, cost structure and revenue streams into nine cohesive blocks. Ideal for presentations and investor discussions, it reflects real-world operations, competitive advantages, and includes linked SWOT insights to support strategic decisions and validation.
Customizable Excel Spreadsheet
High-level, editable Business Model Canvas for Yingli Solar that isolates core value propositions, cost drivers, and revenue streams to quickly relieve strategic blind spots. Ideal for teams and boardrooms—saves hours of setup and makes stakeholder alignment and competitive comparison fast and actionable.
Activities
PV module manufacturing
High-volume production of mono PERC and newer cell technologies, with commercial mono PERC module efficiencies around 20–22% in 2024, underpins Yingli Solar’s revenue base. Rigorous quality assurance and yield management protect 25-year performance and product warranties and limit field failure costs. Continuous process optimization targets steady cost-per-watt reduction, while capacity planning is synchronized with market cycles and tender schedules.
R&D and product innovation
Yingli's R&D focuses on higher-efficiency cells and modules—industry average mono-crystalline module efficiency reached about 21% in 2024—sustaining competitiveness in utility and rooftop markets. Rigorous IEC reliability testing improves field performance and bankability. BOM engineering reduces cost, boosts durability and recyclability. Roadmapping aligns product specs with evolving utility and rooftop requirements.
Global supply chain management
Multi-region sourcing (reducing reliance on China, which accounted for about 80% of PV module manufacturing in 2024) mitigates geopolitical and tariff risks while preserving supply continuity. Rigorous inventory and logistics planning target on-time delivery for projects and reduce lead times. Strict compliance with trade, ESG, and customs rules preserves market access. Ongoing supplier development raises quality and resilience across the chain.
Sales, tendering, and channel enablement
Responding to utility RFPs and framework agreements drives volume and secured project pipelines, with utility tenders accounting for the majority of large-scale procurement in 2024.
Channel training and certification expand downstream capability among installers and developers, while pricing and contracting optimize risk allocation and cash conversion cycles.
Targeted marketing sustains brand preference with developers and installers, supporting tender win rates and aftermarket sales.
- RFPs: volume-driven
- Training: installer capability
- Pricing: risk vs cash conversion
- Marketing: brand preference
After-sales service and warranties
After-sales service and warranties anchor Yingli’s financing and long-term value: industry-standard 25-year performance guarantees and typical 10-year product warranties support project lenders and investors. Fast claims handling and 48–72 hour field-response SLAs protect reputation and reduce downtime. Remote monitoring and analytics (typical module degradation ~0.5%/yr) drive product improvements. Fee-based service tiers create upsell and retention opportunities.
- Warranties: 25-year performance, 10-year product
- Claims: 48–72h SLA
- Analytics: ~0.5%/yr degradation data
- Services: paid O&M upsell, retention
High-volume PERC modules (20–22% eff), 25-yr warranty, 48–72h claims SLA, yield & R&D cut LCOE
High-volume mono PERC production (module efficiency 20–22% in 2024) and yield management secure revenues and 25-year performance guarantees. R&D on higher-efficiency cells, IEC reliability testing and BOM optimization reduce LCOE and failure rates. Multi-region sourcing (China ~80% of manufacturing in 2024), tender-driven sales and 48–72h claims SLAs sustain market access and bankability.
| Metric | 2024 |
|---|---|
| Module eff. | 20–22% |
| China share | ~80% |
| Warranty | 25 yr |
| Degradation | ~0.5%/yr |
| Claims SLA | 48–72h |
Preview Before You Purchase
Business Model Canvas
The Yingli Solar Business Model Canvas previewed here is the exact deliverable you'll receive—no mockups or samples. Upon purchase you'll get this same complete, editable document in Word and Excel, formatted and structured exactly as shown. It's ready for presentation, analysis, and customization.











