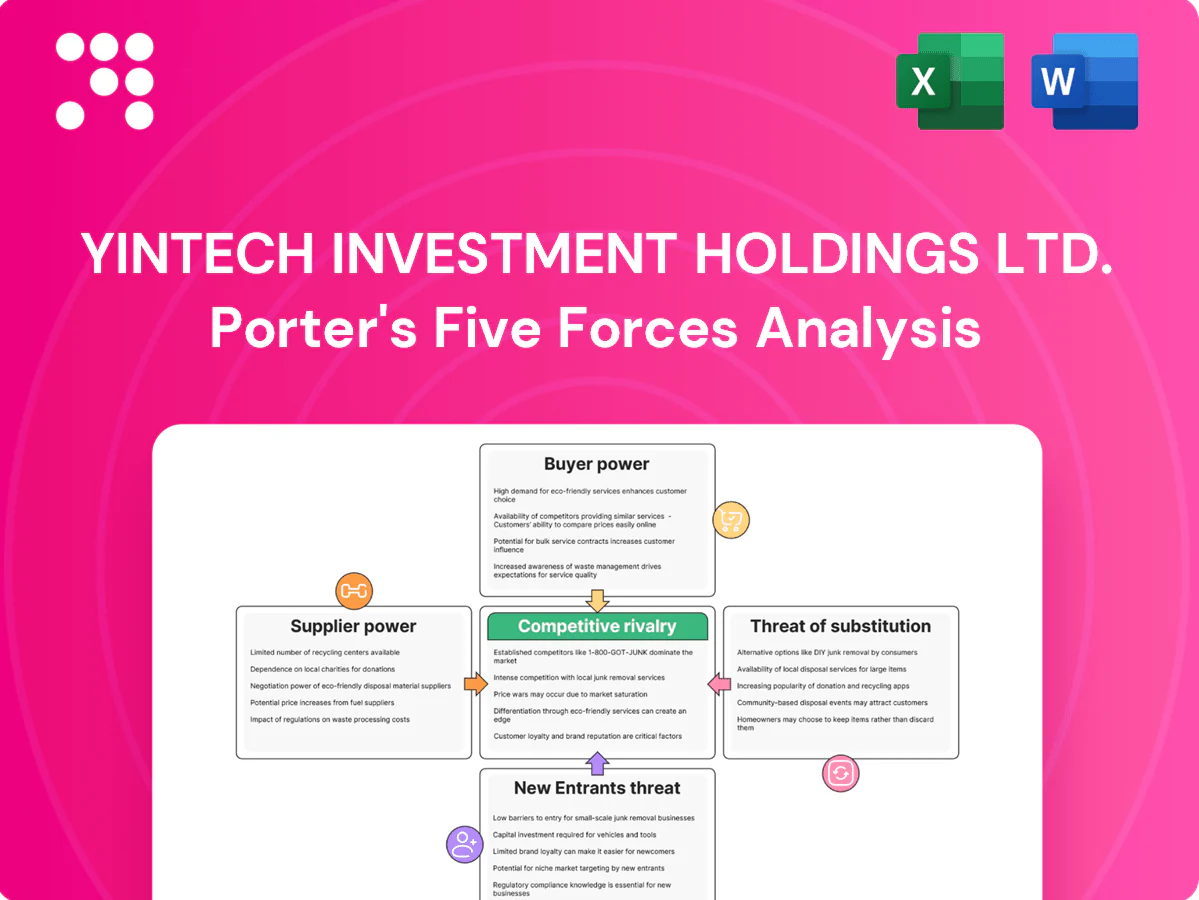
Yintech Investment Holdings Ltd. Porter's Five Forces Analysis

From Overview to Strategy Blueprint
Yintech Investment Holdings Ltd.’s Porter's Five Forces snapshot highlights moderate buyer power, high rivalry from fintech peers, limited supplier leverage, moderate threat of substitutes, and barriers to new entrants tied to regulation and tech scale. This brief teases strategic risks and opportunities; unlock the full Porter's Five Forces Analysis for force-by-force ratings, visuals, and actionable recommendations to inform investment or strategy decisions.
Suppliers Bargaining Power

Dependence on liquidity and market access
Yintech depends on commodity spot venues, liquidity providers and brokers for tight spreads and execution; industry data in 2024 show the top 3 liquidity providers supply roughly 65–75% of retail spot liquidity, so concentration can drive wider spreads or higher fees, while venue connectivity outages directly degrade UX and fill rates; multi-year liquidity agreements are used to stabilize pricing and execution quality.
Critical data and tech infrastructure
Market data vendors, cloud providers and trading-tech firms are essential inputs: Bloomberg terminals cost about $27,000/yr and 2024 cloud market share is ~AWS 32%, Azure 23%, GCP 11%, concentrating leverage with suppliers. Switching core infrastructure often takes 6–12 months and can cost multiple millions, creating high switching risk. Volume-based pricing and data surcharges can compress margins by 10–30% during volatility spikes; multi-vendor strategies reduce single-point dependency.

Payments, custody, and KYC vendors
Payment gateways, banks and identity-verification providers directly affect Yintech’s onboarding speed and per-customer cost, with industry payment decline rates near 4% in 2024 increasing retries and fees. Regulatory-grade KYC/AML services, averaging roughly $60–$80 per onboarding in 2024, can drive process design and expense. Outages or partner compliance changes can stall funding; diversified rails and contingency workflows limit exposure and continuity risk.

Specialized talent and compliance expertise
Experienced engineers, quants, and compliance officers remain scarce in 2024, commanding premiums (often cited near 25–35% over general finance roles), which strengthens supplier (talent) power amid tight labor markets and low vacancy fill rates. Robust knowledge-transfer and retention programs reduce replacement risk, while incremental automation can gradually cut reliance on niche roles.
- 2024 premium: ~25–35%
- Retention reduces churn risk
- Automation lowers niche dependency
- Tight labor market increases supplier power
Regulatory permissions as quasi-suppliers
Licenses and approvals effectively supply Yintech market access, with 2024 regulatory checkpoints determining product scope and distribution channels.
Policy shifts in 2024 raised operating costs and compliance burdens, forcing re-scoping of some consumer finance offerings.
Maintaining strong regulator relationships and a 2024-focused compliance budget reduces risk of abrupt constraints.
- 2024 compliance spend up 20% (peer benchmark)
- Licenses = market access
- Regulatory ties ensure continuity
- Proactive compliance mitigates shutdown risk
Supplier power high — top-3 liquidity 65–75%, cloud 32/23/11%, KYC $60–$80, payments -4%
Supplier power is moderate to high: top-3 liquidity providers supply 65–75% of retail spot liquidity, cloud providers concentrate (AWS 32%, Azure 23%, GCP 11%), KYC costs $60–$80/onboard and payment declines ~4% in 2024, talent premiums 25–35% and compliance spend +20% y/y increase switching costs and margin pressure.
| Item | 2024 Metric |
|---|---|
| Top-3 liquidity share | 65–75% |
| Cloud share (AWS/AZ/GCP) | 32% / 23% / 11% |
| KYC cost | $60–$80 |
| Payment decline | ~4% |
| Talent premium | 25–35% |
| Compliance spend change | +20% y/y |
What is included in the product
 Detailed Word Document
Tailored Porter's Five Forces analysis for Yintech Investment Holdings Ltd., uncovering key competitive drivers, buyer and supplier power, substitutes, and entry barriers; identifies disruptive threats and market dynamics that influence pricing, profitability, and strategic positioning—fully editable for reports, investor materials, and strategy decks.

 Customizable Excel Spreadsheet
A concise one-sheet Porter's Five Forces for Yintech that lets you instantly visualize competitive pressure with a spider chart, customize force levels as market or regulatory shifts occur, and drop into pitch decks—no macros or complex setup, easily swapped with your own data.
Customers Bargaining Power

Retail users face low switching costs
Retail users face low switching costs as competing apps enable quick account creation and transfer of activity, often completed in under 10 minutes, which lowers inertia and raises churn risk.
High price sensitivity to fees and spreads
Active traders closely monitor all-in costs, and the zero-commission trend since 2019 plus ongoing fee compression in 2024 makes even small fee differentials decisive. Transparent fee comparisons and third-party aggregators amplify buyer bargaining power, driving churn toward cheaper platforms. Tiered pricing and volume rebates are commonly used to neutralize defection risks by locking in high-value clients.

Demand for product breadth and tools
Customers now demand multi-asset access, integrated research and analytics; 62% of retail investors rated platform breadth as a top selection factor in 2024. If Yintech’s tool depth lags peers, users can dual-home or defect, raising churn risk. Continuous feature delivery is required to sustain engagement, while strategic partnerships can rapidly expand perceived breadth and address gaps.

Trust and service responsiveness
Retail investors reward platforms that deliver reliable execution and prompt support; in 2024 many brokers adopted 99.9% uptime SLAs to signal reliability. Service outages or trade disputes rapidly erode trust and drive negative reviews; social media amplifies dissatisfaction within hours. Proactive communication and enforceable SLAs materially reduce buyer leverage.
- Retail preference: reliable execution
- Risk: outages erode trust fast
- Amplifier: social media/reviews
- Mitigation: proactive comms + 99.9% SLA
Information-rich, community-influenced buyers
- platform-comparisons
- collective-feedback
- viral-onboarding-swings
- influencer-channeling
Low switching costs (<10-min) and fee sensitivity drive churn; 62% value breadth, 99.9% SLA
Low switching costs (<10-minute onboarding) increase churn risk. Fee sensitivity is high after zero-commission since 2019 and 2024 fee compression — small price gaps drive defections. 62% of retail investors prioritized platform breadth in 2024; ~50% consult online communities, while brokers advertise 99.9% uptime SLAs to retain trust.
| Metric | 2024 value |
|---|---|
| Onboarding time | <10 min |
| Platform breadth importance | 62% |
| Community influence | ~50% |
| SLA adoption | 99.9% |
Preview Before You Purchase
Yintech Investment Holdings Ltd. Porter's Five Forces Analysis
This preview shows the exact document you'll receive immediately after purchase—no surprises, no placeholders. The Yintech Investment Holdings Ltd. Porter's Five Forces analysis assesses competitive rivalry, supplier and buyer power, threats of new entrants and substitutes, and regulatory risks. It delivers concise strategic implications and recommended actions for investors and managers. The file is fully formatted and ready for immediate download and use.

From Overview to Strategy Blueprint
Yintech Investment Holdings Ltd.’s Porter's Five Forces snapshot highlights moderate buyer power, high rivalry from fintech peers, limited supplier leverage, moderate threat of substitutes, and barriers to new entrants tied to regulation and tech scale. This brief teases strategic risks and opportunities; unlock the full Porter's Five Forces Analysis for force-by-force ratings, visuals, and actionable recommendations to inform investment or strategy decisions.
Suppliers Bargaining Power
Dependence on liquidity and market access
Yintech depends on commodity spot venues, liquidity providers and brokers for tight spreads and execution; industry data in 2024 show the top 3 liquidity providers supply roughly 65–75% of retail spot liquidity, so concentration can drive wider spreads or higher fees, while venue connectivity outages directly degrade UX and fill rates; multi-year liquidity agreements are used to stabilize pricing and execution quality.
Critical data and tech infrastructure
Market data vendors, cloud providers and trading-tech firms are essential inputs: Bloomberg terminals cost about $27,000/yr and 2024 cloud market share is ~AWS 32%, Azure 23%, GCP 11%, concentrating leverage with suppliers. Switching core infrastructure often takes 6–12 months and can cost multiple millions, creating high switching risk. Volume-based pricing and data surcharges can compress margins by 10–30% during volatility spikes; multi-vendor strategies reduce single-point dependency.
Payments, custody, and KYC vendors
Payment gateways, banks and identity-verification providers directly affect Yintech’s onboarding speed and per-customer cost, with industry payment decline rates near 4% in 2024 increasing retries and fees. Regulatory-grade KYC/AML services, averaging roughly $60–$80 per onboarding in 2024, can drive process design and expense. Outages or partner compliance changes can stall funding; diversified rails and contingency workflows limit exposure and continuity risk.
Specialized talent and compliance expertise
Experienced engineers, quants, and compliance officers remain scarce in 2024, commanding premiums (often cited near 25–35% over general finance roles), which strengthens supplier (talent) power amid tight labor markets and low vacancy fill rates. Robust knowledge-transfer and retention programs reduce replacement risk, while incremental automation can gradually cut reliance on niche roles.
- 2024 premium: ~25–35%
- Retention reduces churn risk
- Automation lowers niche dependency
- Tight labor market increases supplier power
Regulatory permissions as quasi-suppliers
Licenses and approvals effectively supply Yintech market access, with 2024 regulatory checkpoints determining product scope and distribution channels.
Policy shifts in 2024 raised operating costs and compliance burdens, forcing re-scoping of some consumer finance offerings.
Maintaining strong regulator relationships and a 2024-focused compliance budget reduces risk of abrupt constraints.
- 2024 compliance spend up 20% (peer benchmark)
- Licenses = market access
- Regulatory ties ensure continuity
- Proactive compliance mitigates shutdown risk
Supplier power high — top-3 liquidity 65–75%, cloud 32/23/11%, KYC $60–$80, payments -4%
Supplier power is moderate to high: top-3 liquidity providers supply 65–75% of retail spot liquidity, cloud providers concentrate (AWS 32%, Azure 23%, GCP 11%), KYC costs $60–$80/onboard and payment declines ~4% in 2024, talent premiums 25–35% and compliance spend +20% y/y increase switching costs and margin pressure.
| Item | 2024 Metric |
|---|---|
| Top-3 liquidity share | 65–75% |
| Cloud share (AWS/AZ/GCP) | 32% / 23% / 11% |
| KYC cost | $60–$80 |
| Payment decline | ~4% |
| Talent premium | 25–35% |
| Compliance spend change | +20% y/y |
What is included in the product
Detailed Word Document
Tailored Porter's Five Forces analysis for Yintech Investment Holdings Ltd., uncovering key competitive drivers, buyer and supplier power, substitutes, and entry barriers; identifies disruptive threats and market dynamics that influence pricing, profitability, and strategic positioning—fully editable for reports, investor materials, and strategy decks.
Customizable Excel Spreadsheet
A concise one-sheet Porter's Five Forces for Yintech that lets you instantly visualize competitive pressure with a spider chart, customize force levels as market or regulatory shifts occur, and drop into pitch decks—no macros or complex setup, easily swapped with your own data.
Customers Bargaining Power
Retail users face low switching costs
Retail users face low switching costs as competing apps enable quick account creation and transfer of activity, often completed in under 10 minutes, which lowers inertia and raises churn risk.
High price sensitivity to fees and spreads
Active traders closely monitor all-in costs, and the zero-commission trend since 2019 plus ongoing fee compression in 2024 makes even small fee differentials decisive. Transparent fee comparisons and third-party aggregators amplify buyer bargaining power, driving churn toward cheaper platforms. Tiered pricing and volume rebates are commonly used to neutralize defection risks by locking in high-value clients.
Demand for product breadth and tools
Customers now demand multi-asset access, integrated research and analytics; 62% of retail investors rated platform breadth as a top selection factor in 2024. If Yintech’s tool depth lags peers, users can dual-home or defect, raising churn risk. Continuous feature delivery is required to sustain engagement, while strategic partnerships can rapidly expand perceived breadth and address gaps.
Trust and service responsiveness
Retail investors reward platforms that deliver reliable execution and prompt support; in 2024 many brokers adopted 99.9% uptime SLAs to signal reliability. Service outages or trade disputes rapidly erode trust and drive negative reviews; social media amplifies dissatisfaction within hours. Proactive communication and enforceable SLAs materially reduce buyer leverage.
- Retail preference: reliable execution
- Risk: outages erode trust fast
- Amplifier: social media/reviews
- Mitigation: proactive comms + 99.9% SLA
Information-rich, community-influenced buyers
- platform-comparisons
- collective-feedback
- viral-onboarding-swings
- influencer-channeling
Low switching costs (<10-min) and fee sensitivity drive churn; 62% value breadth, 99.9% SLA
Low switching costs (<10-minute onboarding) increase churn risk. Fee sensitivity is high after zero-commission since 2019 and 2024 fee compression — small price gaps drive defections. 62% of retail investors prioritized platform breadth in 2024; ~50% consult online communities, while brokers advertise 99.9% uptime SLAs to retain trust.
| Metric | 2024 value |
|---|---|
| Onboarding time | <10 min |
| Platform breadth importance | 62% |
| Community influence | ~50% |
| SLA adoption | 99.9% |
Preview Before You Purchase
Yintech Investment Holdings Ltd. Porter's Five Forces Analysis
This preview shows the exact document you'll receive immediately after purchase—no surprises, no placeholders. The Yintech Investment Holdings Ltd. Porter's Five Forces analysis assesses competitive rivalry, supplier and buyer power, threats of new entrants and substitutes, and regulatory risks. It delivers concise strategic implications and recommended actions for investors and managers. The file is fully formatted and ready for immediate download and use.
Original: $10.00
-65%$10.00
$3.50Description
From Overview to Strategy Blueprint
Yintech Investment Holdings Ltd.’s Porter's Five Forces snapshot highlights moderate buyer power, high rivalry from fintech peers, limited supplier leverage, moderate threat of substitutes, and barriers to new entrants tied to regulation and tech scale. This brief teases strategic risks and opportunities; unlock the full Porter's Five Forces Analysis for force-by-force ratings, visuals, and actionable recommendations to inform investment or strategy decisions.
Suppliers Bargaining Power
Dependence on liquidity and market access
Yintech depends on commodity spot venues, liquidity providers and brokers for tight spreads and execution; industry data in 2024 show the top 3 liquidity providers supply roughly 65–75% of retail spot liquidity, so concentration can drive wider spreads or higher fees, while venue connectivity outages directly degrade UX and fill rates; multi-year liquidity agreements are used to stabilize pricing and execution quality.
Critical data and tech infrastructure
Market data vendors, cloud providers and trading-tech firms are essential inputs: Bloomberg terminals cost about $27,000/yr and 2024 cloud market share is ~AWS 32%, Azure 23%, GCP 11%, concentrating leverage with suppliers. Switching core infrastructure often takes 6–12 months and can cost multiple millions, creating high switching risk. Volume-based pricing and data surcharges can compress margins by 10–30% during volatility spikes; multi-vendor strategies reduce single-point dependency.
Payments, custody, and KYC vendors
Payment gateways, banks and identity-verification providers directly affect Yintech’s onboarding speed and per-customer cost, with industry payment decline rates near 4% in 2024 increasing retries and fees. Regulatory-grade KYC/AML services, averaging roughly $60–$80 per onboarding in 2024, can drive process design and expense. Outages or partner compliance changes can stall funding; diversified rails and contingency workflows limit exposure and continuity risk.
Specialized talent and compliance expertise
Experienced engineers, quants, and compliance officers remain scarce in 2024, commanding premiums (often cited near 25–35% over general finance roles), which strengthens supplier (talent) power amid tight labor markets and low vacancy fill rates. Robust knowledge-transfer and retention programs reduce replacement risk, while incremental automation can gradually cut reliance on niche roles.
- 2024 premium: ~25–35%
- Retention reduces churn risk
- Automation lowers niche dependency
- Tight labor market increases supplier power
Regulatory permissions as quasi-suppliers
Licenses and approvals effectively supply Yintech market access, with 2024 regulatory checkpoints determining product scope and distribution channels.
Policy shifts in 2024 raised operating costs and compliance burdens, forcing re-scoping of some consumer finance offerings.
Maintaining strong regulator relationships and a 2024-focused compliance budget reduces risk of abrupt constraints.
- 2024 compliance spend up 20% (peer benchmark)
- Licenses = market access
- Regulatory ties ensure continuity
- Proactive compliance mitigates shutdown risk
Supplier power high — top-3 liquidity 65–75%, cloud 32/23/11%, KYC $60–$80, payments -4%
Supplier power is moderate to high: top-3 liquidity providers supply 65–75% of retail spot liquidity, cloud providers concentrate (AWS 32%, Azure 23%, GCP 11%), KYC costs $60–$80/onboard and payment declines ~4% in 2024, talent premiums 25–35% and compliance spend +20% y/y increase switching costs and margin pressure.
| Item | 2024 Metric |
|---|---|
| Top-3 liquidity share | 65–75% |
| Cloud share (AWS/AZ/GCP) | 32% / 23% / 11% |
| KYC cost | $60–$80 |
| Payment decline | ~4% |
| Talent premium | 25–35% |
| Compliance spend change | +20% y/y |
What is included in the product
Detailed Word Document
Tailored Porter's Five Forces analysis for Yintech Investment Holdings Ltd., uncovering key competitive drivers, buyer and supplier power, substitutes, and entry barriers; identifies disruptive threats and market dynamics that influence pricing, profitability, and strategic positioning—fully editable for reports, investor materials, and strategy decks.
Customizable Excel Spreadsheet
A concise one-sheet Porter's Five Forces for Yintech that lets you instantly visualize competitive pressure with a spider chart, customize force levels as market or regulatory shifts occur, and drop into pitch decks—no macros or complex setup, easily swapped with your own data.
Customers Bargaining Power
Retail users face low switching costs
Retail users face low switching costs as competing apps enable quick account creation and transfer of activity, often completed in under 10 minutes, which lowers inertia and raises churn risk.
High price sensitivity to fees and spreads
Active traders closely monitor all-in costs, and the zero-commission trend since 2019 plus ongoing fee compression in 2024 makes even small fee differentials decisive. Transparent fee comparisons and third-party aggregators amplify buyer bargaining power, driving churn toward cheaper platforms. Tiered pricing and volume rebates are commonly used to neutralize defection risks by locking in high-value clients.
Demand for product breadth and tools
Customers now demand multi-asset access, integrated research and analytics; 62% of retail investors rated platform breadth as a top selection factor in 2024. If Yintech’s tool depth lags peers, users can dual-home or defect, raising churn risk. Continuous feature delivery is required to sustain engagement, while strategic partnerships can rapidly expand perceived breadth and address gaps.
Trust and service responsiveness
Retail investors reward platforms that deliver reliable execution and prompt support; in 2024 many brokers adopted 99.9% uptime SLAs to signal reliability. Service outages or trade disputes rapidly erode trust and drive negative reviews; social media amplifies dissatisfaction within hours. Proactive communication and enforceable SLAs materially reduce buyer leverage.
- Retail preference: reliable execution
- Risk: outages erode trust fast
- Amplifier: social media/reviews
- Mitigation: proactive comms + 99.9% SLA
Information-rich, community-influenced buyers
- platform-comparisons
- collective-feedback
- viral-onboarding-swings
- influencer-channeling
Low switching costs (<10-min) and fee sensitivity drive churn; 62% value breadth, 99.9% SLA
Low switching costs (<10-minute onboarding) increase churn risk. Fee sensitivity is high after zero-commission since 2019 and 2024 fee compression — small price gaps drive defections. 62% of retail investors prioritized platform breadth in 2024; ~50% consult online communities, while brokers advertise 99.9% uptime SLAs to retain trust.
| Metric | 2024 value |
|---|---|
| Onboarding time | <10 min |
| Platform breadth importance | 62% |
| Community influence | ~50% |
| SLA adoption | 99.9% |
Preview Before You Purchase
Yintech Investment Holdings Ltd. Porter's Five Forces Analysis
This preview shows the exact document you'll receive immediately after purchase—no surprises, no placeholders. The Yintech Investment Holdings Ltd. Porter's Five Forces analysis assesses competitive rivalry, supplier and buyer power, threats of new entrants and substitutes, and regulatory risks. It delivers concise strategic implications and recommended actions for investors and managers. The file is fully formatted and ready for immediate download and use.











