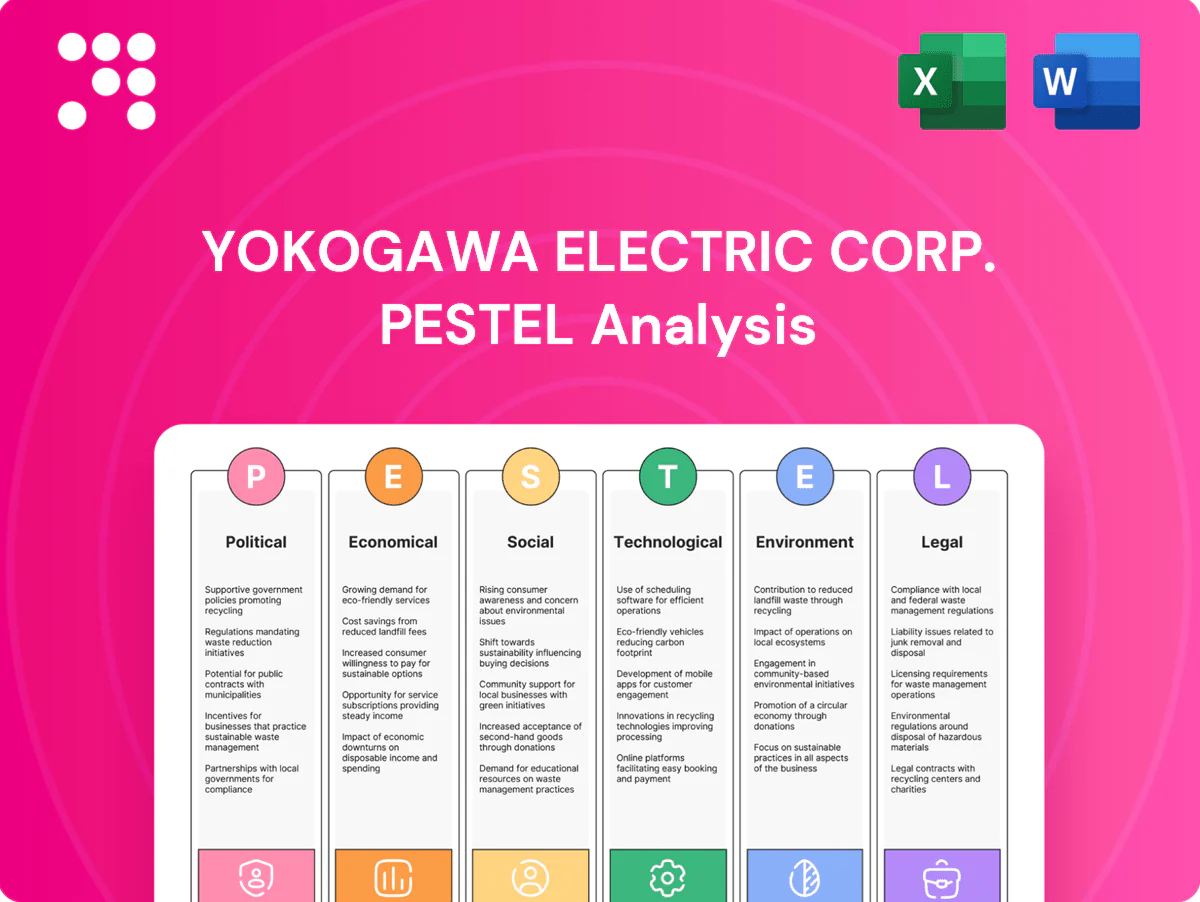
Yokogawa Electric Corp. PESTLE Analysis

Your Shortcut to Market Insight Starts Here
Discover how political shifts, economic cycles, social trends, technological innovation, legal changes, and environmental pressures shape Yokogawa Electric Corp.'s strategic outlook in our concise PESTLE summary—then unlock the full, actionable report to inform investment decisions and competitive strategy; download the complete analysis now for ready-to-use insights.
Political factors

Trade policies and tariffs
Shifting trade agreements and tightened US export controls in 2023–24 on advanced semiconductors and production equipment increase compliance costs and can restrict Yokogawa’s cross-border sales and project execution, especially where control lists target instrumentation used in AI/semiconductor fabs. Exposure to US-China-Japan dynamics raises supply-risk for China-linked orders and critical components. Mitigation via multi-sourcing and regional manufacturing reduces single‑market reliance but can lengthen lead times, raise sourcing costs and pressure margin stability.
Energy transition policies
National decarbonization targets (Japan net-zero by 2050, 46% GHG cut by 2030) plus major subsidies such as the US Inflation Reduction Act ($369bn) and carbon prices (EU ETS ~€85/t in 2024) redirect CAPEX into renewables, hydrogen and CCUS where Yokogawa's control and automation systems are core. Policy shifts can reduce oil & gas investment, increasing demand for low-carbon process controls and emissions monitoring. Government-backed projects create visible multi-year pipelines for Yokogawa sales and service contracts.

Industrial safety regulation
Stricter process-safety mandates boost demand for safety instrumented systems and online analyzers, with buyers seeking IEC 61508/61511 and SIL-certified solutions. Regulatory tightening in chemicals, power and pharma—driven by Seveso-type regimes and national frameworks—forces plantwide upgrades. Public-sector enforcement often follows 3–5 year audit cycles, and state-owned utilities/SOEs steer multi-year CAPEX budgets toward compliant control and safety upgrades.

Geopolitical supply risk
Regional conflicts, maritime chokepoints and sanctions disrupt deliveries and service access; the Straits of Hormuz transits ~20% of global oil and the Suez Canal ~12% of global trade value, raising transit-risk exposure for Yokogawa projects. Critical components—sensors, PLCs and ASICs—are concentrated in East Asia (Taiwan, S. Korea, China; TSMC ~54% foundry share in 2024). Contingency inventories and onshore localization are used to shorten lead times; long-cycle projects command higher risk premiums and scheduling buffers.
- Regional conflicts: delivery/service delays
- Chokepoints: Hormuz ~20% oil, Suez ~12% trade
- Component dependency: East Asia (TSMC ~54% 2024)
- Mitigation: inventories, localization, higher project risk premiums
Government procurement norms
Government procurement rules—bidding windows, mandatory local-content and technology-transfer clauses—determine Yokogawa’s access to utility and infrastructure projects; global public procurement represents about 12% of GDP, driving strong competition for awarded contracts.
Emerging-market tenders often demand 30–60% local content and supplier training, favoring vendors with in-country capacity and JV/partner models; compliance and tech‑transfer obligations typically compress margins and raise overheads.
- local-content: 30–60%
- public-procurement share: ~12% GDP
- favours JVs/partners
- margins/compliance: upward cost pressure
Export controls, green policy costs and local-content rules redirect CAPEX, favor JVs
US 2023–24 export controls raise compliance costs and limit China-linked sales; Japan net-zero 2050 plus IRA $369bn and EU ETS ~€85/t (2024) redirect CAPEX to low‑carbon controls. Stricter safety regs (IEC 61508/61511) and public procurement (~12% GDP) with 30–60% local content compress margins and favor JVs.
| Factor | Value |
|---|---|
| IRA | $369bn |
| EU ETS | €85/t (2024) |
| TSMC | 54% foundry (2024) |
| Local content | 30–60% |
What is included in the product
 Detailed Word Document
Examines how Political, Economic, Social, Technological, Environmental and Legal forces uniquely impact Yokogawa Electric Corp., combining current data and industry trends to highlight sector-specific risks and opportunities; designed for executives, investors and strategists to inform scenario planning, compliance, innovation and market positioning.

 Customizable Excel Spreadsheet
A concise, visually segmented PESTLE for Yokogawa Electric Corp. that distills regulatory, technological, economic, social and environmental risks into a single-slide summary for meetings, easily editable and shareable across teams to support quick alignment and decision-making.
Economic factors

Capex cycles in process industries
Yokogawa’s order intake closely follows multi‑year capex cycles in energy, chemicals, power and pharma; FY2024 consolidated orders were about 360 billion yen, reflecting project-driven demand. Sensitivity to commodity prices and refining/petrochemical spreads drives timing and scope of investments, affecting large automation contracts. Backlog proved resilient as brownfield upgrade work rose during downturns, while capex timing diverged regionally between North America, MEA and Asia.
FX volatility and revenue mix
Yokogawa earns the bulk of sales overseas while many operating costs remain yen-denominated, creating exposure to exchange-rate swings that depress translated revenue when the yen strengthens and squeeze margins on dollar- or euro-priced contracts. Translation impacts hit reported JPY revenues and equity, while transaction effects alter cash profits as receivables/payables revalue; the company offsets some mismatch via natural hedges in local sourcing and regional production. Financial hedging primarily uses forward contracts and occasional options per corporate disclosures, and long-duration service and project contracts typically include FX or escalation clauses to preserve margin over multi-year terms.

Inflation and input costs
Volatility in electronics, semiconductor and logistics costs compresses gross margins for Yokogawa when raw-material or freight spikes occur, though global container rates fell about 70–85% from 2021 peaks to 2024 (Freightos), easing margin pressure. Contract price-escalators and value-engineering clauses mitigate pass-through risk, while semiconductor lead-times largely normalized by 2024 per S&P Global. Wage inflation in Japan pushed negotiated pay rises near 3.5–4% in 2024, raising costs for skilled engineers and service staff.

Interest rates and project financing
Efficiency retrofit demand with sub-3‑year paybacks gains traction; Yokogawa's service and software revenue, which provided ~30% recurring margin stability in recent years, acts as a counter‑cyclical buffer.
Emerging market growth
Demand from industrialization in Asia, the Middle East and Africa is strong—Asia accounted for about 50% of global manufacturing output in 2024—driving infrastructure build-out, refining-to-chemicals expansions and power-reliability projects that fit Yokogawa’s controls and automation portfolio; projects bring high growth but require caution on sovereign credit risk and political stability, and emphasis on local channels and lifecycle services for sustained revenue.
- regional demand: Asia ~50% of global manufacturing output (2024)
- focus: infrastructure, refining-to-chemicals, power reliability
- risks: sovereign credit, political stability
- needs: local channels, lifecycle services
Export controls, green policy costs and local-content rules redirect CAPEX, favor JVs
Yokogawa’s FY2024 orders ~360bn JPY track multi‑year capex in energy, chemicals, power and pharma; backlog rose as brownfield upgrades offset greenfield delays. FX exposure depresses translated revenue when the yen strengthens; hedges and local sourcing partially mitigate. Rising rates (US10y ~4.2%, JPY10y ~0.9% mid‑2025) elevate customer hurdle rates, delaying projects. Service/software (~30% recurring) cushions cyclicality.
| Metric | Value |
|---|---|
| FY2024 orders | ~360bn JPY |
| Service/software share | ~30% |
| Asia manufacturing share (2024) | ~50% |
| US10y / JPY10y (mid‑2025) | 4.2% / 0.9% |
Same Document Delivered
Yokogawa Electric Corp. PESTLE Analysis
This PESTLE analysis of Yokogawa Electric Corp. examines political, economic, social, technological, legal and environmental factors affecting its industrial automation and measurement businesses, highlighting risks and strategic opportunities. It provides concise, actionable insights for investors and managers. The preview shown here is the exact document you’ll receive after purchase—fully formatted and ready to use.

Your Shortcut to Market Insight Starts Here
Discover how political shifts, economic cycles, social trends, technological innovation, legal changes, and environmental pressures shape Yokogawa Electric Corp.'s strategic outlook in our concise PESTLE summary—then unlock the full, actionable report to inform investment decisions and competitive strategy; download the complete analysis now for ready-to-use insights.
Political factors
Trade policies and tariffs
Shifting trade agreements and tightened US export controls in 2023–24 on advanced semiconductors and production equipment increase compliance costs and can restrict Yokogawa’s cross-border sales and project execution, especially where control lists target instrumentation used in AI/semiconductor fabs. Exposure to US-China-Japan dynamics raises supply-risk for China-linked orders and critical components. Mitigation via multi-sourcing and regional manufacturing reduces single‑market reliance but can lengthen lead times, raise sourcing costs and pressure margin stability.
Energy transition policies
National decarbonization targets (Japan net-zero by 2050, 46% GHG cut by 2030) plus major subsidies such as the US Inflation Reduction Act ($369bn) and carbon prices (EU ETS ~€85/t in 2024) redirect CAPEX into renewables, hydrogen and CCUS where Yokogawa's control and automation systems are core. Policy shifts can reduce oil & gas investment, increasing demand for low-carbon process controls and emissions monitoring. Government-backed projects create visible multi-year pipelines for Yokogawa sales and service contracts.
Industrial safety regulation
Stricter process-safety mandates boost demand for safety instrumented systems and online analyzers, with buyers seeking IEC 61508/61511 and SIL-certified solutions. Regulatory tightening in chemicals, power and pharma—driven by Seveso-type regimes and national frameworks—forces plantwide upgrades. Public-sector enforcement often follows 3–5 year audit cycles, and state-owned utilities/SOEs steer multi-year CAPEX budgets toward compliant control and safety upgrades.
Geopolitical supply risk
Regional conflicts, maritime chokepoints and sanctions disrupt deliveries and service access; the Straits of Hormuz transits ~20% of global oil and the Suez Canal ~12% of global trade value, raising transit-risk exposure for Yokogawa projects. Critical components—sensors, PLCs and ASICs—are concentrated in East Asia (Taiwan, S. Korea, China; TSMC ~54% foundry share in 2024). Contingency inventories and onshore localization are used to shorten lead times; long-cycle projects command higher risk premiums and scheduling buffers.
- Regional conflicts: delivery/service delays
- Chokepoints: Hormuz ~20% oil, Suez ~12% trade
- Component dependency: East Asia (TSMC ~54% 2024)
- Mitigation: inventories, localization, higher project risk premiums
Government procurement norms
Government procurement rules—bidding windows, mandatory local-content and technology-transfer clauses—determine Yokogawa’s access to utility and infrastructure projects; global public procurement represents about 12% of GDP, driving strong competition for awarded contracts.
Emerging-market tenders often demand 30–60% local content and supplier training, favoring vendors with in-country capacity and JV/partner models; compliance and tech‑transfer obligations typically compress margins and raise overheads.
- local-content: 30–60%
- public-procurement share: ~12% GDP
- favours JVs/partners
- margins/compliance: upward cost pressure
Export controls, green policy costs and local-content rules redirect CAPEX, favor JVs
US 2023–24 export controls raise compliance costs and limit China-linked sales; Japan net-zero 2050 plus IRA $369bn and EU ETS ~€85/t (2024) redirect CAPEX to low‑carbon controls. Stricter safety regs (IEC 61508/61511) and public procurement (~12% GDP) with 30–60% local content compress margins and favor JVs.
| Factor | Value |
|---|---|
| IRA | $369bn |
| EU ETS | €85/t (2024) |
| TSMC | 54% foundry (2024) |
| Local content | 30–60% |
What is included in the product
Detailed Word Document
Examines how Political, Economic, Social, Technological, Environmental and Legal forces uniquely impact Yokogawa Electric Corp., combining current data and industry trends to highlight sector-specific risks and opportunities; designed for executives, investors and strategists to inform scenario planning, compliance, innovation and market positioning.
Customizable Excel Spreadsheet
A concise, visually segmented PESTLE for Yokogawa Electric Corp. that distills regulatory, technological, economic, social and environmental risks into a single-slide summary for meetings, easily editable and shareable across teams to support quick alignment and decision-making.
Economic factors
Capex cycles in process industries
Yokogawa’s order intake closely follows multi‑year capex cycles in energy, chemicals, power and pharma; FY2024 consolidated orders were about 360 billion yen, reflecting project-driven demand. Sensitivity to commodity prices and refining/petrochemical spreads drives timing and scope of investments, affecting large automation contracts. Backlog proved resilient as brownfield upgrade work rose during downturns, while capex timing diverged regionally between North America, MEA and Asia.
FX volatility and revenue mix
Yokogawa earns the bulk of sales overseas while many operating costs remain yen-denominated, creating exposure to exchange-rate swings that depress translated revenue when the yen strengthens and squeeze margins on dollar- or euro-priced contracts. Translation impacts hit reported JPY revenues and equity, while transaction effects alter cash profits as receivables/payables revalue; the company offsets some mismatch via natural hedges in local sourcing and regional production. Financial hedging primarily uses forward contracts and occasional options per corporate disclosures, and long-duration service and project contracts typically include FX or escalation clauses to preserve margin over multi-year terms.
Inflation and input costs
Volatility in electronics, semiconductor and logistics costs compresses gross margins for Yokogawa when raw-material or freight spikes occur, though global container rates fell about 70–85% from 2021 peaks to 2024 (Freightos), easing margin pressure. Contract price-escalators and value-engineering clauses mitigate pass-through risk, while semiconductor lead-times largely normalized by 2024 per S&P Global. Wage inflation in Japan pushed negotiated pay rises near 3.5–4% in 2024, raising costs for skilled engineers and service staff.
Interest rates and project financing
Efficiency retrofit demand with sub-3‑year paybacks gains traction; Yokogawa's service and software revenue, which provided ~30% recurring margin stability in recent years, acts as a counter‑cyclical buffer.
Emerging market growth
Demand from industrialization in Asia, the Middle East and Africa is strong—Asia accounted for about 50% of global manufacturing output in 2024—driving infrastructure build-out, refining-to-chemicals expansions and power-reliability projects that fit Yokogawa’s controls and automation portfolio; projects bring high growth but require caution on sovereign credit risk and political stability, and emphasis on local channels and lifecycle services for sustained revenue.
- regional demand: Asia ~50% of global manufacturing output (2024)
- focus: infrastructure, refining-to-chemicals, power reliability
- risks: sovereign credit, political stability
- needs: local channels, lifecycle services
Export controls, green policy costs and local-content rules redirect CAPEX, favor JVs
Yokogawa’s FY2024 orders ~360bn JPY track multi‑year capex in energy, chemicals, power and pharma; backlog rose as brownfield upgrades offset greenfield delays. FX exposure depresses translated revenue when the yen strengthens; hedges and local sourcing partially mitigate. Rising rates (US10y ~4.2%, JPY10y ~0.9% mid‑2025) elevate customer hurdle rates, delaying projects. Service/software (~30% recurring) cushions cyclicality.
| Metric | Value |
|---|---|
| FY2024 orders | ~360bn JPY |
| Service/software share | ~30% |
| Asia manufacturing share (2024) | ~50% |
| US10y / JPY10y (mid‑2025) | 4.2% / 0.9% |
Same Document Delivered
Yokogawa Electric Corp. PESTLE Analysis
This PESTLE analysis of Yokogawa Electric Corp. examines political, economic, social, technological, legal and environmental factors affecting its industrial automation and measurement businesses, highlighting risks and strategic opportunities. It provides concise, actionable insights for investors and managers. The preview shown here is the exact document you’ll receive after purchase—fully formatted and ready to use.
Original: $10.00
-65%$10.00
$3.50Description
Your Shortcut to Market Insight Starts Here
Discover how political shifts, economic cycles, social trends, technological innovation, legal changes, and environmental pressures shape Yokogawa Electric Corp.'s strategic outlook in our concise PESTLE summary—then unlock the full, actionable report to inform investment decisions and competitive strategy; download the complete analysis now for ready-to-use insights.
Political factors
Trade policies and tariffs
Shifting trade agreements and tightened US export controls in 2023–24 on advanced semiconductors and production equipment increase compliance costs and can restrict Yokogawa’s cross-border sales and project execution, especially where control lists target instrumentation used in AI/semiconductor fabs. Exposure to US-China-Japan dynamics raises supply-risk for China-linked orders and critical components. Mitigation via multi-sourcing and regional manufacturing reduces single‑market reliance but can lengthen lead times, raise sourcing costs and pressure margin stability.
Energy transition policies
National decarbonization targets (Japan net-zero by 2050, 46% GHG cut by 2030) plus major subsidies such as the US Inflation Reduction Act ($369bn) and carbon prices (EU ETS ~€85/t in 2024) redirect CAPEX into renewables, hydrogen and CCUS where Yokogawa's control and automation systems are core. Policy shifts can reduce oil & gas investment, increasing demand for low-carbon process controls and emissions monitoring. Government-backed projects create visible multi-year pipelines for Yokogawa sales and service contracts.
Industrial safety regulation
Stricter process-safety mandates boost demand for safety instrumented systems and online analyzers, with buyers seeking IEC 61508/61511 and SIL-certified solutions. Regulatory tightening in chemicals, power and pharma—driven by Seveso-type regimes and national frameworks—forces plantwide upgrades. Public-sector enforcement often follows 3–5 year audit cycles, and state-owned utilities/SOEs steer multi-year CAPEX budgets toward compliant control and safety upgrades.
Geopolitical supply risk
Regional conflicts, maritime chokepoints and sanctions disrupt deliveries and service access; the Straits of Hormuz transits ~20% of global oil and the Suez Canal ~12% of global trade value, raising transit-risk exposure for Yokogawa projects. Critical components—sensors, PLCs and ASICs—are concentrated in East Asia (Taiwan, S. Korea, China; TSMC ~54% foundry share in 2024). Contingency inventories and onshore localization are used to shorten lead times; long-cycle projects command higher risk premiums and scheduling buffers.
- Regional conflicts: delivery/service delays
- Chokepoints: Hormuz ~20% oil, Suez ~12% trade
- Component dependency: East Asia (TSMC ~54% 2024)
- Mitigation: inventories, localization, higher project risk premiums
Government procurement norms
Government procurement rules—bidding windows, mandatory local-content and technology-transfer clauses—determine Yokogawa’s access to utility and infrastructure projects; global public procurement represents about 12% of GDP, driving strong competition for awarded contracts.
Emerging-market tenders often demand 30–60% local content and supplier training, favoring vendors with in-country capacity and JV/partner models; compliance and tech‑transfer obligations typically compress margins and raise overheads.
- local-content: 30–60%
- public-procurement share: ~12% GDP
- favours JVs/partners
- margins/compliance: upward cost pressure
Export controls, green policy costs and local-content rules redirect CAPEX, favor JVs
US 2023–24 export controls raise compliance costs and limit China-linked sales; Japan net-zero 2050 plus IRA $369bn and EU ETS ~€85/t (2024) redirect CAPEX to low‑carbon controls. Stricter safety regs (IEC 61508/61511) and public procurement (~12% GDP) with 30–60% local content compress margins and favor JVs.
| Factor | Value |
|---|---|
| IRA | $369bn |
| EU ETS | €85/t (2024) |
| TSMC | 54% foundry (2024) |
| Local content | 30–60% |
What is included in the product
Detailed Word Document
Examines how Political, Economic, Social, Technological, Environmental and Legal forces uniquely impact Yokogawa Electric Corp., combining current data and industry trends to highlight sector-specific risks and opportunities; designed for executives, investors and strategists to inform scenario planning, compliance, innovation and market positioning.
Customizable Excel Spreadsheet
A concise, visually segmented PESTLE for Yokogawa Electric Corp. that distills regulatory, technological, economic, social and environmental risks into a single-slide summary for meetings, easily editable and shareable across teams to support quick alignment and decision-making.
Economic factors
Capex cycles in process industries
Yokogawa’s order intake closely follows multi‑year capex cycles in energy, chemicals, power and pharma; FY2024 consolidated orders were about 360 billion yen, reflecting project-driven demand. Sensitivity to commodity prices and refining/petrochemical spreads drives timing and scope of investments, affecting large automation contracts. Backlog proved resilient as brownfield upgrade work rose during downturns, while capex timing diverged regionally between North America, MEA and Asia.
FX volatility and revenue mix
Yokogawa earns the bulk of sales overseas while many operating costs remain yen-denominated, creating exposure to exchange-rate swings that depress translated revenue when the yen strengthens and squeeze margins on dollar- or euro-priced contracts. Translation impacts hit reported JPY revenues and equity, while transaction effects alter cash profits as receivables/payables revalue; the company offsets some mismatch via natural hedges in local sourcing and regional production. Financial hedging primarily uses forward contracts and occasional options per corporate disclosures, and long-duration service and project contracts typically include FX or escalation clauses to preserve margin over multi-year terms.
Inflation and input costs
Volatility in electronics, semiconductor and logistics costs compresses gross margins for Yokogawa when raw-material or freight spikes occur, though global container rates fell about 70–85% from 2021 peaks to 2024 (Freightos), easing margin pressure. Contract price-escalators and value-engineering clauses mitigate pass-through risk, while semiconductor lead-times largely normalized by 2024 per S&P Global. Wage inflation in Japan pushed negotiated pay rises near 3.5–4% in 2024, raising costs for skilled engineers and service staff.
Interest rates and project financing
Efficiency retrofit demand with sub-3‑year paybacks gains traction; Yokogawa's service and software revenue, which provided ~30% recurring margin stability in recent years, acts as a counter‑cyclical buffer.
Emerging market growth
Demand from industrialization in Asia, the Middle East and Africa is strong—Asia accounted for about 50% of global manufacturing output in 2024—driving infrastructure build-out, refining-to-chemicals expansions and power-reliability projects that fit Yokogawa’s controls and automation portfolio; projects bring high growth but require caution on sovereign credit risk and political stability, and emphasis on local channels and lifecycle services for sustained revenue.
- regional demand: Asia ~50% of global manufacturing output (2024)
- focus: infrastructure, refining-to-chemicals, power reliability
- risks: sovereign credit, political stability
- needs: local channels, lifecycle services
Export controls, green policy costs and local-content rules redirect CAPEX, favor JVs
Yokogawa’s FY2024 orders ~360bn JPY track multi‑year capex in energy, chemicals, power and pharma; backlog rose as brownfield upgrades offset greenfield delays. FX exposure depresses translated revenue when the yen strengthens; hedges and local sourcing partially mitigate. Rising rates (US10y ~4.2%, JPY10y ~0.9% mid‑2025) elevate customer hurdle rates, delaying projects. Service/software (~30% recurring) cushions cyclicality.
| Metric | Value |
|---|---|
| FY2024 orders | ~360bn JPY |
| Service/software share | ~30% |
| Asia manufacturing share (2024) | ~50% |
| US10y / JPY10y (mid‑2025) | 4.2% / 0.9% |
Same Document Delivered
Yokogawa Electric Corp. PESTLE Analysis
This PESTLE analysis of Yokogawa Electric Corp. examines political, economic, social, technological, legal and environmental factors affecting its industrial automation and measurement businesses, highlighting risks and strategic opportunities. It provides concise, actionable insights for investors and managers. The preview shown here is the exact document you’ll receive after purchase—fully formatted and ready to use.











