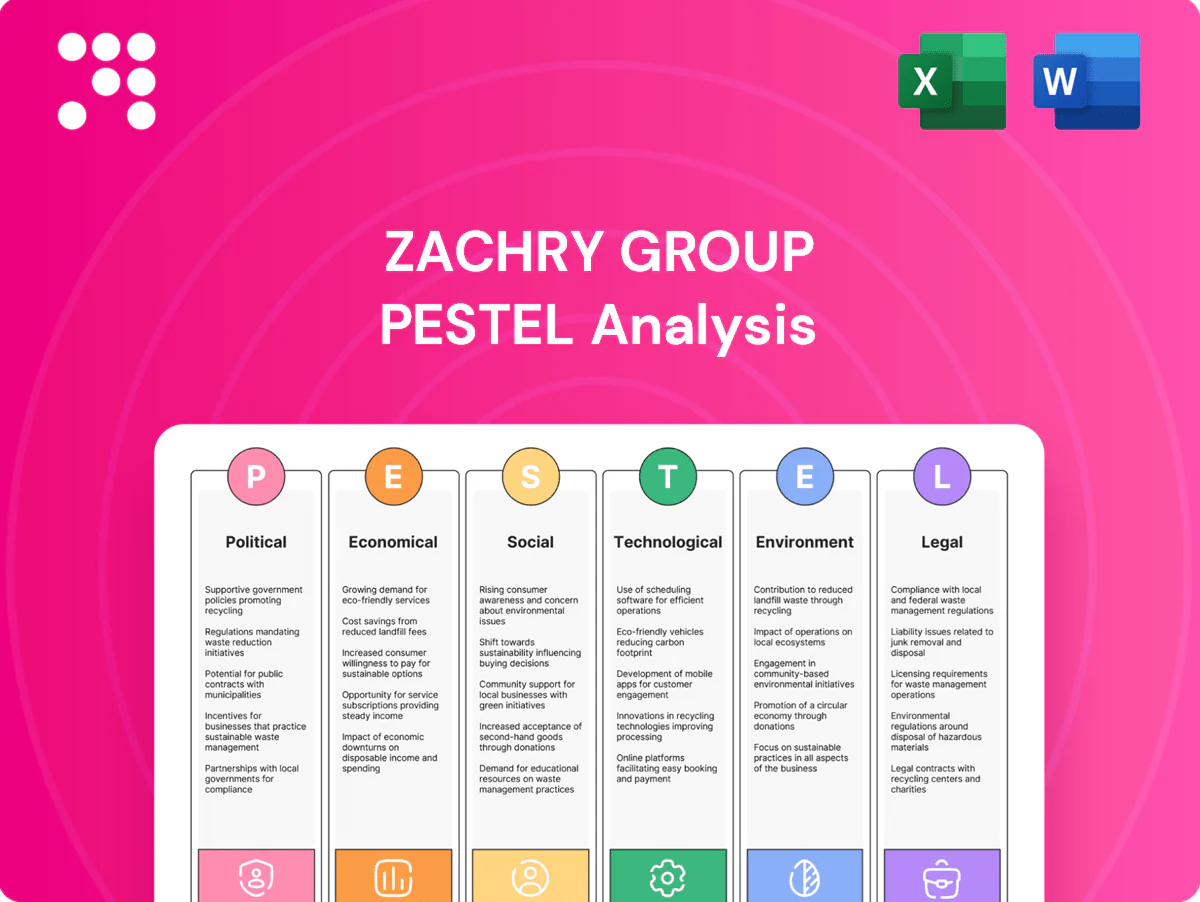
Zachry Group PESTLE Analysis

Make Smarter Strategic Decisions with a Complete PESTEL View
Unlock strategic clarity with our PESTLE Analysis of Zachry Group — concise insights on political, economic, social, technological, legal, and environmental forces shaping its future. Perfect for investors and strategists; buy the full report for detailed, ready-to-use intelligence and immediate download.
Political factors

Federal infrastructure and energy funding
Shifts in U.S. federal funding — IIJA’s $1.2 trillion package (about $550 billion new spending) and the IRA’s roughly $369 billion in energy/climate incentives — can accelerate or delay project starts, directly shaping Zachry’s bid pipeline and customer capex. Continuity across election cycles (notably post‑2024) affects multi‑year backlog visibility. Changes or delays in grant and IRS tax credit guidance have reshaped project economics midstream, altering returns and funding timing.
Permitting and regulatory approvals
NEPA reviews (commonly 2–7 years) plus FERC certification (often 12–18 months) and DOE/state siting timelines collectively determine project feasibility and start dates for Zachry; delays materially affect cash flow and NPV. Permitting reform (administration targets shorter, coordinated reviews) could compress schedules and cut cost risk, while stricter reviews raise schedule and budget variability. Zachry must align designs and construction sequencing with evolving permit conditions and political pressure around energy transition projects adds further timing uncertainty.

Trade policy and procurement rules
Section 232 tariffs (25% on steel, 10% on aluminum) and equipment duties raise EPC cost baselines and contingency needs; the 2021 IIJA expanded Buy America/Buy American procurement, shifting vendor selection toward domestic suppliers. Policy swings have caused long‑lead item price and delivery volatility—industry reports cite 6–18 month disruptions. Zachry’s in‑house fabrication and U.S. supplier networks reduce this exposure.

Labor policy and workforce mobility
Prevailing wage, apprenticeship and PLA requirements tied to federal incentives such as the $1.2 trillion IIJA and $369 billion IRA have reshaped Zachry Group bid models, raising labor cost floors and favoring qualified contractors. Immigration enforcement and uneven interstate licensing reciprocity tighten craft availability amid a 2024 US construction workforce of about 7.6 million. Political shifts in workforce development funding directly alter training pipelines and eligibility for subsidized projects. Compliance improves grant access but increases administrative overhead and bidding complexity.
- Prevailing wage: increases bid baselines
- Apprenticeship/PLA: alters subcontractor selection
- Workforce mobility: impacted by immigration and reciprocity
- Funding stance: changes training pipeline capacity
- Compliance: boosts eligibility, raises admin costs
State and local politics
State and local politics—governors, state public utility commissions (PUCs) and city councils—directly shape approvals for energy, chemical and industrial projects; there are 50 governors whose policy stances affect permitting and timelines. Tax abatements, TIFs and local incentives drive site selection and cadence of starts, while Inflation Reduction Act credits (expanded in 2022) shift economics toward clean projects. Regional attitudes toward fossil versus clean energy determine market mix, requiring Zachry to navigate heterogeneous rules across core states.
- Governance: 50 governors influence permitting
- Incentives: TIFs, abatements drive site selection
- Federal influence: IRA tax credits boost clean projects
- Operational risk: varying state/municipal rules across core states
IIJA/IRA funding boosts backlog while NEPA, tariffs and labor raise schedule and cost risks
Federal packages (IIJA $1.2T; IRA $369B) and post‑2024 election continuity drive Zachry’s pipeline and multi‑year backlog certainty. Permitting (NEPA 2–7y; FERC 12–18m) and tariff/Buy America rules (steel 25%, aluminum 10%) create schedule and cost risk. Labor rules plus a 2024 US construction workforce ~7.6M raise bid baselines and compliance overhead.
| Policy | Metric |
|---|---|
| Permitting | NEPA 2–7y / FERC 12–18m |
| Funding | IIJA $1.2T / IRA $369B |
| Tariffs | Steel 25% / Al 10% |
What is included in the product
 Detailed Word Document
Explores how Political, Economic, Social, Technological, Environmental and Legal forces specifically affect Zachry Group’s construction, engineering and infrastructure operations, combining data-driven trends and regional regulatory context to identify risks, opportunities and forward-looking scenario insights for executives and investors.

 Customizable Excel Spreadsheet
A concise, visually segmented PESTLE summary for Zachry Group that removes complexity, enabling quick reference in meetings or presentations and easy sharing across teams for faster alignment on external risks and strategic positioning.
Economic factors

Interest rates and cost of capital
With the US federal funds rate near 5.25–5.50% (mid‑2025), higher rates lift owners’ WACC by roughly 150–300 bps, deferring marginal projects and forcing scope redesigns. Elevated financing costs ripple into EPC scheduling and payment milestones, slowing starts and extending receivable days. A 100–200 bp rate cut could unlock backlog and materially improve cash conversion. Zachry’s risk sharing and contract terms must reflect this financing sensitivity.
Commodity and input price volatility
Volatility in steel, concrete, copper and equipment has produced input cost swings up to 40% year-over-year, driving frequent estimate changes and change orders for Zachry Group. Hedging, indexed contracts and firm vendor agreements are critical to protect margins and lock prices. Supply shocks have forced redesign or modular alternatives to preserve schedules. Clear, accurate escalation clauses reduce disputes and preserve client and supplier relationships.

Cyclical demand in end markets
Energy, petrochemicals and manufacturing investment run in multi-year cycles, with project FIDs concentrated in 3–7 year waves. Shifts in power mix—US 2023 generation: natural gas ~38% and renewables ~23% (EIA)—and growing LNG export capacity near 500 mtpa global drive timing of opportunities. Diversification across sectors and services such as turnarounds and maintenance smooths revenue. Backlog quality and contract mix determine resilience as cycles turn.

Labor availability and wage inflation
- Tight markets: U.S. construction wages ~+5% y/y (BLS 2024)
- Localized spikes: up to +10% craft pay (ENR 2024)
- Per diems/retention rising; boosts project OCM
- Modularization/productivity reduce headcount needs
- Staffing certainty improves EPC win rates
Supply chain reliability
Lead times for transformers, turbines, valves and electrical gear remain extended in 2024–2025, commonly ranging: transformers 20–60 weeks, industrial turbines 40–78 weeks, valves 12–24 weeks and switchgear 20–40 weeks, increasing schedule risk. Early procurement and strategic inventory reduce delay exposure; vendor insolvencies and consolidation concentrate supply risk. Expanding domestic fabrication for critical-path components strengthens delivery certainty.
- Lead-time ranges: transformers 20–60w, turbines 40–78w, valves 12–24w, gear 20–40w
- Mitigation: early procurement, strategic inventory
- Risk: supplier insolvency/consolidation concentrates failure points
- Opportunity: domestic fabrication secures critical-path items
IIJA/IRA funding boosts backlog while NEPA, tariffs and labor raise schedule and cost risks
Higher rates (fed funds ~5.25–5.50% mid‑2025) raise WACC ≈+150–300bps, delaying marginal projects; input prices have swung up to +40% y/y, pressuring margins. Construction wages ~+5% y/y (BLS 2024) and localized craft spikes to +10% raise OCM; long lead times (transformers 20–60w, turbines 40–78w) increase schedule risk.
| Metric | Value |
|---|---|
| Fed funds (mid‑2025) | 5.25–5.50% |
| WACC impact | +150–300bps |
| Input volatility | up to +40% y/y |
| Construction wages (2024) | +5% y/y (BLS) |
| Transformer lead time | 20–60 weeks |
Full Version Awaits
Zachry Group PESTLE Analysis
The Zachry Group PESTLE Analysis preview shown here is the exact document you’ll receive after purchase—fully formatted and ready to use. This is a real screenshot of the product you’re buying and will be delivered exactly as shown. The content, layout, and structure visible here are the final file you’ll download immediately after payment.

Make Smarter Strategic Decisions with a Complete PESTEL View
Unlock strategic clarity with our PESTLE Analysis of Zachry Group — concise insights on political, economic, social, technological, legal, and environmental forces shaping its future. Perfect for investors and strategists; buy the full report for detailed, ready-to-use intelligence and immediate download.
Political factors
Federal infrastructure and energy funding
Shifts in U.S. federal funding — IIJA’s $1.2 trillion package (about $550 billion new spending) and the IRA’s roughly $369 billion in energy/climate incentives — can accelerate or delay project starts, directly shaping Zachry’s bid pipeline and customer capex. Continuity across election cycles (notably post‑2024) affects multi‑year backlog visibility. Changes or delays in grant and IRS tax credit guidance have reshaped project economics midstream, altering returns and funding timing.
Permitting and regulatory approvals
NEPA reviews (commonly 2–7 years) plus FERC certification (often 12–18 months) and DOE/state siting timelines collectively determine project feasibility and start dates for Zachry; delays materially affect cash flow and NPV. Permitting reform (administration targets shorter, coordinated reviews) could compress schedules and cut cost risk, while stricter reviews raise schedule and budget variability. Zachry must align designs and construction sequencing with evolving permit conditions and political pressure around energy transition projects adds further timing uncertainty.
Trade policy and procurement rules
Section 232 tariffs (25% on steel, 10% on aluminum) and equipment duties raise EPC cost baselines and contingency needs; the 2021 IIJA expanded Buy America/Buy American procurement, shifting vendor selection toward domestic suppliers. Policy swings have caused long‑lead item price and delivery volatility—industry reports cite 6–18 month disruptions. Zachry’s in‑house fabrication and U.S. supplier networks reduce this exposure.
Labor policy and workforce mobility
Prevailing wage, apprenticeship and PLA requirements tied to federal incentives such as the $1.2 trillion IIJA and $369 billion IRA have reshaped Zachry Group bid models, raising labor cost floors and favoring qualified contractors. Immigration enforcement and uneven interstate licensing reciprocity tighten craft availability amid a 2024 US construction workforce of about 7.6 million. Political shifts in workforce development funding directly alter training pipelines and eligibility for subsidized projects. Compliance improves grant access but increases administrative overhead and bidding complexity.
- Prevailing wage: increases bid baselines
- Apprenticeship/PLA: alters subcontractor selection
- Workforce mobility: impacted by immigration and reciprocity
- Funding stance: changes training pipeline capacity
- Compliance: boosts eligibility, raises admin costs
State and local politics
State and local politics—governors, state public utility commissions (PUCs) and city councils—directly shape approvals for energy, chemical and industrial projects; there are 50 governors whose policy stances affect permitting and timelines. Tax abatements, TIFs and local incentives drive site selection and cadence of starts, while Inflation Reduction Act credits (expanded in 2022) shift economics toward clean projects. Regional attitudes toward fossil versus clean energy determine market mix, requiring Zachry to navigate heterogeneous rules across core states.
- Governance: 50 governors influence permitting
- Incentives: TIFs, abatements drive site selection
- Federal influence: IRA tax credits boost clean projects
- Operational risk: varying state/municipal rules across core states
IIJA/IRA funding boosts backlog while NEPA, tariffs and labor raise schedule and cost risks
Federal packages (IIJA $1.2T; IRA $369B) and post‑2024 election continuity drive Zachry’s pipeline and multi‑year backlog certainty. Permitting (NEPA 2–7y; FERC 12–18m) and tariff/Buy America rules (steel 25%, aluminum 10%) create schedule and cost risk. Labor rules plus a 2024 US construction workforce ~7.6M raise bid baselines and compliance overhead.
| Policy | Metric |
|---|---|
| Permitting | NEPA 2–7y / FERC 12–18m |
| Funding | IIJA $1.2T / IRA $369B |
| Tariffs | Steel 25% / Al 10% |
What is included in the product
Detailed Word Document
Explores how Political, Economic, Social, Technological, Environmental and Legal forces specifically affect Zachry Group’s construction, engineering and infrastructure operations, combining data-driven trends and regional regulatory context to identify risks, opportunities and forward-looking scenario insights for executives and investors.
Customizable Excel Spreadsheet
A concise, visually segmented PESTLE summary for Zachry Group that removes complexity, enabling quick reference in meetings or presentations and easy sharing across teams for faster alignment on external risks and strategic positioning.
Economic factors
Interest rates and cost of capital
With the US federal funds rate near 5.25–5.50% (mid‑2025), higher rates lift owners’ WACC by roughly 150–300 bps, deferring marginal projects and forcing scope redesigns. Elevated financing costs ripple into EPC scheduling and payment milestones, slowing starts and extending receivable days. A 100–200 bp rate cut could unlock backlog and materially improve cash conversion. Zachry’s risk sharing and contract terms must reflect this financing sensitivity.
Commodity and input price volatility
Volatility in steel, concrete, copper and equipment has produced input cost swings up to 40% year-over-year, driving frequent estimate changes and change orders for Zachry Group. Hedging, indexed contracts and firm vendor agreements are critical to protect margins and lock prices. Supply shocks have forced redesign or modular alternatives to preserve schedules. Clear, accurate escalation clauses reduce disputes and preserve client and supplier relationships.
Cyclical demand in end markets
Energy, petrochemicals and manufacturing investment run in multi-year cycles, with project FIDs concentrated in 3–7 year waves. Shifts in power mix—US 2023 generation: natural gas ~38% and renewables ~23% (EIA)—and growing LNG export capacity near 500 mtpa global drive timing of opportunities. Diversification across sectors and services such as turnarounds and maintenance smooths revenue. Backlog quality and contract mix determine resilience as cycles turn.
Labor availability and wage inflation
- Tight markets: U.S. construction wages ~+5% y/y (BLS 2024)
- Localized spikes: up to +10% craft pay (ENR 2024)
- Per diems/retention rising; boosts project OCM
- Modularization/productivity reduce headcount needs
- Staffing certainty improves EPC win rates
Supply chain reliability
Lead times for transformers, turbines, valves and electrical gear remain extended in 2024–2025, commonly ranging: transformers 20–60 weeks, industrial turbines 40–78 weeks, valves 12–24 weeks and switchgear 20–40 weeks, increasing schedule risk. Early procurement and strategic inventory reduce delay exposure; vendor insolvencies and consolidation concentrate supply risk. Expanding domestic fabrication for critical-path components strengthens delivery certainty.
- Lead-time ranges: transformers 20–60w, turbines 40–78w, valves 12–24w, gear 20–40w
- Mitigation: early procurement, strategic inventory
- Risk: supplier insolvency/consolidation concentrates failure points
- Opportunity: domestic fabrication secures critical-path items
IIJA/IRA funding boosts backlog while NEPA, tariffs and labor raise schedule and cost risks
Higher rates (fed funds ~5.25–5.50% mid‑2025) raise WACC ≈+150–300bps, delaying marginal projects; input prices have swung up to +40% y/y, pressuring margins. Construction wages ~+5% y/y (BLS 2024) and localized craft spikes to +10% raise OCM; long lead times (transformers 20–60w, turbines 40–78w) increase schedule risk.
| Metric | Value |
|---|---|
| Fed funds (mid‑2025) | 5.25–5.50% |
| WACC impact | +150–300bps |
| Input volatility | up to +40% y/y |
| Construction wages (2024) | +5% y/y (BLS) |
| Transformer lead time | 20–60 weeks |
Full Version Awaits
Zachry Group PESTLE Analysis
The Zachry Group PESTLE Analysis preview shown here is the exact document you’ll receive after purchase—fully formatted and ready to use. This is a real screenshot of the product you’re buying and will be delivered exactly as shown. The content, layout, and structure visible here are the final file you’ll download immediately after payment.
Original: $10.00
-65%$10.00
$3.50Description
Make Smarter Strategic Decisions with a Complete PESTEL View
Unlock strategic clarity with our PESTLE Analysis of Zachry Group — concise insights on political, economic, social, technological, legal, and environmental forces shaping its future. Perfect for investors and strategists; buy the full report for detailed, ready-to-use intelligence and immediate download.
Political factors
Federal infrastructure and energy funding
Shifts in U.S. federal funding — IIJA’s $1.2 trillion package (about $550 billion new spending) and the IRA’s roughly $369 billion in energy/climate incentives — can accelerate or delay project starts, directly shaping Zachry’s bid pipeline and customer capex. Continuity across election cycles (notably post‑2024) affects multi‑year backlog visibility. Changes or delays in grant and IRS tax credit guidance have reshaped project economics midstream, altering returns and funding timing.
Permitting and regulatory approvals
NEPA reviews (commonly 2–7 years) plus FERC certification (often 12–18 months) and DOE/state siting timelines collectively determine project feasibility and start dates for Zachry; delays materially affect cash flow and NPV. Permitting reform (administration targets shorter, coordinated reviews) could compress schedules and cut cost risk, while stricter reviews raise schedule and budget variability. Zachry must align designs and construction sequencing with evolving permit conditions and political pressure around energy transition projects adds further timing uncertainty.
Trade policy and procurement rules
Section 232 tariffs (25% on steel, 10% on aluminum) and equipment duties raise EPC cost baselines and contingency needs; the 2021 IIJA expanded Buy America/Buy American procurement, shifting vendor selection toward domestic suppliers. Policy swings have caused long‑lead item price and delivery volatility—industry reports cite 6–18 month disruptions. Zachry’s in‑house fabrication and U.S. supplier networks reduce this exposure.
Labor policy and workforce mobility
Prevailing wage, apprenticeship and PLA requirements tied to federal incentives such as the $1.2 trillion IIJA and $369 billion IRA have reshaped Zachry Group bid models, raising labor cost floors and favoring qualified contractors. Immigration enforcement and uneven interstate licensing reciprocity tighten craft availability amid a 2024 US construction workforce of about 7.6 million. Political shifts in workforce development funding directly alter training pipelines and eligibility for subsidized projects. Compliance improves grant access but increases administrative overhead and bidding complexity.
- Prevailing wage: increases bid baselines
- Apprenticeship/PLA: alters subcontractor selection
- Workforce mobility: impacted by immigration and reciprocity
- Funding stance: changes training pipeline capacity
- Compliance: boosts eligibility, raises admin costs
State and local politics
State and local politics—governors, state public utility commissions (PUCs) and city councils—directly shape approvals for energy, chemical and industrial projects; there are 50 governors whose policy stances affect permitting and timelines. Tax abatements, TIFs and local incentives drive site selection and cadence of starts, while Inflation Reduction Act credits (expanded in 2022) shift economics toward clean projects. Regional attitudes toward fossil versus clean energy determine market mix, requiring Zachry to navigate heterogeneous rules across core states.
- Governance: 50 governors influence permitting
- Incentives: TIFs, abatements drive site selection
- Federal influence: IRA tax credits boost clean projects
- Operational risk: varying state/municipal rules across core states
IIJA/IRA funding boosts backlog while NEPA, tariffs and labor raise schedule and cost risks
Federal packages (IIJA $1.2T; IRA $369B) and post‑2024 election continuity drive Zachry’s pipeline and multi‑year backlog certainty. Permitting (NEPA 2–7y; FERC 12–18m) and tariff/Buy America rules (steel 25%, aluminum 10%) create schedule and cost risk. Labor rules plus a 2024 US construction workforce ~7.6M raise bid baselines and compliance overhead.
| Policy | Metric |
|---|---|
| Permitting | NEPA 2–7y / FERC 12–18m |
| Funding | IIJA $1.2T / IRA $369B |
| Tariffs | Steel 25% / Al 10% |
What is included in the product
Detailed Word Document
Explores how Political, Economic, Social, Technological, Environmental and Legal forces specifically affect Zachry Group’s construction, engineering and infrastructure operations, combining data-driven trends and regional regulatory context to identify risks, opportunities and forward-looking scenario insights for executives and investors.
Customizable Excel Spreadsheet
A concise, visually segmented PESTLE summary for Zachry Group that removes complexity, enabling quick reference in meetings or presentations and easy sharing across teams for faster alignment on external risks and strategic positioning.
Economic factors
Interest rates and cost of capital
With the US federal funds rate near 5.25–5.50% (mid‑2025), higher rates lift owners’ WACC by roughly 150–300 bps, deferring marginal projects and forcing scope redesigns. Elevated financing costs ripple into EPC scheduling and payment milestones, slowing starts and extending receivable days. A 100–200 bp rate cut could unlock backlog and materially improve cash conversion. Zachry’s risk sharing and contract terms must reflect this financing sensitivity.
Commodity and input price volatility
Volatility in steel, concrete, copper and equipment has produced input cost swings up to 40% year-over-year, driving frequent estimate changes and change orders for Zachry Group. Hedging, indexed contracts and firm vendor agreements are critical to protect margins and lock prices. Supply shocks have forced redesign or modular alternatives to preserve schedules. Clear, accurate escalation clauses reduce disputes and preserve client and supplier relationships.
Cyclical demand in end markets
Energy, petrochemicals and manufacturing investment run in multi-year cycles, with project FIDs concentrated in 3–7 year waves. Shifts in power mix—US 2023 generation: natural gas ~38% and renewables ~23% (EIA)—and growing LNG export capacity near 500 mtpa global drive timing of opportunities. Diversification across sectors and services such as turnarounds and maintenance smooths revenue. Backlog quality and contract mix determine resilience as cycles turn.
Labor availability and wage inflation
- Tight markets: U.S. construction wages ~+5% y/y (BLS 2024)
- Localized spikes: up to +10% craft pay (ENR 2024)
- Per diems/retention rising; boosts project OCM
- Modularization/productivity reduce headcount needs
- Staffing certainty improves EPC win rates
Supply chain reliability
Lead times for transformers, turbines, valves and electrical gear remain extended in 2024–2025, commonly ranging: transformers 20–60 weeks, industrial turbines 40–78 weeks, valves 12–24 weeks and switchgear 20–40 weeks, increasing schedule risk. Early procurement and strategic inventory reduce delay exposure; vendor insolvencies and consolidation concentrate supply risk. Expanding domestic fabrication for critical-path components strengthens delivery certainty.
- Lead-time ranges: transformers 20–60w, turbines 40–78w, valves 12–24w, gear 20–40w
- Mitigation: early procurement, strategic inventory
- Risk: supplier insolvency/consolidation concentrates failure points
- Opportunity: domestic fabrication secures critical-path items
IIJA/IRA funding boosts backlog while NEPA, tariffs and labor raise schedule and cost risks
Higher rates (fed funds ~5.25–5.50% mid‑2025) raise WACC ≈+150–300bps, delaying marginal projects; input prices have swung up to +40% y/y, pressuring margins. Construction wages ~+5% y/y (BLS 2024) and localized craft spikes to +10% raise OCM; long lead times (transformers 20–60w, turbines 40–78w) increase schedule risk.
| Metric | Value |
|---|---|
| Fed funds (mid‑2025) | 5.25–5.50% |
| WACC impact | +150–300bps |
| Input volatility | up to +40% y/y |
| Construction wages (2024) | +5% y/y (BLS) |
| Transformer lead time | 20–60 weeks |
Full Version Awaits
Zachry Group PESTLE Analysis
The Zachry Group PESTLE Analysis preview shown here is the exact document you’ll receive after purchase—fully formatted and ready to use. This is a real screenshot of the product you’re buying and will be delivered exactly as shown. The content, layout, and structure visible here are the final file you’ll download immediately after payment.











