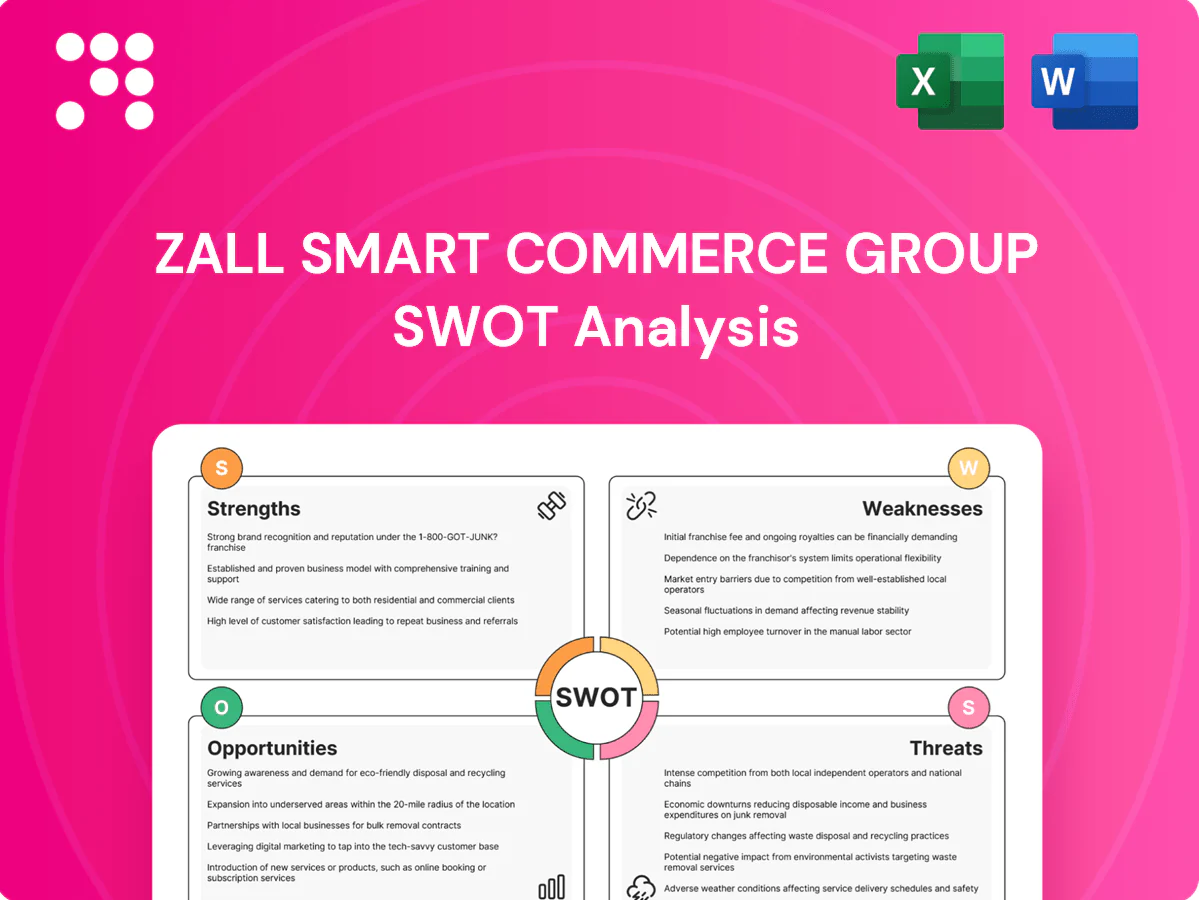
Zall Smart Commerce Group SWOT Analysis

Dive Deeper Into the Company’s Strategic Blueprint
Zall Smart Commerce Group's SWOT analysis highlights tech-enabled distribution strengths, China market access, regulatory and liquidity risks, and growth drivers in digital trade and logistics; actionable insights reveal strategic levers and vulnerabilities. Want the full story behind the company’s strengths, risks, and growth drivers? Purchase the complete SWOT analysis to gain a professionally written, editable report with Word and Excel deliverables.
Strengths

Integrated O2O wholesale platform
Combining physical wholesale markets with digital trading amplifies network effects and liquidity, giving merchants omnichannel reach plus data-driven procurement, finance and fulfillment tools that cut search and transaction costs for B2B buyers and sellers; reported client retention rates for integrated O2O platforms often exceed 70%, creating meaningful switching costs and higher lifetime value.
Diversified category coverage
Exposure to consumer goods, agricultural products and cold chain skews Zall Smart Commerce Group’s portfolio away from single-category cycles, reducing concentration risk. Cross-category capabilities drive scale in sourcing, warehousing and distribution, lowering unit costs. Seasonality and price shocks can be balanced across verticals, stabilizing margins. The breadth supports bundled services and deeper merchant relationships.

Cold chain logistics capability
Temperature-controlled infrastructure creates a high barrier to entry and anchors Zall’s fresh and perishables trading, cutting risks where FAO notes post-harvest losses can reach up to 40% in some regions.
Reliable cold chain lowers loss rates and boosts quality assurance, strengthening merchant trust and repeat business.
It enables paid value-added services—quality inspection and traceability—that support higher-margin service revenue.

Large-scale market operations
Operating large wholesale hubs aggregates demand and supply to improve price discovery and market depth; scale gives Zall stronger bargaining power with tenants, logistics providers and fintech partners. Higher throughput lowers unit operating costs and boosts margin leverage, while hub presence enhances brand visibility across regional trade flows.
- Aggregated demand/supply
- Bargaining power
- Lower unit costs
- Regional brand visibility
Data and service monetization
Digital platforms capture transaction, inventory and logistics data that power credit scoring, embedded finance and targeted marketing; service layers convert those insights into recurring, asset-light revenue while data flywheels progressively improve matching efficiency and reduce customer acquisition cost.
- Data-driven credit & finance
- Embedded marketing ROI
- Recurring, asset-light services
- Improving matching via flywheel
O2O cold-chain platform: retention >70%, losses up to 40%
Integrated O2O platform drives network effects and reported client retention >70%, creating switching costs and higher lifetime value.
Multi-category focus across consumer goods, agri and cold chain lowers concentration risk and stabilizes margins versus single-category peers.
Temperature-controlled logistics address FAO-estimated post-harvest losses up to 40%, supporting quality, trust and higher-margin services.
Aggregated hubs and data flywheels cut unit costs and enable embedded finance and recurring, asset-light revenue.
| Metric | Value | Source |
|---|---|---|
| Client retention | >70% | O2O platform benchmarks |
| Post-harvest losses | up to 40% | FAO |
What is included in the product
 Detailed Word Document
Provides a clear SWOT framework that maps Zall Smart Commerce Group’s internal strengths and weaknesses alongside market opportunities and external threats to evaluate competitive position and strategic risks.

 Customizable Excel Spreadsheet
Provides an editable, high-level SWOT summary for Zall Smart Commerce Group that streamlines strategic alignment, eases stakeholder presentations, and allows quick updates to reflect shifting business priorities.
Weaknesses

High asset intensity
High asset intensity in Zall Smart Commerce Group stems from significant capex and upkeep for physical markets and cold-chain infrastructure, which depresses returns during utilization downturns. Asset-heavy operations reduce agility in reallocating capital, slowing response to market shifts. Elevated balance-sheet leverage from such assets can constrain growth investments and strategic flexibility.
Exposure to commodity and agri volatility
Price swings and supply shocks in agricultural goods (FAO food prices jumped about 20% in 2022 and stayed elevated thereafter) can quickly depress Zall Smart Commerce Group volumes and working capital turnover. Perishability increases operational risk and can drive inventory write-offs, often material in fresh produce chains. Margin management becomes complex amid volatile input costs, demanding robust data, forecasting and hedging capabilities.

Digital adoption gaps
SME merchants vary widely in tech readiness, slowing platform migration and limiting Zall’s scale-up speed; fragmented onboarding and inconsistent training further reduce depth of feature usage. Low digitization among target merchants diminishes data completeness, lowering cross-sell and service-attach rates. These gaps delay network-effects realization and constrain monetization velocity.

Complex multi-node operations
Coordinating markets, warehouses and logistics creates execution risk across Zall’s multi-node network, and 2024 industry reports show fragmented chains can increase operating costs noticeably. System integration and interoperability gaps often cause bottlenecks and delays, with partner variability driving uneven service quality across regions. This complexity materially raises operating and coordination costs.
- coordination risk — multi-node execution
- integration gaps — bottlenecks, delays
- service variance — regional/partner-dependent
- cost pressure — higher operating expenses
Regulatory and compliance burden
Food safety, cold-chain standards and cross-border trade rules create heavy compliance for Zall Smart Commerce Group; WHO estimates 600 million foodborne illnesses annually, raising scrutiny and audits.
Documentation and audit requirements increase operating overhead and delay shipments; regulatory lapses can trigger fines, recalls and reputational harm, slowing regional expansion.
- High audit/documentation burden
- Cold-chain compliance intensifies logistics
- Regulatory lapses risk fines/recalls
- Slows market expansion
High CapEx, 3.1x net-debt/EBITDA, perishable inventory, low digitization
High asset intensity (CapEx/Sales ~24% FY2024) and net-debt/EBITDA ~3.1x limit capital flexibility; perishable inventory (avg days 42) and ~6% food loss amplify write-off risk; merchant digitization only ~35% slows platform monetization and network effects; complex multi-node coordination and cold-chain compliance raise operating costs and regional service variance.
| Metric | Value |
|---|---|
| CapEx/Sales (2024) | 24% |
| Net debt/EBITDA | 3.1x |
| Inventory days | 42 |
| Food loss | 6% |
| Merchants digitized | 35% |
Same Document Delivered
Zall Smart Commerce Group SWOT Analysis
This is the actual SWOT analysis document for Zall Smart Commerce Group—you’re viewing the same professionally structured file you’ll receive upon purchase. The preview is pulled directly from the full report. Buy to unlock the complete, editable version.

Dive Deeper Into the Company’s Strategic Blueprint
Zall Smart Commerce Group's SWOT analysis highlights tech-enabled distribution strengths, China market access, regulatory and liquidity risks, and growth drivers in digital trade and logistics; actionable insights reveal strategic levers and vulnerabilities. Want the full story behind the company’s strengths, risks, and growth drivers? Purchase the complete SWOT analysis to gain a professionally written, editable report with Word and Excel deliverables.
Strengths
Integrated O2O wholesale platform
Combining physical wholesale markets with digital trading amplifies network effects and liquidity, giving merchants omnichannel reach plus data-driven procurement, finance and fulfillment tools that cut search and transaction costs for B2B buyers and sellers; reported client retention rates for integrated O2O platforms often exceed 70%, creating meaningful switching costs and higher lifetime value.
Diversified category coverage
Exposure to consumer goods, agricultural products and cold chain skews Zall Smart Commerce Group’s portfolio away from single-category cycles, reducing concentration risk. Cross-category capabilities drive scale in sourcing, warehousing and distribution, lowering unit costs. Seasonality and price shocks can be balanced across verticals, stabilizing margins. The breadth supports bundled services and deeper merchant relationships.
Cold chain logistics capability
Temperature-controlled infrastructure creates a high barrier to entry and anchors Zall’s fresh and perishables trading, cutting risks where FAO notes post-harvest losses can reach up to 40% in some regions.
Reliable cold chain lowers loss rates and boosts quality assurance, strengthening merchant trust and repeat business.
It enables paid value-added services—quality inspection and traceability—that support higher-margin service revenue.
Large-scale market operations
Operating large wholesale hubs aggregates demand and supply to improve price discovery and market depth; scale gives Zall stronger bargaining power with tenants, logistics providers and fintech partners. Higher throughput lowers unit operating costs and boosts margin leverage, while hub presence enhances brand visibility across regional trade flows.
- Aggregated demand/supply
- Bargaining power
- Lower unit costs
- Regional brand visibility
Data and service monetization
Digital platforms capture transaction, inventory and logistics data that power credit scoring, embedded finance and targeted marketing; service layers convert those insights into recurring, asset-light revenue while data flywheels progressively improve matching efficiency and reduce customer acquisition cost.
- Data-driven credit & finance
- Embedded marketing ROI
- Recurring, asset-light services
- Improving matching via flywheel
O2O cold-chain platform: retention >70%, losses up to 40%
Integrated O2O platform drives network effects and reported client retention >70%, creating switching costs and higher lifetime value.
Multi-category focus across consumer goods, agri and cold chain lowers concentration risk and stabilizes margins versus single-category peers.
Temperature-controlled logistics address FAO-estimated post-harvest losses up to 40%, supporting quality, trust and higher-margin services.
Aggregated hubs and data flywheels cut unit costs and enable embedded finance and recurring, asset-light revenue.
| Metric | Value | Source |
|---|---|---|
| Client retention | >70% | O2O platform benchmarks |
| Post-harvest losses | up to 40% | FAO |
What is included in the product
Detailed Word Document
Provides a clear SWOT framework that maps Zall Smart Commerce Group’s internal strengths and weaknesses alongside market opportunities and external threats to evaluate competitive position and strategic risks.
Customizable Excel Spreadsheet
Provides an editable, high-level SWOT summary for Zall Smart Commerce Group that streamlines strategic alignment, eases stakeholder presentations, and allows quick updates to reflect shifting business priorities.
Weaknesses
High asset intensity
High asset intensity in Zall Smart Commerce Group stems from significant capex and upkeep for physical markets and cold-chain infrastructure, which depresses returns during utilization downturns. Asset-heavy operations reduce agility in reallocating capital, slowing response to market shifts. Elevated balance-sheet leverage from such assets can constrain growth investments and strategic flexibility.
Exposure to commodity and agri volatility
Price swings and supply shocks in agricultural goods (FAO food prices jumped about 20% in 2022 and stayed elevated thereafter) can quickly depress Zall Smart Commerce Group volumes and working capital turnover. Perishability increases operational risk and can drive inventory write-offs, often material in fresh produce chains. Margin management becomes complex amid volatile input costs, demanding robust data, forecasting and hedging capabilities.
Digital adoption gaps
SME merchants vary widely in tech readiness, slowing platform migration and limiting Zall’s scale-up speed; fragmented onboarding and inconsistent training further reduce depth of feature usage. Low digitization among target merchants diminishes data completeness, lowering cross-sell and service-attach rates. These gaps delay network-effects realization and constrain monetization velocity.
Complex multi-node operations
Coordinating markets, warehouses and logistics creates execution risk across Zall’s multi-node network, and 2024 industry reports show fragmented chains can increase operating costs noticeably. System integration and interoperability gaps often cause bottlenecks and delays, with partner variability driving uneven service quality across regions. This complexity materially raises operating and coordination costs.
- coordination risk — multi-node execution
- integration gaps — bottlenecks, delays
- service variance — regional/partner-dependent
- cost pressure — higher operating expenses
Regulatory and compliance burden
Food safety, cold-chain standards and cross-border trade rules create heavy compliance for Zall Smart Commerce Group; WHO estimates 600 million foodborne illnesses annually, raising scrutiny and audits.
Documentation and audit requirements increase operating overhead and delay shipments; regulatory lapses can trigger fines, recalls and reputational harm, slowing regional expansion.
- High audit/documentation burden
- Cold-chain compliance intensifies logistics
- Regulatory lapses risk fines/recalls
- Slows market expansion
High CapEx, 3.1x net-debt/EBITDA, perishable inventory, low digitization
High asset intensity (CapEx/Sales ~24% FY2024) and net-debt/EBITDA ~3.1x limit capital flexibility; perishable inventory (avg days 42) and ~6% food loss amplify write-off risk; merchant digitization only ~35% slows platform monetization and network effects; complex multi-node coordination and cold-chain compliance raise operating costs and regional service variance.
| Metric | Value |
|---|---|
| CapEx/Sales (2024) | 24% |
| Net debt/EBITDA | 3.1x |
| Inventory days | 42 |
| Food loss | 6% |
| Merchants digitized | 35% |
Same Document Delivered
Zall Smart Commerce Group SWOT Analysis
This is the actual SWOT analysis document for Zall Smart Commerce Group—you’re viewing the same professionally structured file you’ll receive upon purchase. The preview is pulled directly from the full report. Buy to unlock the complete, editable version.
Original: $10.00
-65%$10.00
$3.50Description
Dive Deeper Into the Company’s Strategic Blueprint
Zall Smart Commerce Group's SWOT analysis highlights tech-enabled distribution strengths, China market access, regulatory and liquidity risks, and growth drivers in digital trade and logistics; actionable insights reveal strategic levers and vulnerabilities. Want the full story behind the company’s strengths, risks, and growth drivers? Purchase the complete SWOT analysis to gain a professionally written, editable report with Word and Excel deliverables.
Strengths
Integrated O2O wholesale platform
Combining physical wholesale markets with digital trading amplifies network effects and liquidity, giving merchants omnichannel reach plus data-driven procurement, finance and fulfillment tools that cut search and transaction costs for B2B buyers and sellers; reported client retention rates for integrated O2O platforms often exceed 70%, creating meaningful switching costs and higher lifetime value.
Diversified category coverage
Exposure to consumer goods, agricultural products and cold chain skews Zall Smart Commerce Group’s portfolio away from single-category cycles, reducing concentration risk. Cross-category capabilities drive scale in sourcing, warehousing and distribution, lowering unit costs. Seasonality and price shocks can be balanced across verticals, stabilizing margins. The breadth supports bundled services and deeper merchant relationships.
Cold chain logistics capability
Temperature-controlled infrastructure creates a high barrier to entry and anchors Zall’s fresh and perishables trading, cutting risks where FAO notes post-harvest losses can reach up to 40% in some regions.
Reliable cold chain lowers loss rates and boosts quality assurance, strengthening merchant trust and repeat business.
It enables paid value-added services—quality inspection and traceability—that support higher-margin service revenue.
Large-scale market operations
Operating large wholesale hubs aggregates demand and supply to improve price discovery and market depth; scale gives Zall stronger bargaining power with tenants, logistics providers and fintech partners. Higher throughput lowers unit operating costs and boosts margin leverage, while hub presence enhances brand visibility across regional trade flows.
- Aggregated demand/supply
- Bargaining power
- Lower unit costs
- Regional brand visibility
Data and service monetization
Digital platforms capture transaction, inventory and logistics data that power credit scoring, embedded finance and targeted marketing; service layers convert those insights into recurring, asset-light revenue while data flywheels progressively improve matching efficiency and reduce customer acquisition cost.
- Data-driven credit & finance
- Embedded marketing ROI
- Recurring, asset-light services
- Improving matching via flywheel
O2O cold-chain platform: retention >70%, losses up to 40%
Integrated O2O platform drives network effects and reported client retention >70%, creating switching costs and higher lifetime value.
Multi-category focus across consumer goods, agri and cold chain lowers concentration risk and stabilizes margins versus single-category peers.
Temperature-controlled logistics address FAO-estimated post-harvest losses up to 40%, supporting quality, trust and higher-margin services.
Aggregated hubs and data flywheels cut unit costs and enable embedded finance and recurring, asset-light revenue.
| Metric | Value | Source |
|---|---|---|
| Client retention | >70% | O2O platform benchmarks |
| Post-harvest losses | up to 40% | FAO |
What is included in the product
Detailed Word Document
Provides a clear SWOT framework that maps Zall Smart Commerce Group’s internal strengths and weaknesses alongside market opportunities and external threats to evaluate competitive position and strategic risks.
Customizable Excel Spreadsheet
Provides an editable, high-level SWOT summary for Zall Smart Commerce Group that streamlines strategic alignment, eases stakeholder presentations, and allows quick updates to reflect shifting business priorities.
Weaknesses
High asset intensity
High asset intensity in Zall Smart Commerce Group stems from significant capex and upkeep for physical markets and cold-chain infrastructure, which depresses returns during utilization downturns. Asset-heavy operations reduce agility in reallocating capital, slowing response to market shifts. Elevated balance-sheet leverage from such assets can constrain growth investments and strategic flexibility.
Exposure to commodity and agri volatility
Price swings and supply shocks in agricultural goods (FAO food prices jumped about 20% in 2022 and stayed elevated thereafter) can quickly depress Zall Smart Commerce Group volumes and working capital turnover. Perishability increases operational risk and can drive inventory write-offs, often material in fresh produce chains. Margin management becomes complex amid volatile input costs, demanding robust data, forecasting and hedging capabilities.
Digital adoption gaps
SME merchants vary widely in tech readiness, slowing platform migration and limiting Zall’s scale-up speed; fragmented onboarding and inconsistent training further reduce depth of feature usage. Low digitization among target merchants diminishes data completeness, lowering cross-sell and service-attach rates. These gaps delay network-effects realization and constrain monetization velocity.
Complex multi-node operations
Coordinating markets, warehouses and logistics creates execution risk across Zall’s multi-node network, and 2024 industry reports show fragmented chains can increase operating costs noticeably. System integration and interoperability gaps often cause bottlenecks and delays, with partner variability driving uneven service quality across regions. This complexity materially raises operating and coordination costs.
- coordination risk — multi-node execution
- integration gaps — bottlenecks, delays
- service variance — regional/partner-dependent
- cost pressure — higher operating expenses
Regulatory and compliance burden
Food safety, cold-chain standards and cross-border trade rules create heavy compliance for Zall Smart Commerce Group; WHO estimates 600 million foodborne illnesses annually, raising scrutiny and audits.
Documentation and audit requirements increase operating overhead and delay shipments; regulatory lapses can trigger fines, recalls and reputational harm, slowing regional expansion.
- High audit/documentation burden
- Cold-chain compliance intensifies logistics
- Regulatory lapses risk fines/recalls
- Slows market expansion
High CapEx, 3.1x net-debt/EBITDA, perishable inventory, low digitization
High asset intensity (CapEx/Sales ~24% FY2024) and net-debt/EBITDA ~3.1x limit capital flexibility; perishable inventory (avg days 42) and ~6% food loss amplify write-off risk; merchant digitization only ~35% slows platform monetization and network effects; complex multi-node coordination and cold-chain compliance raise operating costs and regional service variance.
| Metric | Value |
|---|---|
| CapEx/Sales (2024) | 24% |
| Net debt/EBITDA | 3.1x |
| Inventory days | 42 |
| Food loss | 6% |
| Merchants digitized | 35% |
Same Document Delivered
Zall Smart Commerce Group SWOT Analysis
This is the actual SWOT analysis document for Zall Smart Commerce Group—you’re viewing the same professionally structured file you’ll receive upon purchase. The preview is pulled directly from the full report. Buy to unlock the complete, editable version.











