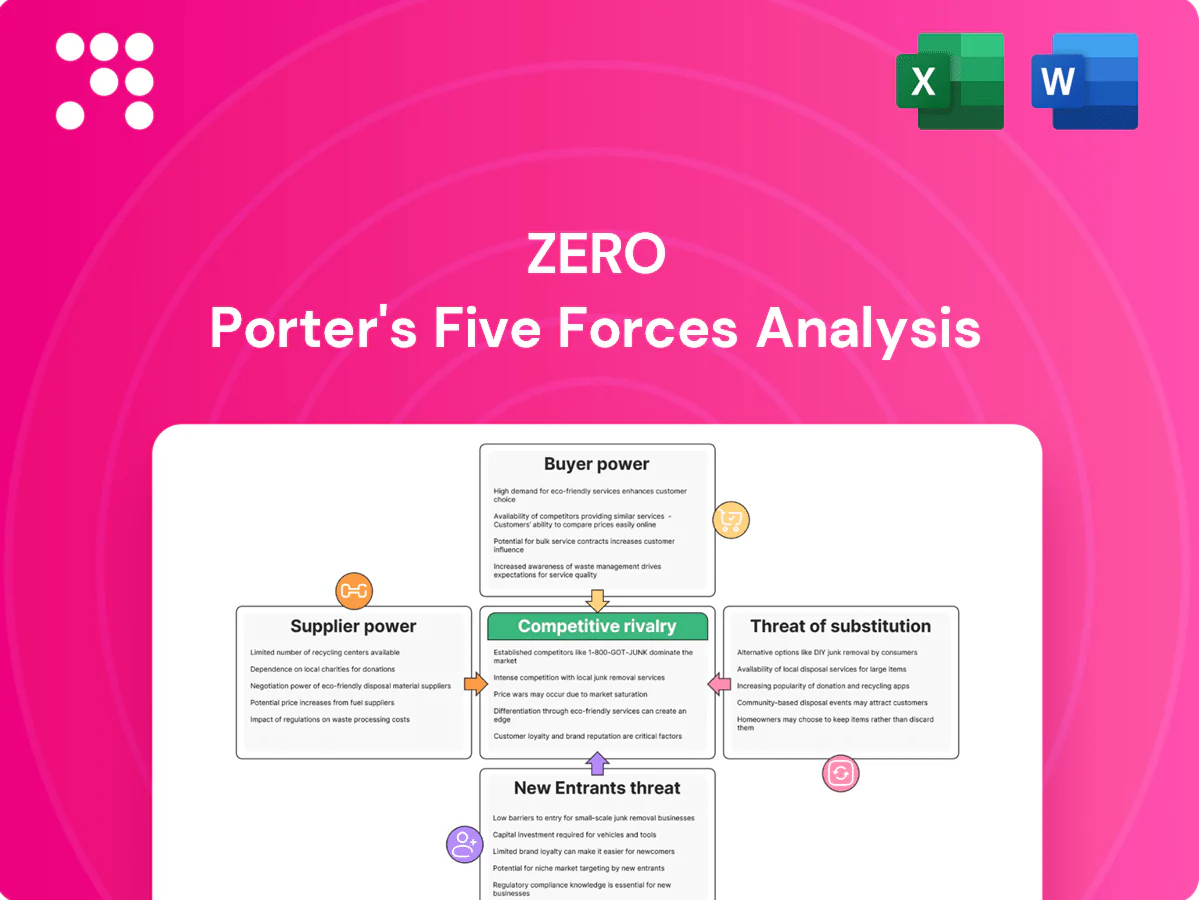
Zero Porter's Five Forces Analysis

Elevate Your Analysis with the Complete Porter's Five Forces Analysis
Zero’s Porter’s Five Forces snapshot highlights competitive intensity, supplier and buyer leverage, threat of substitutes, and barriers to entry. This brief view surfaces key pressures shaping Zero’s market position. Unlock the full Porter’s Five Forces Analysis for force-by-force ratings, visuals, and actionable strategy. Get the consultant-grade report to inform investment and planning.
Suppliers Bargaining Power

Driver and labor scarcity
Japan faces a chronic truck driver shortfall of over 100,000 drivers in 2024, tightening labor supplier power and lifting bargaining leverage. Wage inflation (roughly 6% year-on-year in 2023–24 for transport wages) and stricter work-hour rules can raise ZERO’s operating costs or cap capacity. Heavy reliance on subcontracted owner-operators amplifies exposure to spot-rate spikes. Building training pipelines and retention programs reduces this supplier leverage.
Truck, trailer, and specialized carrier OEMs
Car-carrying rigs, low-loaders and motorcycle racks are niche assets with limited OEM choice, with the top five commercial vehicle OEMs supplying over 70% of heavy-truck units globally in 2024, concentrating supplier power.
Long lead times of 6–12 months and capex per specialized unit often exceeding USD 120,000 give suppliers strong negotiation leverage.
Parts availability directly affects fleet uptime and maintenance costs, while fleet standardization and multi-sourcing reduce dependence and lower total cost of ownership.

Fuel and energy providers
Diesel price volatility and limited alternatives heighten supplier power: fuel typically represents 20–30% of carrier opex, and retail diesel swings in 2024 saw monthly movements exceeding 10% in many markets. Fuel surcharges help pass costs through but often lag by 30–60 days, compressing margins. Shift toward EV/FCV or biofuel fleets (around 1.5% of new heavy-duty sales in 2024) creates new supplier dependencies. Fuel hedging and bulk contracts can cover up to ~70% of consumption, partially rebalancing power.

IT, telematics, and compliance services
Route optimization, ELD/telematics, and digital inspection tools are mission-critical, giving vendors leverage as switching core platforms is costly and risky; the global fleet telematics market was estimated near $28 billion in 2024 and US ELD adoption is effectively universal since the 2017 mandate. Cybersecurity and automaker data-integration needs increase specialization, while open APIs and staged migrations can reduce lock-in and migration costs.
- High lock-in: costly core-platform switches
- Market size: ~28B (2024)
- Regulatory: ELD mandate drives near-universal adoption
- Mitigants: open APIs, staged migration
Ports, rail ramps, and yard infrastructure
Access to limited berths, rail ramps, and secure yards creates capacity bottlenecks that give infrastructure operators strong bargaining power through slot allocations and high storage fees; congestion raises dwell costs and degrades service levels, forcing shippers to absorb delays or pay premiums. Long-term access agreements and distributed yards reduce supplier leverage by diversifying access and smoothing flows.
- Capacity bottlenecks: limited berths/ramps
- Pricing leverage: slot allocations, storage fees
- Performance impact: congestion → higher dwell costs
- Mitigation: long-term agreements, distributed yards
Japan trucker shortage, wage inflation and OEM concentration squeeze freight margins
Supplier power is high: Japan trucker shortfall >100,000 (2024) and transport wage inflation ~6% YoY (2023–24) tighten labor leverage. OEM concentration (top‑5 >70% of heavy trucks, 2024) and specialized assets (capex per unit >USD120,000) raise procurement risk. Fuel (20–30% opex) volatility and a ~$28B fleet telematics market (2024) add vendor lock‑in; multi-sourcing and long‑term contracts mitigate.
| Metric | Value (year) |
|---|---|
| Driver shortfall | >100,000 (2024) |
| Wage inflation | ~6% YoY (2023–24) |
| OEM concentration | Top‑5 >70% (2024) |
| Capex per unit | >USD120,000 |
| Fuel share | 20–30% opex |
| Telematics market | ~USD28B (2024) |
What is included in the product
 Detailed Word Document
Comprehensive Porter's Five Forces analysis for Zero that assesses competitive rivalry, supplier and buyer power, threats from substitutes and new entrants, identifies disruptive risks and protective barriers, and is editable for reports.

 Customizable Excel Spreadsheet
Zero Porter's Five Forces compresses competitive pressure into a single, editable one-sheet—ideal for fast strategic decisions and slide-ready summaries. Toggle scenarios, update inputs, and export clean charts without macros so teams can align quickly and act on real-time market shifts.
Customers Bargaining Power

Automakers and large fleet clients
OEMs and leasing/rental majors buy at scale and run formal tenders—Hertz’s 2021 order for 100,000 Teslas exemplifies fleet buying power—enabling strong price pressure and strict service requirements.
Their scheduling flexibility and volume leverage force providers to accept tight service windows and inventory commitments, with performance KPIs and penalty clauses commonly applied.
Multi-year contracts deliver revenue stability but typically at thin, often single-digit margins, compressing suppliers’ pricing power.
Dealers, auctions, and logistics integrators
Dealer groups and auction houses aggregate volumes regionally—top 150 dealer groups accounted for ~38% of US franchise sales in 2024—giving them leverage to solicit lane-by-lane bids. Auctions and logistics integrators (Cox/Manheim scale processing >5M wholesale units annually) can shift volumes between carriers, forcing price competition. Seasonality around model launches spikes demand and increases customer bargaining power. Value-added services like registration and inspection bundles reduce pure price comparisons.

Individual customers and relocations
Individual relocation customers buy low volumes and typically show higher willingness-to-pay, reducing their bargaining power; in 2024 over 60% of movers research options online, boosting price transparency and comparison. Service quality and a damage-free record remain primary selection drivers, often outweighing small price differences. ZERO differentiates through convenient administrative support versus low-cost competitors, sustaining pricing power.

Sensitivity to lead time and damage rates
Buyers prioritize on-time delivery and low damage rates over marginal price cuts; 2024 surveys show about 68% of shippers rank reliability above price. Carriers reporting claims ratios below 0.5% can command roughly 10–12% premium. For shipments valued over $50,000, risk-transfer terms become key negotiation levers; guaranteed delivery windows and insurance options can cut buyer bargaining power by as much as 25–30%.
- Sensitivity: on-time > price (68% 2024)
- Claims ratio: <0.5% → 10–12% premium
- High-value cargo: >$50,000 drives risk-transfer
- Mitigants: guaranteed windows + insurance → −25–30% buyer power
Multi-sourcing and contractual flexibility
Large shippers commonly split volumes across 2–4 carriers to hedge operational risk, keeping carriers price-competitive on lanes and accessorials; spot and contract blended sourcing raised tender fragmentation in 2024. Shorter contract cycles sustain pricing pressure amid volatile fuel costs. Integrated inspection and registration bundles increase switching costs for shippers.
- Multi-sourcing: 2–4 carriers
- Pricing pressure: shorter cycles
- Accessorial focus: sustained competition
- Switching costs: higher with integrated services
Scale buyers and dealer concentration boost carrier pricing power; reliability commands premiums
OEMs and leasing majors buy at scale (Hertz 2021: 100,000 Teslas), driving strong price/service demands; top 150 dealer groups = ~38% of US franchise sales (2024). Large shippers split volumes across 2–4 carriers, while 68% of shippers rank reliability over price (2024). Carriers with <0.5% claims can command ~10–12% premium; guaranteed windows + insurance can cut buyer power ~25–30%.
| Metric | 2024 Data | Impact |
|---|---|---|
| OEM/Leasing orders | Hertz 2021:100k | High buyer leverage |
| Dealer concentration | Top150=38% sales | Regional bidding power |
| Reliability priority | 68% shippers | Price pressure reduced |
| Claims premium | <0.5% → 10–12% | Supplier pricing power |
Preview the Actual Deliverable
Zero Porter's Five Forces Analysis
This preview shows the exact Zero Porter's Five Forces Analysis you'll receive immediately after purchase—no placeholders, no mockups. The document displayed is the full, professionally formatted analysis ready to download and use the moment you buy. You’ll get instant access to this identical file with no additional setup required.

Elevate Your Analysis with the Complete Porter's Five Forces Analysis
Zero’s Porter’s Five Forces snapshot highlights competitive intensity, supplier and buyer leverage, threat of substitutes, and barriers to entry. This brief view surfaces key pressures shaping Zero’s market position. Unlock the full Porter’s Five Forces Analysis for force-by-force ratings, visuals, and actionable strategy. Get the consultant-grade report to inform investment and planning.
Suppliers Bargaining Power
Driver and labor scarcity
Japan faces a chronic truck driver shortfall of over 100,000 drivers in 2024, tightening labor supplier power and lifting bargaining leverage. Wage inflation (roughly 6% year-on-year in 2023–24 for transport wages) and stricter work-hour rules can raise ZERO’s operating costs or cap capacity. Heavy reliance on subcontracted owner-operators amplifies exposure to spot-rate spikes. Building training pipelines and retention programs reduces this supplier leverage.
Truck, trailer, and specialized carrier OEMs
Car-carrying rigs, low-loaders and motorcycle racks are niche assets with limited OEM choice, with the top five commercial vehicle OEMs supplying over 70% of heavy-truck units globally in 2024, concentrating supplier power.
Long lead times of 6–12 months and capex per specialized unit often exceeding USD 120,000 give suppliers strong negotiation leverage.
Parts availability directly affects fleet uptime and maintenance costs, while fleet standardization and multi-sourcing reduce dependence and lower total cost of ownership.
Fuel and energy providers
Diesel price volatility and limited alternatives heighten supplier power: fuel typically represents 20–30% of carrier opex, and retail diesel swings in 2024 saw monthly movements exceeding 10% in many markets. Fuel surcharges help pass costs through but often lag by 30–60 days, compressing margins. Shift toward EV/FCV or biofuel fleets (around 1.5% of new heavy-duty sales in 2024) creates new supplier dependencies. Fuel hedging and bulk contracts can cover up to ~70% of consumption, partially rebalancing power.
IT, telematics, and compliance services
Route optimization, ELD/telematics, and digital inspection tools are mission-critical, giving vendors leverage as switching core platforms is costly and risky; the global fleet telematics market was estimated near $28 billion in 2024 and US ELD adoption is effectively universal since the 2017 mandate. Cybersecurity and automaker data-integration needs increase specialization, while open APIs and staged migrations can reduce lock-in and migration costs.
- High lock-in: costly core-platform switches
- Market size: ~28B (2024)
- Regulatory: ELD mandate drives near-universal adoption
- Mitigants: open APIs, staged migration
Ports, rail ramps, and yard infrastructure
Access to limited berths, rail ramps, and secure yards creates capacity bottlenecks that give infrastructure operators strong bargaining power through slot allocations and high storage fees; congestion raises dwell costs and degrades service levels, forcing shippers to absorb delays or pay premiums. Long-term access agreements and distributed yards reduce supplier leverage by diversifying access and smoothing flows.
- Capacity bottlenecks: limited berths/ramps
- Pricing leverage: slot allocations, storage fees
- Performance impact: congestion → higher dwell costs
- Mitigation: long-term agreements, distributed yards
Japan trucker shortage, wage inflation and OEM concentration squeeze freight margins
Supplier power is high: Japan trucker shortfall >100,000 (2024) and transport wage inflation ~6% YoY (2023–24) tighten labor leverage. OEM concentration (top‑5 >70% of heavy trucks, 2024) and specialized assets (capex per unit >USD120,000) raise procurement risk. Fuel (20–30% opex) volatility and a ~$28B fleet telematics market (2024) add vendor lock‑in; multi-sourcing and long‑term contracts mitigate.
| Metric | Value (year) |
|---|---|
| Driver shortfall | >100,000 (2024) |
| Wage inflation | ~6% YoY (2023–24) |
| OEM concentration | Top‑5 >70% (2024) |
| Capex per unit | >USD120,000 |
| Fuel share | 20–30% opex |
| Telematics market | ~USD28B (2024) |
What is included in the product
Detailed Word Document
Comprehensive Porter's Five Forces analysis for Zero that assesses competitive rivalry, supplier and buyer power, threats from substitutes and new entrants, identifies disruptive risks and protective barriers, and is editable for reports.
Customizable Excel Spreadsheet
Zero Porter's Five Forces compresses competitive pressure into a single, editable one-sheet—ideal for fast strategic decisions and slide-ready summaries. Toggle scenarios, update inputs, and export clean charts without macros so teams can align quickly and act on real-time market shifts.
Customers Bargaining Power
Automakers and large fleet clients
OEMs and leasing/rental majors buy at scale and run formal tenders—Hertz’s 2021 order for 100,000 Teslas exemplifies fleet buying power—enabling strong price pressure and strict service requirements.
Their scheduling flexibility and volume leverage force providers to accept tight service windows and inventory commitments, with performance KPIs and penalty clauses commonly applied.
Multi-year contracts deliver revenue stability but typically at thin, often single-digit margins, compressing suppliers’ pricing power.
Dealers, auctions, and logistics integrators
Dealer groups and auction houses aggregate volumes regionally—top 150 dealer groups accounted for ~38% of US franchise sales in 2024—giving them leverage to solicit lane-by-lane bids. Auctions and logistics integrators (Cox/Manheim scale processing >5M wholesale units annually) can shift volumes between carriers, forcing price competition. Seasonality around model launches spikes demand and increases customer bargaining power. Value-added services like registration and inspection bundles reduce pure price comparisons.
Individual customers and relocations
Individual relocation customers buy low volumes and typically show higher willingness-to-pay, reducing their bargaining power; in 2024 over 60% of movers research options online, boosting price transparency and comparison. Service quality and a damage-free record remain primary selection drivers, often outweighing small price differences. ZERO differentiates through convenient administrative support versus low-cost competitors, sustaining pricing power.
Sensitivity to lead time and damage rates
Buyers prioritize on-time delivery and low damage rates over marginal price cuts; 2024 surveys show about 68% of shippers rank reliability above price. Carriers reporting claims ratios below 0.5% can command roughly 10–12% premium. For shipments valued over $50,000, risk-transfer terms become key negotiation levers; guaranteed delivery windows and insurance options can cut buyer bargaining power by as much as 25–30%.
- Sensitivity: on-time > price (68% 2024)
- Claims ratio: <0.5% → 10–12% premium
- High-value cargo: >$50,000 drives risk-transfer
- Mitigants: guaranteed windows + insurance → −25–30% buyer power
Multi-sourcing and contractual flexibility
Large shippers commonly split volumes across 2–4 carriers to hedge operational risk, keeping carriers price-competitive on lanes and accessorials; spot and contract blended sourcing raised tender fragmentation in 2024. Shorter contract cycles sustain pricing pressure amid volatile fuel costs. Integrated inspection and registration bundles increase switching costs for shippers.
- Multi-sourcing: 2–4 carriers
- Pricing pressure: shorter cycles
- Accessorial focus: sustained competition
- Switching costs: higher with integrated services
Scale buyers and dealer concentration boost carrier pricing power; reliability commands premiums
OEMs and leasing majors buy at scale (Hertz 2021: 100,000 Teslas), driving strong price/service demands; top 150 dealer groups = ~38% of US franchise sales (2024). Large shippers split volumes across 2–4 carriers, while 68% of shippers rank reliability over price (2024). Carriers with <0.5% claims can command ~10–12% premium; guaranteed windows + insurance can cut buyer power ~25–30%.
| Metric | 2024 Data | Impact |
|---|---|---|
| OEM/Leasing orders | Hertz 2021:100k | High buyer leverage |
| Dealer concentration | Top150=38% sales | Regional bidding power |
| Reliability priority | 68% shippers | Price pressure reduced |
| Claims premium | <0.5% → 10–12% | Supplier pricing power |
Preview the Actual Deliverable
Zero Porter's Five Forces Analysis
This preview shows the exact Zero Porter's Five Forces Analysis you'll receive immediately after purchase—no placeholders, no mockups. The document displayed is the full, professionally formatted analysis ready to download and use the moment you buy. You’ll get instant access to this identical file with no additional setup required.
Description
Elevate Your Analysis with the Complete Porter's Five Forces Analysis
Zero’s Porter’s Five Forces snapshot highlights competitive intensity, supplier and buyer leverage, threat of substitutes, and barriers to entry. This brief view surfaces key pressures shaping Zero’s market position. Unlock the full Porter’s Five Forces Analysis for force-by-force ratings, visuals, and actionable strategy. Get the consultant-grade report to inform investment and planning.
Suppliers Bargaining Power
Driver and labor scarcity
Japan faces a chronic truck driver shortfall of over 100,000 drivers in 2024, tightening labor supplier power and lifting bargaining leverage. Wage inflation (roughly 6% year-on-year in 2023–24 for transport wages) and stricter work-hour rules can raise ZERO’s operating costs or cap capacity. Heavy reliance on subcontracted owner-operators amplifies exposure to spot-rate spikes. Building training pipelines and retention programs reduces this supplier leverage.
Truck, trailer, and specialized carrier OEMs
Car-carrying rigs, low-loaders and motorcycle racks are niche assets with limited OEM choice, with the top five commercial vehicle OEMs supplying over 70% of heavy-truck units globally in 2024, concentrating supplier power.
Long lead times of 6–12 months and capex per specialized unit often exceeding USD 120,000 give suppliers strong negotiation leverage.
Parts availability directly affects fleet uptime and maintenance costs, while fleet standardization and multi-sourcing reduce dependence and lower total cost of ownership.
Fuel and energy providers
Diesel price volatility and limited alternatives heighten supplier power: fuel typically represents 20–30% of carrier opex, and retail diesel swings in 2024 saw monthly movements exceeding 10% in many markets. Fuel surcharges help pass costs through but often lag by 30–60 days, compressing margins. Shift toward EV/FCV or biofuel fleets (around 1.5% of new heavy-duty sales in 2024) creates new supplier dependencies. Fuel hedging and bulk contracts can cover up to ~70% of consumption, partially rebalancing power.
IT, telematics, and compliance services
Route optimization, ELD/telematics, and digital inspection tools are mission-critical, giving vendors leverage as switching core platforms is costly and risky; the global fleet telematics market was estimated near $28 billion in 2024 and US ELD adoption is effectively universal since the 2017 mandate. Cybersecurity and automaker data-integration needs increase specialization, while open APIs and staged migrations can reduce lock-in and migration costs.
- High lock-in: costly core-platform switches
- Market size: ~28B (2024)
- Regulatory: ELD mandate drives near-universal adoption
- Mitigants: open APIs, staged migration
Ports, rail ramps, and yard infrastructure
Access to limited berths, rail ramps, and secure yards creates capacity bottlenecks that give infrastructure operators strong bargaining power through slot allocations and high storage fees; congestion raises dwell costs and degrades service levels, forcing shippers to absorb delays or pay premiums. Long-term access agreements and distributed yards reduce supplier leverage by diversifying access and smoothing flows.
- Capacity bottlenecks: limited berths/ramps
- Pricing leverage: slot allocations, storage fees
- Performance impact: congestion → higher dwell costs
- Mitigation: long-term agreements, distributed yards
Japan trucker shortage, wage inflation and OEM concentration squeeze freight margins
Supplier power is high: Japan trucker shortfall >100,000 (2024) and transport wage inflation ~6% YoY (2023–24) tighten labor leverage. OEM concentration (top‑5 >70% of heavy trucks, 2024) and specialized assets (capex per unit >USD120,000) raise procurement risk. Fuel (20–30% opex) volatility and a ~$28B fleet telematics market (2024) add vendor lock‑in; multi-sourcing and long‑term contracts mitigate.
| Metric | Value (year) |
|---|---|
| Driver shortfall | >100,000 (2024) |
| Wage inflation | ~6% YoY (2023–24) |
| OEM concentration | Top‑5 >70% (2024) |
| Capex per unit | >USD120,000 |
| Fuel share | 20–30% opex |
| Telematics market | ~USD28B (2024) |
What is included in the product
Detailed Word Document
Comprehensive Porter's Five Forces analysis for Zero that assesses competitive rivalry, supplier and buyer power, threats from substitutes and new entrants, identifies disruptive risks and protective barriers, and is editable for reports.
Customizable Excel Spreadsheet
Zero Porter's Five Forces compresses competitive pressure into a single, editable one-sheet—ideal for fast strategic decisions and slide-ready summaries. Toggle scenarios, update inputs, and export clean charts without macros so teams can align quickly and act on real-time market shifts.
Customers Bargaining Power
Automakers and large fleet clients
OEMs and leasing/rental majors buy at scale and run formal tenders—Hertz’s 2021 order for 100,000 Teslas exemplifies fleet buying power—enabling strong price pressure and strict service requirements.
Their scheduling flexibility and volume leverage force providers to accept tight service windows and inventory commitments, with performance KPIs and penalty clauses commonly applied.
Multi-year contracts deliver revenue stability but typically at thin, often single-digit margins, compressing suppliers’ pricing power.
Dealers, auctions, and logistics integrators
Dealer groups and auction houses aggregate volumes regionally—top 150 dealer groups accounted for ~38% of US franchise sales in 2024—giving them leverage to solicit lane-by-lane bids. Auctions and logistics integrators (Cox/Manheim scale processing >5M wholesale units annually) can shift volumes between carriers, forcing price competition. Seasonality around model launches spikes demand and increases customer bargaining power. Value-added services like registration and inspection bundles reduce pure price comparisons.
Individual customers and relocations
Individual relocation customers buy low volumes and typically show higher willingness-to-pay, reducing their bargaining power; in 2024 over 60% of movers research options online, boosting price transparency and comparison. Service quality and a damage-free record remain primary selection drivers, often outweighing small price differences. ZERO differentiates through convenient administrative support versus low-cost competitors, sustaining pricing power.
Sensitivity to lead time and damage rates
Buyers prioritize on-time delivery and low damage rates over marginal price cuts; 2024 surveys show about 68% of shippers rank reliability above price. Carriers reporting claims ratios below 0.5% can command roughly 10–12% premium. For shipments valued over $50,000, risk-transfer terms become key negotiation levers; guaranteed delivery windows and insurance options can cut buyer bargaining power by as much as 25–30%.
- Sensitivity: on-time > price (68% 2024)
- Claims ratio: <0.5% → 10–12% premium
- High-value cargo: >$50,000 drives risk-transfer
- Mitigants: guaranteed windows + insurance → −25–30% buyer power
Multi-sourcing and contractual flexibility
Large shippers commonly split volumes across 2–4 carriers to hedge operational risk, keeping carriers price-competitive on lanes and accessorials; spot and contract blended sourcing raised tender fragmentation in 2024. Shorter contract cycles sustain pricing pressure amid volatile fuel costs. Integrated inspection and registration bundles increase switching costs for shippers.
- Multi-sourcing: 2–4 carriers
- Pricing pressure: shorter cycles
- Accessorial focus: sustained competition
- Switching costs: higher with integrated services
Scale buyers and dealer concentration boost carrier pricing power; reliability commands premiums
OEMs and leasing majors buy at scale (Hertz 2021: 100,000 Teslas), driving strong price/service demands; top 150 dealer groups = ~38% of US franchise sales (2024). Large shippers split volumes across 2–4 carriers, while 68% of shippers rank reliability over price (2024). Carriers with <0.5% claims can command ~10–12% premium; guaranteed windows + insurance can cut buyer power ~25–30%.
| Metric | 2024 Data | Impact |
|---|---|---|
| OEM/Leasing orders | Hertz 2021:100k | High buyer leverage |
| Dealer concentration | Top150=38% sales | Regional bidding power |
| Reliability priority | 68% shippers | Price pressure reduced |
| Claims premium | <0.5% → 10–12% | Supplier pricing power |
Preview the Actual Deliverable
Zero Porter's Five Forces Analysis
This preview shows the exact Zero Porter's Five Forces Analysis you'll receive immediately after purchase—no placeholders, no mockups. The document displayed is the full, professionally formatted analysis ready to download and use the moment you buy. You’ll get instant access to this identical file with no additional setup required.











