Zevia Business Model Canvas

Unlock the business model canvas for a leading natural, zero-calorie beverage brand
Unlock the full strategic blueprint behind Zevia’s Business Model Canvas. This in-depth canvas reveals value propositions, channels, partnerships and revenue mechanics that power growth in the natural, zero‑calorie beverage space. Ideal for entrepreneurs, investors and strategists seeking actionable benchmarks. Download the editable Word/Excel pack to model growth, spot risks and adapt proven tactics.
Partnerships

Stevia and natural ingredient suppliers
Secure, high-quality stevia leaf extract sources ensure consistency and support Zevia’s clean-label claims, with ingredient specs often locked via 3-5 year supplier contracts. Multi-sourcing from regions like China and Paraguay reduces supply risk and price volatility by diversifying crop and processing exposure. Strategic partners collaborate on agronomy and extraction improvements to raise Reb A purity and yield. Long-term agreements lock in volume commitments and predefined quality specifications.
Co-packers and contract manufacturers
Trusted beverage co-packers provide scalable canning and bottling capacity, using high-speed lines typically in the 200–300 cans/min range.
They enable fast line changeovers across sodas, energy, teas, mixers and sparkling water, often achieving sub‑hour changeovers with experienced teams.
Quality and food safety certifications such as SQF, BRC and FSSC 22000 are essential for shelf-life and retailer acceptance.
Geographic diversification of co-pack partners reduces freight costs and lead times, lowering transit days and inventory risk.

Packaging and aluminum can vendors
Aluminum can vendors bolster Zevia’s sustainability and premium shelf look; aluminum is 100% recyclable and recycling saves up to 92% energy (Can Manufacturers Institute, 2024). Long-lead packaging (often 8–12 week lead times for custom runs) forces tight forecasting alignment. Custom prints and sizes require rigorous QA to avoid costly reworks, while recycling partnerships reinforce Zevia’s environmental positioning.

Distributors and retail partners
Distributors and retail partners drive Zevia’s shelf presence across grocery, mass, natural and club channels, while national and regional distributors extend reach into convenience and regional chains; joint business planning aligns promotions, assortment and velocity targets to lift sell-through. In 2024 Zevia reported nationwide distribution and continued investment in retailer data-sharing to improve replenishment and planogram compliance.
- Retail shelf presence: grocery, mass, natural, club
- Distributors extend into convenience/regional chains
- Joint business planning: promotions, assortment, velocity
- Data sharing: replenishment, planogram compliance
Digital platforms and logistics providers
Digital marketplaces and DTC enablers expand Zevia’s reach—global e‑commerce hit about 22% of retail sales in 2024 and Amazon held roughly 38% of US e‑commerce—while capturing first‑party shopper data for targeting and assortment decisions. 3PL partners, in a >$1T global 3PL market in 2024, run warehousing, pick‑pack and final‑mile at scale. Performance SLAs (typical on‑time rates 95–99%) protect brand experience and integrations cut stockouts and delivery costs materially (up to ~30% reduction in some implementations).
- Market reach: 22% global e‑commerce (2024)
- Platform concentration: Amazon ~38% US e‑commerce (2024)
- 3PL scale: global 3PL market >$1T (2024)
- SLA targets: 95–99% on‑time
- Impact: integrations can reduce stockouts/delivery costs up to ~30%
Multi-sourced stevia, 200-300 cans/min co-packers, aluminum cans save 92% energy
Zevia relies on multi‑sourced stevia suppliers (3–5 yr contracts; China, Paraguay) to secure Reb A quality and price stability. Co‑packers provide 200–300 cans/min capacity with sub‑hour changeovers; aluminum cans (8–12 wk lead times) support sustainability (92% energy saved via recycling). Distributors, 3PLs and e‑commerce partners drive reach (3PL market >$1T; e‑commerce 22% global, Amazon ~38% US, 2024).
| Partner | Role | 2024 Metric |
|---|---|---|
| Stevia suppliers | Raw ingredient quality/volume | 3–5 yr contracts; multi-source |
| Co‑packers | Canning/bottling | 200–300 cans/min; sub‑hr changeovers |
| Packaging | Aluminum cans | 8–12 wk lead; recycling saves 92% energy |
| Distributors/3PL | Distribution/fulfillment | 3PL market >$1T; e‑commerce 22% global; Amazon ~38% US |
What is included in the product
 Detailed Word Document
A comprehensive Business Model Canvas for Zevia detailing customer segments, value propositions, channels, key partners, activities, resources, revenue streams and cost structure, with integrated analysis of competitive advantages and SWOT. Ideal for investors, advisors, and entrepreneurs seeking a polished, real-world blueprint to validate strategy and support funding or strategic decisions.

 Customizable Excel Spreadsheet
High-level, editable Business Model Canvas for Zevia that condenses its sugar-free beverage strategy into a one-page snapshot, saving hours of structuring and making it easy to compare channels, partners, and revenue streams for rapid decision-making.
Activities

Product R&D and formulation
Zevia develops zero-calorie beverages sweetened with stevia and natural flavors, marketed as zero sugar and zero calories. Rebaudioside A, the principal stevia glycoside, is roughly 200–400× sweeter than sucrose, so Zevia iterates blends and masking systems to match sugared benchmarks without artificial ingredients. R&D validates sensory performance and shelf stability via accelerated and real-time testing. Formulations adhere to clean-label claims—no artificial colors, flavors, or preservatives.
Brand marketing and demand generation
Build awareness around plant-based, zero-sugar benefits by linking stevia education to Zevia’s momentum—following FY2023 net revenue of $173.9M—using digital, influencer, and in-store activations to expand trial. Optimize pricing and promo cadence to raise household penetration, leveraging category promo benchmarks and ROI tracking. Educate consumers on stevia and clean ingredients through content, sampling, and POS materials.

Supply chain and quality management
Plan ingredients, cans and co-packing slots to meet SKU demand across retail and DTC, aligning weekly production to FY2024 revenue scale (~$215M) and seasonal peaks. Maintain rigorous QA/QC and food‑safety protocols with supplier audits and batch testing. Monitor supplier performance, input cost trends (packaging up ~5% in 2024) and track inventory, forecasting and OTIF targets (≈95%).

Channel development and retail execution
In 2024 Zevia prioritized expanding distribution across grocery, mass, natural, club, and convenience channels, negotiating shelf placement, endcaps, and secondary displays to boost visibility. The team enforces planogram adherence and executes in-store merchandising while tracking velocities weekly to identify and correct underperforming SKUs.
- Channel expansion: grocery, mass, natural, club, convenience
- Retail ops: placement, endcaps, secondary displays
- Execution: planogram adherence, velocity tracking, SKU remediation
Data analytics and customer insights
Leverage retail scans and DTC data to inform assortment, pricing and promotional cadence, using granular POS and customer-level purchase data to segment shoppers and tailor messaging; run test-and-learn pilots for new flavors and pack sizes to measure conversion and repeat rate, then scale winners. Forecast demand to reduce OOS and allocate trade spend to channels with highest ROI.
- Retail scans + DTC for assortment
- Segment customers, personalize messaging
- Test flavors/pack sizes, scale winners
- Forecasting to cut OOS, optimize trade ROI
Stevia beverages: $173.9M FY23 → ~$215M FY24; OTIF ≈95%
Zevia formulates stevia‑sweetened beverages, validating sensory and shelf stability while maintaining clean‑label specs. Marketing drives trial and penetration via digital, influencer and in‑store tactics supporting FY2023 revenue $173.9M and FY2024 ~$215M. Operations manage co‑packing, QA, OTIF ≈95% and cost monitoring (packaging +5% in 2024).
| Metric | 2023 | 2024 |
|---|---|---|
| Revenue | $173.9M | ~$215M |
| OTIF | — | ≈95% |
| Packaging cost | — | +5% |
What You See Is What You Get
Business Model Canvas
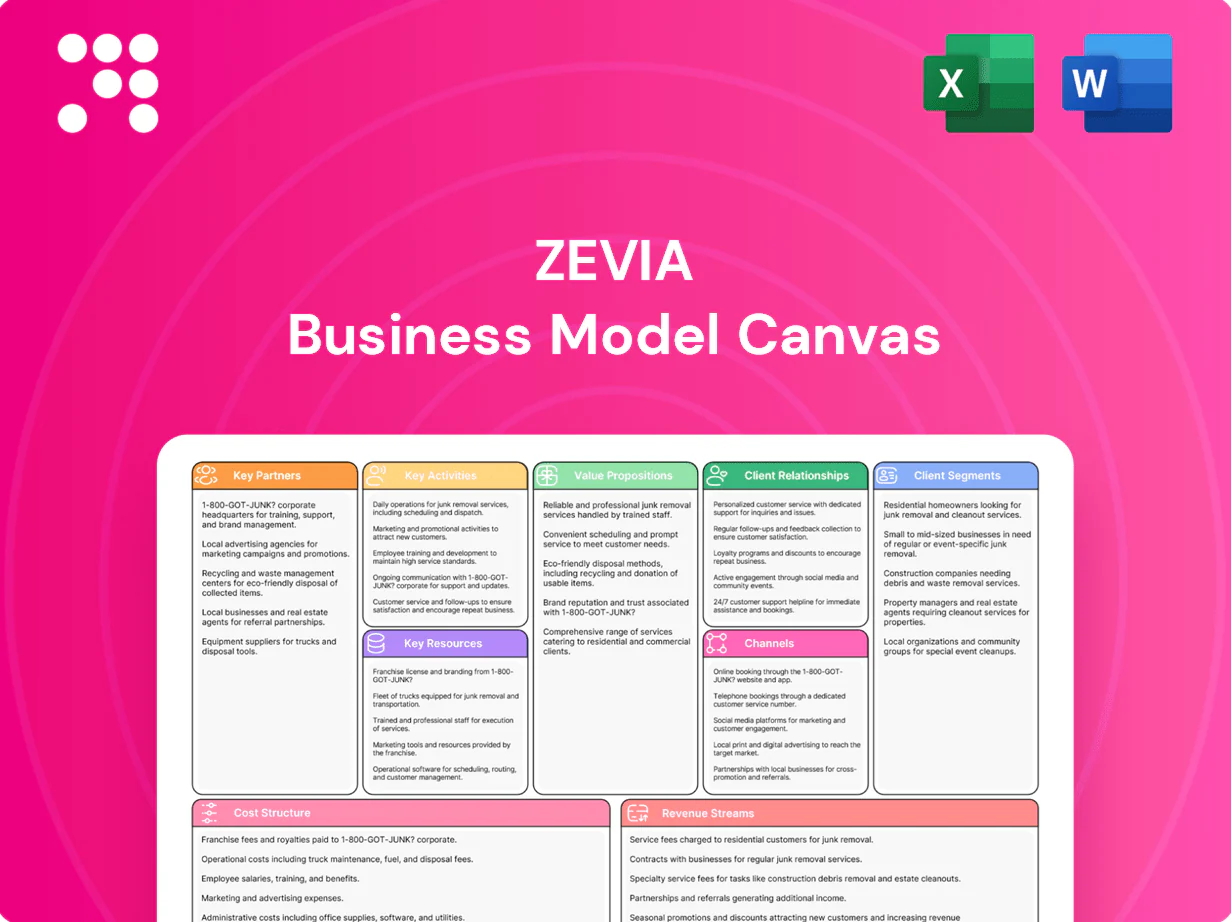
The document previewed here is the exact Zevia Business Model Canvas you’ll receive after purchase, not a mockup or sample. Upon ordering, you’ll instantly get the full, editable file—structured and formatted exactly as shown—for immediate use in presentations, planning, or collaboration. No hidden content, no surprises; what you see is what you’ll download in its complete form.

Unlock the business model canvas for a leading natural, zero-calorie beverage brand
Unlock the full strategic blueprint behind Zevia’s Business Model Canvas. This in-depth canvas reveals value propositions, channels, partnerships and revenue mechanics that power growth in the natural, zero‑calorie beverage space. Ideal for entrepreneurs, investors and strategists seeking actionable benchmarks. Download the editable Word/Excel pack to model growth, spot risks and adapt proven tactics.
Partnerships
Stevia and natural ingredient suppliers
Secure, high-quality stevia leaf extract sources ensure consistency and support Zevia’s clean-label claims, with ingredient specs often locked via 3-5 year supplier contracts. Multi-sourcing from regions like China and Paraguay reduces supply risk and price volatility by diversifying crop and processing exposure. Strategic partners collaborate on agronomy and extraction improvements to raise Reb A purity and yield. Long-term agreements lock in volume commitments and predefined quality specifications.
Co-packers and contract manufacturers
Trusted beverage co-packers provide scalable canning and bottling capacity, using high-speed lines typically in the 200–300 cans/min range.
They enable fast line changeovers across sodas, energy, teas, mixers and sparkling water, often achieving sub‑hour changeovers with experienced teams.
Quality and food safety certifications such as SQF, BRC and FSSC 22000 are essential for shelf-life and retailer acceptance.
Geographic diversification of co-pack partners reduces freight costs and lead times, lowering transit days and inventory risk.
Packaging and aluminum can vendors
Aluminum can vendors bolster Zevia’s sustainability and premium shelf look; aluminum is 100% recyclable and recycling saves up to 92% energy (Can Manufacturers Institute, 2024). Long-lead packaging (often 8–12 week lead times for custom runs) forces tight forecasting alignment. Custom prints and sizes require rigorous QA to avoid costly reworks, while recycling partnerships reinforce Zevia’s environmental positioning.
Distributors and retail partners
Distributors and retail partners drive Zevia’s shelf presence across grocery, mass, natural and club channels, while national and regional distributors extend reach into convenience and regional chains; joint business planning aligns promotions, assortment and velocity targets to lift sell-through. In 2024 Zevia reported nationwide distribution and continued investment in retailer data-sharing to improve replenishment and planogram compliance.
- Retail shelf presence: grocery, mass, natural, club
- Distributors extend into convenience/regional chains
- Joint business planning: promotions, assortment, velocity
- Data sharing: replenishment, planogram compliance
Digital platforms and logistics providers
Digital marketplaces and DTC enablers expand Zevia’s reach—global e‑commerce hit about 22% of retail sales in 2024 and Amazon held roughly 38% of US e‑commerce—while capturing first‑party shopper data for targeting and assortment decisions. 3PL partners, in a >$1T global 3PL market in 2024, run warehousing, pick‑pack and final‑mile at scale. Performance SLAs (typical on‑time rates 95–99%) protect brand experience and integrations cut stockouts and delivery costs materially (up to ~30% reduction in some implementations).
- Market reach: 22% global e‑commerce (2024)
- Platform concentration: Amazon ~38% US e‑commerce (2024)
- 3PL scale: global 3PL market >$1T (2024)
- SLA targets: 95–99% on‑time
- Impact: integrations can reduce stockouts/delivery costs up to ~30%
Multi-sourced stevia, 200-300 cans/min co-packers, aluminum cans save 92% energy
Zevia relies on multi‑sourced stevia suppliers (3–5 yr contracts; China, Paraguay) to secure Reb A quality and price stability. Co‑packers provide 200–300 cans/min capacity with sub‑hour changeovers; aluminum cans (8–12 wk lead times) support sustainability (92% energy saved via recycling). Distributors, 3PLs and e‑commerce partners drive reach (3PL market >$1T; e‑commerce 22% global, Amazon ~38% US, 2024).
| Partner | Role | 2024 Metric |
|---|---|---|
| Stevia suppliers | Raw ingredient quality/volume | 3–5 yr contracts; multi-source |
| Co‑packers | Canning/bottling | 200–300 cans/min; sub‑hr changeovers |
| Packaging | Aluminum cans | 8–12 wk lead; recycling saves 92% energy |
| Distributors/3PL | Distribution/fulfillment | 3PL market >$1T; e‑commerce 22% global; Amazon ~38% US |
What is included in the product
Detailed Word Document
A comprehensive Business Model Canvas for Zevia detailing customer segments, value propositions, channels, key partners, activities, resources, revenue streams and cost structure, with integrated analysis of competitive advantages and SWOT. Ideal for investors, advisors, and entrepreneurs seeking a polished, real-world blueprint to validate strategy and support funding or strategic decisions.
Customizable Excel Spreadsheet
High-level, editable Business Model Canvas for Zevia that condenses its sugar-free beverage strategy into a one-page snapshot, saving hours of structuring and making it easy to compare channels, partners, and revenue streams for rapid decision-making.
Activities
Product R&D and formulation
Zevia develops zero-calorie beverages sweetened with stevia and natural flavors, marketed as zero sugar and zero calories. Rebaudioside A, the principal stevia glycoside, is roughly 200–400× sweeter than sucrose, so Zevia iterates blends and masking systems to match sugared benchmarks without artificial ingredients. R&D validates sensory performance and shelf stability via accelerated and real-time testing. Formulations adhere to clean-label claims—no artificial colors, flavors, or preservatives.
Brand marketing and demand generation
Build awareness around plant-based, zero-sugar benefits by linking stevia education to Zevia’s momentum—following FY2023 net revenue of $173.9M—using digital, influencer, and in-store activations to expand trial. Optimize pricing and promo cadence to raise household penetration, leveraging category promo benchmarks and ROI tracking. Educate consumers on stevia and clean ingredients through content, sampling, and POS materials.
Supply chain and quality management
Plan ingredients, cans and co-packing slots to meet SKU demand across retail and DTC, aligning weekly production to FY2024 revenue scale (~$215M) and seasonal peaks. Maintain rigorous QA/QC and food‑safety protocols with supplier audits and batch testing. Monitor supplier performance, input cost trends (packaging up ~5% in 2024) and track inventory, forecasting and OTIF targets (≈95%).
Channel development and retail execution
In 2024 Zevia prioritized expanding distribution across grocery, mass, natural, club, and convenience channels, negotiating shelf placement, endcaps, and secondary displays to boost visibility. The team enforces planogram adherence and executes in-store merchandising while tracking velocities weekly to identify and correct underperforming SKUs.
- Channel expansion: grocery, mass, natural, club, convenience
- Retail ops: placement, endcaps, secondary displays
- Execution: planogram adherence, velocity tracking, SKU remediation
Data analytics and customer insights
Leverage retail scans and DTC data to inform assortment, pricing and promotional cadence, using granular POS and customer-level purchase data to segment shoppers and tailor messaging; run test-and-learn pilots for new flavors and pack sizes to measure conversion and repeat rate, then scale winners. Forecast demand to reduce OOS and allocate trade spend to channels with highest ROI.
- Retail scans + DTC for assortment
- Segment customers, personalize messaging
- Test flavors/pack sizes, scale winners
- Forecasting to cut OOS, optimize trade ROI
Stevia beverages: $173.9M FY23 → ~$215M FY24; OTIF ≈95%
Zevia formulates stevia‑sweetened beverages, validating sensory and shelf stability while maintaining clean‑label specs. Marketing drives trial and penetration via digital, influencer and in‑store tactics supporting FY2023 revenue $173.9M and FY2024 ~$215M. Operations manage co‑packing, QA, OTIF ≈95% and cost monitoring (packaging +5% in 2024).
| Metric | 2023 | 2024 |
|---|---|---|
| Revenue | $173.9M | ~$215M |
| OTIF | — | ≈95% |
| Packaging cost | — | +5% |
What You See Is What You Get
Business Model Canvas
The document previewed here is the exact Zevia Business Model Canvas you’ll receive after purchase, not a mockup or sample. Upon ordering, you’ll instantly get the full, editable file—structured and formatted exactly as shown—for immediate use in presentations, planning, or collaboration. No hidden content, no surprises; what you see is what you’ll download in its complete form.
Original: $10.00
-65%$10.00
$3.50Description
Unlock the business model canvas for a leading natural, zero-calorie beverage brand
Unlock the full strategic blueprint behind Zevia’s Business Model Canvas. This in-depth canvas reveals value propositions, channels, partnerships and revenue mechanics that power growth in the natural, zero‑calorie beverage space. Ideal for entrepreneurs, investors and strategists seeking actionable benchmarks. Download the editable Word/Excel pack to model growth, spot risks and adapt proven tactics.
Partnerships
Stevia and natural ingredient suppliers
Secure, high-quality stevia leaf extract sources ensure consistency and support Zevia’s clean-label claims, with ingredient specs often locked via 3-5 year supplier contracts. Multi-sourcing from regions like China and Paraguay reduces supply risk and price volatility by diversifying crop and processing exposure. Strategic partners collaborate on agronomy and extraction improvements to raise Reb A purity and yield. Long-term agreements lock in volume commitments and predefined quality specifications.
Co-packers and contract manufacturers
Trusted beverage co-packers provide scalable canning and bottling capacity, using high-speed lines typically in the 200–300 cans/min range.
They enable fast line changeovers across sodas, energy, teas, mixers and sparkling water, often achieving sub‑hour changeovers with experienced teams.
Quality and food safety certifications such as SQF, BRC and FSSC 22000 are essential for shelf-life and retailer acceptance.
Geographic diversification of co-pack partners reduces freight costs and lead times, lowering transit days and inventory risk.
Packaging and aluminum can vendors
Aluminum can vendors bolster Zevia’s sustainability and premium shelf look; aluminum is 100% recyclable and recycling saves up to 92% energy (Can Manufacturers Institute, 2024). Long-lead packaging (often 8–12 week lead times for custom runs) forces tight forecasting alignment. Custom prints and sizes require rigorous QA to avoid costly reworks, while recycling partnerships reinforce Zevia’s environmental positioning.
Distributors and retail partners
Distributors and retail partners drive Zevia’s shelf presence across grocery, mass, natural and club channels, while national and regional distributors extend reach into convenience and regional chains; joint business planning aligns promotions, assortment and velocity targets to lift sell-through. In 2024 Zevia reported nationwide distribution and continued investment in retailer data-sharing to improve replenishment and planogram compliance.
- Retail shelf presence: grocery, mass, natural, club
- Distributors extend into convenience/regional chains
- Joint business planning: promotions, assortment, velocity
- Data sharing: replenishment, planogram compliance
Digital platforms and logistics providers
Digital marketplaces and DTC enablers expand Zevia’s reach—global e‑commerce hit about 22% of retail sales in 2024 and Amazon held roughly 38% of US e‑commerce—while capturing first‑party shopper data for targeting and assortment decisions. 3PL partners, in a >$1T global 3PL market in 2024, run warehousing, pick‑pack and final‑mile at scale. Performance SLAs (typical on‑time rates 95–99%) protect brand experience and integrations cut stockouts and delivery costs materially (up to ~30% reduction in some implementations).
- Market reach: 22% global e‑commerce (2024)
- Platform concentration: Amazon ~38% US e‑commerce (2024)
- 3PL scale: global 3PL market >$1T (2024)
- SLA targets: 95–99% on‑time
- Impact: integrations can reduce stockouts/delivery costs up to ~30%
Multi-sourced stevia, 200-300 cans/min co-packers, aluminum cans save 92% energy
Zevia relies on multi‑sourced stevia suppliers (3–5 yr contracts; China, Paraguay) to secure Reb A quality and price stability. Co‑packers provide 200–300 cans/min capacity with sub‑hour changeovers; aluminum cans (8–12 wk lead times) support sustainability (92% energy saved via recycling). Distributors, 3PLs and e‑commerce partners drive reach (3PL market >$1T; e‑commerce 22% global, Amazon ~38% US, 2024).
| Partner | Role | 2024 Metric |
|---|---|---|
| Stevia suppliers | Raw ingredient quality/volume | 3–5 yr contracts; multi-source |
| Co‑packers | Canning/bottling | 200–300 cans/min; sub‑hr changeovers |
| Packaging | Aluminum cans | 8–12 wk lead; recycling saves 92% energy |
| Distributors/3PL | Distribution/fulfillment | 3PL market >$1T; e‑commerce 22% global; Amazon ~38% US |
What is included in the product
Detailed Word Document
A comprehensive Business Model Canvas for Zevia detailing customer segments, value propositions, channels, key partners, activities, resources, revenue streams and cost structure, with integrated analysis of competitive advantages and SWOT. Ideal for investors, advisors, and entrepreneurs seeking a polished, real-world blueprint to validate strategy and support funding or strategic decisions.
Customizable Excel Spreadsheet
High-level, editable Business Model Canvas for Zevia that condenses its sugar-free beverage strategy into a one-page snapshot, saving hours of structuring and making it easy to compare channels, partners, and revenue streams for rapid decision-making.
Activities
Product R&D and formulation
Zevia develops zero-calorie beverages sweetened with stevia and natural flavors, marketed as zero sugar and zero calories. Rebaudioside A, the principal stevia glycoside, is roughly 200–400× sweeter than sucrose, so Zevia iterates blends and masking systems to match sugared benchmarks without artificial ingredients. R&D validates sensory performance and shelf stability via accelerated and real-time testing. Formulations adhere to clean-label claims—no artificial colors, flavors, or preservatives.
Brand marketing and demand generation
Build awareness around plant-based, zero-sugar benefits by linking stevia education to Zevia’s momentum—following FY2023 net revenue of $173.9M—using digital, influencer, and in-store activations to expand trial. Optimize pricing and promo cadence to raise household penetration, leveraging category promo benchmarks and ROI tracking. Educate consumers on stevia and clean ingredients through content, sampling, and POS materials.
Supply chain and quality management
Plan ingredients, cans and co-packing slots to meet SKU demand across retail and DTC, aligning weekly production to FY2024 revenue scale (~$215M) and seasonal peaks. Maintain rigorous QA/QC and food‑safety protocols with supplier audits and batch testing. Monitor supplier performance, input cost trends (packaging up ~5% in 2024) and track inventory, forecasting and OTIF targets (≈95%).
Channel development and retail execution
In 2024 Zevia prioritized expanding distribution across grocery, mass, natural, club, and convenience channels, negotiating shelf placement, endcaps, and secondary displays to boost visibility. The team enforces planogram adherence and executes in-store merchandising while tracking velocities weekly to identify and correct underperforming SKUs.
- Channel expansion: grocery, mass, natural, club, convenience
- Retail ops: placement, endcaps, secondary displays
- Execution: planogram adherence, velocity tracking, SKU remediation
Data analytics and customer insights
Leverage retail scans and DTC data to inform assortment, pricing and promotional cadence, using granular POS and customer-level purchase data to segment shoppers and tailor messaging; run test-and-learn pilots for new flavors and pack sizes to measure conversion and repeat rate, then scale winners. Forecast demand to reduce OOS and allocate trade spend to channels with highest ROI.
- Retail scans + DTC for assortment
- Segment customers, personalize messaging
- Test flavors/pack sizes, scale winners
- Forecasting to cut OOS, optimize trade ROI
Stevia beverages: $173.9M FY23 → ~$215M FY24; OTIF ≈95%
Zevia formulates stevia‑sweetened beverages, validating sensory and shelf stability while maintaining clean‑label specs. Marketing drives trial and penetration via digital, influencer and in‑store tactics supporting FY2023 revenue $173.9M and FY2024 ~$215M. Operations manage co‑packing, QA, OTIF ≈95% and cost monitoring (packaging +5% in 2024).
| Metric | 2023 | 2024 |
|---|---|---|
| Revenue | $173.9M | ~$215M |
| OTIF | — | ≈95% |
| Packaging cost | — | +5% |
What You See Is What You Get
Business Model Canvas
The document previewed here is the exact Zevia Business Model Canvas you’ll receive after purchase, not a mockup or sample. Upon ordering, you’ll instantly get the full, editable file—structured and formatted exactly as shown—for immediate use in presentations, planning, or collaboration. No hidden content, no surprises; what you see is what you’ll download in its complete form.











