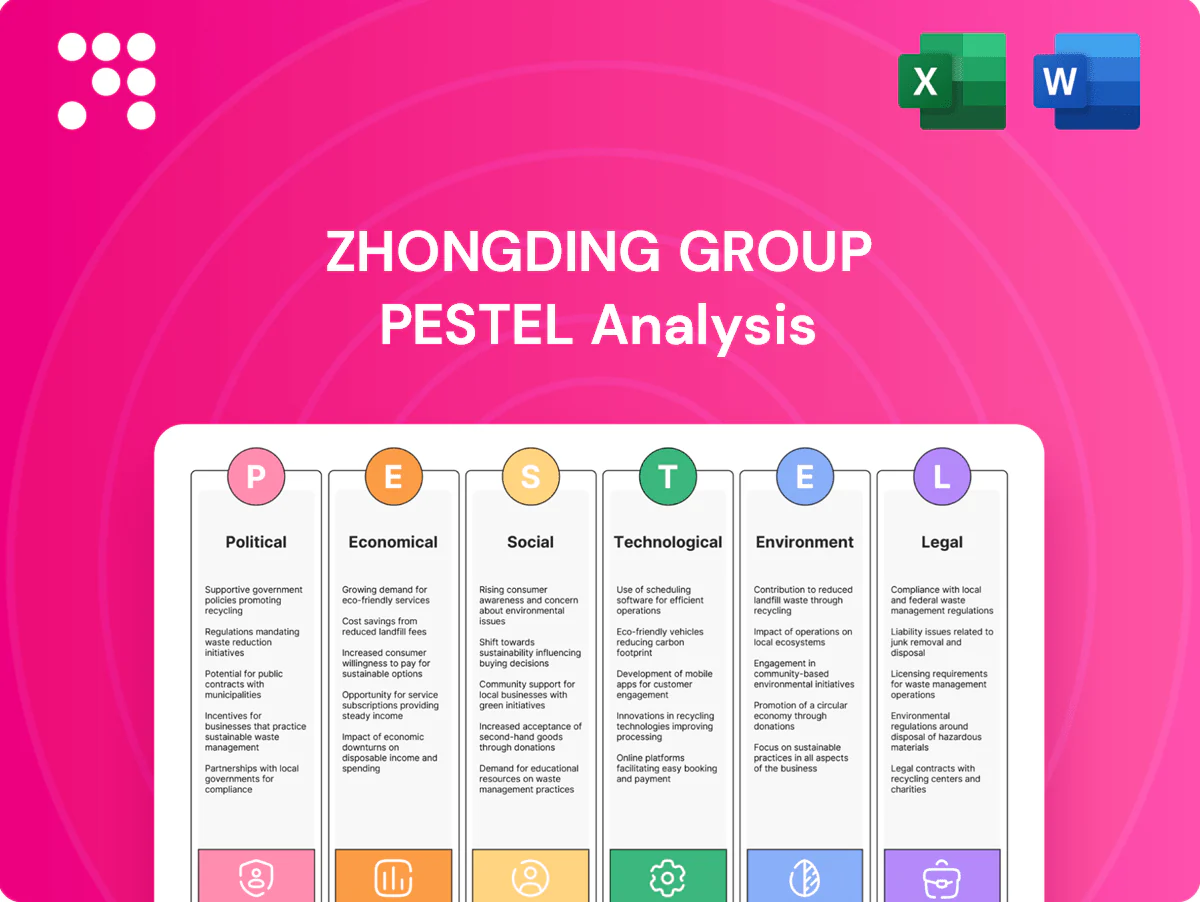
Zhongding Group PESTLE Analysis

Make Smarter Strategic Decisions with a Complete PESTEL View
Zhongding Group faces shifting political, economic, and technological tides that will reshape its supply chains and margins. Our concise PESTLE highlights key risks and opportunities across regulation, macro trends, and sustainability. For detailed, actionable intelligence and sector-specific scenarios, download the full PESTLE analysis and make smarter strategic decisions today.
Political factors

Geopolitical trade tensions and tariffs
Auto parts face shifting tariffs and non-tariff barriers between China, US and EU, with US Section 301 measures targeting roughly $360 billion of Chinese goods and expanded export controls on high-end semiconductor equipment since 2022–23. Sanctions and controls can disrupt access to specialized raw materials and tooling. Zhongding must diversify markets and localize production footprints to mitigate policy shocks. Active trade compliance and robust scenario planning are essential.
Industrial policy and incentives in China
China's industrial policies prioritizing advanced manufacturing and EV supply chains—NEV sales ~55% of new cars in 2024 per CAAM—drive Zhongding's capacity and cost choices; regional subsidies, land discounts and tax breaks (often 3–5 years) plus R&D grants improve margins. But subsidy phase-downs in 2023–24 show policy risk, so aligning product roadmaps with national priorities secures continued support.

Localization and content rules by OEMs
Governments and automakers increasingly push local content for resilience; China represented about 40% of global vehicle production in 2024, intensifying OEM demand for domestic suppliers. Meeting domestic sourcing quotas shapes Zhongding Group plant siting and supplier partnerships, driving nearshore investment and joint ventures. Local engineering capabilities gain political preference, and multi-hub production reduces exposure to single-country risk.

Standards harmonization and regulatory diplomacy
Different safety and material standards across regions (eg CCC in China versus CE in EU and NRTL in US) increase engineering complexity and compliance cost for Zhongding; China accounted for roughly 28% of global manufacturing output in 2024, amplifying exposure. Active participation in ISO/IEC and regional standards bodies raises acceptance of Chinese components; cross-border certification (CE/CCC equivalence pathways) shortens market entry. Diplomatic shifts and trade policy swings continue to speed or stall approvals.
- Standards mismatch: higher engineering cost
- Standards bodies: influence market acceptance
- Cross-border certification: faster entry
- Diplomacy: approvals tied to geopolitical shifts
Infrastructure and logistics policy
China's ports handled about 270 million TEU in 2023; customs digitization in pilot zones cut average clearance times ~25% (2022–24). Green logistics corridors have reduced lead times up to 15% and costs ~8% in trials. The 2024 transport investment plan (~1.2 trillion CNY) expands rail/road networks that reshape plant locations. Export controls on certain chemicals since 2023 can constrain elastomer inputs; bonded-zone proximity speeds global shipments.
- Customs efficiency: clearance times down ~25%
- Port capacity: China ~270M TEU (2023)
- Green corridors: lead times -15%, costs -8%
- Govt investment: ~1.2T CNY (2024) in transport
- Export controls: risk to elastomer inputs
- Bonded zones: faster international dispatch
Tariffs and US export controls reshape auto supply chains; China NEV 55%
Tariffs, US export controls and sanctions since 2022 raise supply risks and force market diversification; customs digitization cut clearance ~25%. China policy favors EV/advanced manufacturing—NEV ~55% of new car sales (2024)—driving local content and subsidies. China made ~40% of global vehicle production (2024); ports handled ~270M TEU (2023) and 1.2T CNY transport investment (2024) reshapes siting.
| Risk | Impact | Data |
|---|---|---|
| Trade controls | Supply/tooling | US measures on ~$360B |
| Policy tilt | Demand for local suppliers | NEV 55% (2024) |
| Logistics | Lead times | Ports 270M TEU (2023) |
What is included in the product
 Detailed Word Document
Explores how political, economic, social, technological, environmental and legal forces specifically impact Zhongding Group, combining data-driven trends and region/industry insights to identify risks and opportunities; designed for executives and investors seeking forward-looking, actionable guidance for strategy and scenario planning.

 Customizable Excel Spreadsheet
A clean, visually segmented PESTLE summary of Zhongding Group that’s easily dropped into presentations or planning sessions, editable for local context and shareable across teams to streamline external risk discussions and client reports.
Economic factors

Automotive cycle sensitivity
Demand for Zhongding's products closely follows global light-vehicle and industrial machinery output, with EVs lifting demand as global electric car sales reached about 14.6 million units in 2024 (roughly 17% market share, IEA), partially offsetting traditional ICE declines.
Downcycles compress pricing and capacity utilization, while stable aftermarket sales and home appliances divisions add counter-cyclical revenue buffering.
Management-visible flexible cost structures and variable labor inputs have historically cushioned margins during volatility, limiting EBITDA downside in prior industry slowdowns.
Raw material and energy price volatility
Elastomers, petrochemicals and carbon black track Brent crude — Brent averaged about $86/bbl in 2024 — while China butadiene CFR rose roughly 18% in 2024, driving raw material cost volatility for Zhongding Group. Energy costs (electricity and steam) increased in China ~8% in 2024, materially affecting curing and compounding economics. Index-linked supply contracts and hedging programs covering a meaningful share of purchases help protect margins, while supplier diversification reduces single-sourced input risk.

FX exposure and global revenue mix
USD and EUR swings (USD/CNY around 7.2 in 2024) materially affect Zhongding Group’s reported results and export competitiveness, while emerging market currency volatility raises margin risk in LATAM and SEA. Local production and procurement in key markets act as natural hedges, reducing FX pass-through. Contractual pricing clauses and active treasury hedging stabilize cash flows. Improved FX forecasting tightens working capital and reduces financing cost.

Customer concentration with OEMs and Tier-1s
Large OEMs and Tier-1 customers exert strong pricing and quality demands, forcing Zhongding to prioritize cost efficiency and tightened quality controls.
Winning vehicle platform programs boosts volumes but increases dependency risk as a few platform wins can represent a large share of production.
Geographic and segment diversification, plus multi-year supply agreements, improve revenue visibility and mitigate concentration exposure.
- Customer concentration risk
- Platform-driven volume dependency
- Regional/segment diversification
- Long-term contracts enhance visibility
Logistics and supply chain resilience costs
Post-pandemic freight and inventory buffers have lifted logistics-driven operating costs—industry averages show logistics spend running about 20–30% above 2019 levels—pressuring Zhongding Group’s margins. Dual-sourcing and regionalization add redundancy and ~15–25% incremental procurement/qualification cost but reduce disruption risk. Nearshoring to key markets can cut lead times by up to 30–40%. Advanced digital supply planning has reduced stockouts and obsolescence by roughly 25–50% in adopters.
- Higher logistics spend: 20–30% vs 2019
- Redundancy cost: +15–25%
- Nearshoring lead-time cut: up to 30–40%
- Digital planning benefit: stockouts/obsolescence down 25–50%
Tariffs and US export controls reshape auto supply chains; China NEV 55%
Demand ties to global light-vehicle output with EVs at ~14.6M units (17% share, 2024 IEA), cushioning ICE decline; Brent averaged ~$86/bbl (2024) and China butadiene +18% drove input cost swings; electricity/steam +8% in China (2024) and logistics costs +20–30% vs 2019 pressure margins; USD/CNY ~7.2 (2024) and regional production act as natural FX hedges.
| Metric | 2024 value |
|---|---|
| EV sales | 14.6M (17%) |
| Brent | $86/bbl |
| Butadiene China | +18% |
| Electricity China | +8% |
| Logistics vs 2019 | +20–30% |
| USD/CNY | ~7.2 |
Preview Before You Purchase
Zhongding Group PESTLE Analysis
The preview shown here is the exact Zhongding Group PESTLE Analysis you’ll receive after purchase—fully formatted and ready to use. The layout, content, and structure visible are exactly what you’ll download immediately after buying, with no placeholders or surprises. This is the final, professionally structured file you’ll own upon checkout.

Make Smarter Strategic Decisions with a Complete PESTEL View
Zhongding Group faces shifting political, economic, and technological tides that will reshape its supply chains and margins. Our concise PESTLE highlights key risks and opportunities across regulation, macro trends, and sustainability. For detailed, actionable intelligence and sector-specific scenarios, download the full PESTLE analysis and make smarter strategic decisions today.
Political factors
Geopolitical trade tensions and tariffs
Auto parts face shifting tariffs and non-tariff barriers between China, US and EU, with US Section 301 measures targeting roughly $360 billion of Chinese goods and expanded export controls on high-end semiconductor equipment since 2022–23. Sanctions and controls can disrupt access to specialized raw materials and tooling. Zhongding must diversify markets and localize production footprints to mitigate policy shocks. Active trade compliance and robust scenario planning are essential.
Industrial policy and incentives in China
China's industrial policies prioritizing advanced manufacturing and EV supply chains—NEV sales ~55% of new cars in 2024 per CAAM—drive Zhongding's capacity and cost choices; regional subsidies, land discounts and tax breaks (often 3–5 years) plus R&D grants improve margins. But subsidy phase-downs in 2023–24 show policy risk, so aligning product roadmaps with national priorities secures continued support.
Localization and content rules by OEMs
Governments and automakers increasingly push local content for resilience; China represented about 40% of global vehicle production in 2024, intensifying OEM demand for domestic suppliers. Meeting domestic sourcing quotas shapes Zhongding Group plant siting and supplier partnerships, driving nearshore investment and joint ventures. Local engineering capabilities gain political preference, and multi-hub production reduces exposure to single-country risk.
Standards harmonization and regulatory diplomacy
Different safety and material standards across regions (eg CCC in China versus CE in EU and NRTL in US) increase engineering complexity and compliance cost for Zhongding; China accounted for roughly 28% of global manufacturing output in 2024, amplifying exposure. Active participation in ISO/IEC and regional standards bodies raises acceptance of Chinese components; cross-border certification (CE/CCC equivalence pathways) shortens market entry. Diplomatic shifts and trade policy swings continue to speed or stall approvals.
- Standards mismatch: higher engineering cost
- Standards bodies: influence market acceptance
- Cross-border certification: faster entry
- Diplomacy: approvals tied to geopolitical shifts
Infrastructure and logistics policy
China's ports handled about 270 million TEU in 2023; customs digitization in pilot zones cut average clearance times ~25% (2022–24). Green logistics corridors have reduced lead times up to 15% and costs ~8% in trials. The 2024 transport investment plan (~1.2 trillion CNY) expands rail/road networks that reshape plant locations. Export controls on certain chemicals since 2023 can constrain elastomer inputs; bonded-zone proximity speeds global shipments.
- Customs efficiency: clearance times down ~25%
- Port capacity: China ~270M TEU (2023)
- Green corridors: lead times -15%, costs -8%
- Govt investment: ~1.2T CNY (2024) in transport
- Export controls: risk to elastomer inputs
- Bonded zones: faster international dispatch
Tariffs and US export controls reshape auto supply chains; China NEV 55%
Tariffs, US export controls and sanctions since 2022 raise supply risks and force market diversification; customs digitization cut clearance ~25%. China policy favors EV/advanced manufacturing—NEV ~55% of new car sales (2024)—driving local content and subsidies. China made ~40% of global vehicle production (2024); ports handled ~270M TEU (2023) and 1.2T CNY transport investment (2024) reshapes siting.
| Risk | Impact | Data |
|---|---|---|
| Trade controls | Supply/tooling | US measures on ~$360B |
| Policy tilt | Demand for local suppliers | NEV 55% (2024) |
| Logistics | Lead times | Ports 270M TEU (2023) |
What is included in the product
Detailed Word Document
Explores how political, economic, social, technological, environmental and legal forces specifically impact Zhongding Group, combining data-driven trends and region/industry insights to identify risks and opportunities; designed for executives and investors seeking forward-looking, actionable guidance for strategy and scenario planning.
Customizable Excel Spreadsheet
A clean, visually segmented PESTLE summary of Zhongding Group that’s easily dropped into presentations or planning sessions, editable for local context and shareable across teams to streamline external risk discussions and client reports.
Economic factors
Automotive cycle sensitivity
Demand for Zhongding's products closely follows global light-vehicle and industrial machinery output, with EVs lifting demand as global electric car sales reached about 14.6 million units in 2024 (roughly 17% market share, IEA), partially offsetting traditional ICE declines.
Downcycles compress pricing and capacity utilization, while stable aftermarket sales and home appliances divisions add counter-cyclical revenue buffering.
Management-visible flexible cost structures and variable labor inputs have historically cushioned margins during volatility, limiting EBITDA downside in prior industry slowdowns.
Raw material and energy price volatility
Elastomers, petrochemicals and carbon black track Brent crude — Brent averaged about $86/bbl in 2024 — while China butadiene CFR rose roughly 18% in 2024, driving raw material cost volatility for Zhongding Group. Energy costs (electricity and steam) increased in China ~8% in 2024, materially affecting curing and compounding economics. Index-linked supply contracts and hedging programs covering a meaningful share of purchases help protect margins, while supplier diversification reduces single-sourced input risk.
FX exposure and global revenue mix
USD and EUR swings (USD/CNY around 7.2 in 2024) materially affect Zhongding Group’s reported results and export competitiveness, while emerging market currency volatility raises margin risk in LATAM and SEA. Local production and procurement in key markets act as natural hedges, reducing FX pass-through. Contractual pricing clauses and active treasury hedging stabilize cash flows. Improved FX forecasting tightens working capital and reduces financing cost.
Customer concentration with OEMs and Tier-1s
Large OEMs and Tier-1 customers exert strong pricing and quality demands, forcing Zhongding to prioritize cost efficiency and tightened quality controls.
Winning vehicle platform programs boosts volumes but increases dependency risk as a few platform wins can represent a large share of production.
Geographic and segment diversification, plus multi-year supply agreements, improve revenue visibility and mitigate concentration exposure.
- Customer concentration risk
- Platform-driven volume dependency
- Regional/segment diversification
- Long-term contracts enhance visibility
Logistics and supply chain resilience costs
Post-pandemic freight and inventory buffers have lifted logistics-driven operating costs—industry averages show logistics spend running about 20–30% above 2019 levels—pressuring Zhongding Group’s margins. Dual-sourcing and regionalization add redundancy and ~15–25% incremental procurement/qualification cost but reduce disruption risk. Nearshoring to key markets can cut lead times by up to 30–40%. Advanced digital supply planning has reduced stockouts and obsolescence by roughly 25–50% in adopters.
- Higher logistics spend: 20–30% vs 2019
- Redundancy cost: +15–25%
- Nearshoring lead-time cut: up to 30–40%
- Digital planning benefit: stockouts/obsolescence down 25–50%
Tariffs and US export controls reshape auto supply chains; China NEV 55%
Demand ties to global light-vehicle output with EVs at ~14.6M units (17% share, 2024 IEA), cushioning ICE decline; Brent averaged ~$86/bbl (2024) and China butadiene +18% drove input cost swings; electricity/steam +8% in China (2024) and logistics costs +20–30% vs 2019 pressure margins; USD/CNY ~7.2 (2024) and regional production act as natural FX hedges.
| Metric | 2024 value |
|---|---|
| EV sales | 14.6M (17%) |
| Brent | $86/bbl |
| Butadiene China | +18% |
| Electricity China | +8% |
| Logistics vs 2019 | +20–30% |
| USD/CNY | ~7.2 |
Preview Before You Purchase
Zhongding Group PESTLE Analysis
The preview shown here is the exact Zhongding Group PESTLE Analysis you’ll receive after purchase—fully formatted and ready to use. The layout, content, and structure visible are exactly what you’ll download immediately after buying, with no placeholders or surprises. This is the final, professionally structured file you’ll own upon checkout.
Original: $10.00
-65%$10.00
$3.50Description
Make Smarter Strategic Decisions with a Complete PESTEL View
Zhongding Group faces shifting political, economic, and technological tides that will reshape its supply chains and margins. Our concise PESTLE highlights key risks and opportunities across regulation, macro trends, and sustainability. For detailed, actionable intelligence and sector-specific scenarios, download the full PESTLE analysis and make smarter strategic decisions today.
Political factors
Geopolitical trade tensions and tariffs
Auto parts face shifting tariffs and non-tariff barriers between China, US and EU, with US Section 301 measures targeting roughly $360 billion of Chinese goods and expanded export controls on high-end semiconductor equipment since 2022–23. Sanctions and controls can disrupt access to specialized raw materials and tooling. Zhongding must diversify markets and localize production footprints to mitigate policy shocks. Active trade compliance and robust scenario planning are essential.
Industrial policy and incentives in China
China's industrial policies prioritizing advanced manufacturing and EV supply chains—NEV sales ~55% of new cars in 2024 per CAAM—drive Zhongding's capacity and cost choices; regional subsidies, land discounts and tax breaks (often 3–5 years) plus R&D grants improve margins. But subsidy phase-downs in 2023–24 show policy risk, so aligning product roadmaps with national priorities secures continued support.
Localization and content rules by OEMs
Governments and automakers increasingly push local content for resilience; China represented about 40% of global vehicle production in 2024, intensifying OEM demand for domestic suppliers. Meeting domestic sourcing quotas shapes Zhongding Group plant siting and supplier partnerships, driving nearshore investment and joint ventures. Local engineering capabilities gain political preference, and multi-hub production reduces exposure to single-country risk.
Standards harmonization and regulatory diplomacy
Different safety and material standards across regions (eg CCC in China versus CE in EU and NRTL in US) increase engineering complexity and compliance cost for Zhongding; China accounted for roughly 28% of global manufacturing output in 2024, amplifying exposure. Active participation in ISO/IEC and regional standards bodies raises acceptance of Chinese components; cross-border certification (CE/CCC equivalence pathways) shortens market entry. Diplomatic shifts and trade policy swings continue to speed or stall approvals.
- Standards mismatch: higher engineering cost
- Standards bodies: influence market acceptance
- Cross-border certification: faster entry
- Diplomacy: approvals tied to geopolitical shifts
Infrastructure and logistics policy
China's ports handled about 270 million TEU in 2023; customs digitization in pilot zones cut average clearance times ~25% (2022–24). Green logistics corridors have reduced lead times up to 15% and costs ~8% in trials. The 2024 transport investment plan (~1.2 trillion CNY) expands rail/road networks that reshape plant locations. Export controls on certain chemicals since 2023 can constrain elastomer inputs; bonded-zone proximity speeds global shipments.
- Customs efficiency: clearance times down ~25%
- Port capacity: China ~270M TEU (2023)
- Green corridors: lead times -15%, costs -8%
- Govt investment: ~1.2T CNY (2024) in transport
- Export controls: risk to elastomer inputs
- Bonded zones: faster international dispatch
Tariffs and US export controls reshape auto supply chains; China NEV 55%
Tariffs, US export controls and sanctions since 2022 raise supply risks and force market diversification; customs digitization cut clearance ~25%. China policy favors EV/advanced manufacturing—NEV ~55% of new car sales (2024)—driving local content and subsidies. China made ~40% of global vehicle production (2024); ports handled ~270M TEU (2023) and 1.2T CNY transport investment (2024) reshapes siting.
| Risk | Impact | Data |
|---|---|---|
| Trade controls | Supply/tooling | US measures on ~$360B |
| Policy tilt | Demand for local suppliers | NEV 55% (2024) |
| Logistics | Lead times | Ports 270M TEU (2023) |
What is included in the product
Detailed Word Document
Explores how political, economic, social, technological, environmental and legal forces specifically impact Zhongding Group, combining data-driven trends and region/industry insights to identify risks and opportunities; designed for executives and investors seeking forward-looking, actionable guidance for strategy and scenario planning.
Customizable Excel Spreadsheet
A clean, visually segmented PESTLE summary of Zhongding Group that’s easily dropped into presentations or planning sessions, editable for local context and shareable across teams to streamline external risk discussions and client reports.
Economic factors
Automotive cycle sensitivity
Demand for Zhongding's products closely follows global light-vehicle and industrial machinery output, with EVs lifting demand as global electric car sales reached about 14.6 million units in 2024 (roughly 17% market share, IEA), partially offsetting traditional ICE declines.
Downcycles compress pricing and capacity utilization, while stable aftermarket sales and home appliances divisions add counter-cyclical revenue buffering.
Management-visible flexible cost structures and variable labor inputs have historically cushioned margins during volatility, limiting EBITDA downside in prior industry slowdowns.
Raw material and energy price volatility
Elastomers, petrochemicals and carbon black track Brent crude — Brent averaged about $86/bbl in 2024 — while China butadiene CFR rose roughly 18% in 2024, driving raw material cost volatility for Zhongding Group. Energy costs (electricity and steam) increased in China ~8% in 2024, materially affecting curing and compounding economics. Index-linked supply contracts and hedging programs covering a meaningful share of purchases help protect margins, while supplier diversification reduces single-sourced input risk.
FX exposure and global revenue mix
USD and EUR swings (USD/CNY around 7.2 in 2024) materially affect Zhongding Group’s reported results and export competitiveness, while emerging market currency volatility raises margin risk in LATAM and SEA. Local production and procurement in key markets act as natural hedges, reducing FX pass-through. Contractual pricing clauses and active treasury hedging stabilize cash flows. Improved FX forecasting tightens working capital and reduces financing cost.
Customer concentration with OEMs and Tier-1s
Large OEMs and Tier-1 customers exert strong pricing and quality demands, forcing Zhongding to prioritize cost efficiency and tightened quality controls.
Winning vehicle platform programs boosts volumes but increases dependency risk as a few platform wins can represent a large share of production.
Geographic and segment diversification, plus multi-year supply agreements, improve revenue visibility and mitigate concentration exposure.
- Customer concentration risk
- Platform-driven volume dependency
- Regional/segment diversification
- Long-term contracts enhance visibility
Logistics and supply chain resilience costs
Post-pandemic freight and inventory buffers have lifted logistics-driven operating costs—industry averages show logistics spend running about 20–30% above 2019 levels—pressuring Zhongding Group’s margins. Dual-sourcing and regionalization add redundancy and ~15–25% incremental procurement/qualification cost but reduce disruption risk. Nearshoring to key markets can cut lead times by up to 30–40%. Advanced digital supply planning has reduced stockouts and obsolescence by roughly 25–50% in adopters.
- Higher logistics spend: 20–30% vs 2019
- Redundancy cost: +15–25%
- Nearshoring lead-time cut: up to 30–40%
- Digital planning benefit: stockouts/obsolescence down 25–50%
Tariffs and US export controls reshape auto supply chains; China NEV 55%
Demand ties to global light-vehicle output with EVs at ~14.6M units (17% share, 2024 IEA), cushioning ICE decline; Brent averaged ~$86/bbl (2024) and China butadiene +18% drove input cost swings; electricity/steam +8% in China (2024) and logistics costs +20–30% vs 2019 pressure margins; USD/CNY ~7.2 (2024) and regional production act as natural FX hedges.
| Metric | 2024 value |
|---|---|
| EV sales | 14.6M (17%) |
| Brent | $86/bbl |
| Butadiene China | +18% |
| Electricity China | +8% |
| Logistics vs 2019 | +20–30% |
| USD/CNY | ~7.2 |
Preview Before You Purchase
Zhongding Group PESTLE Analysis
The preview shown here is the exact Zhongding Group PESTLE Analysis you’ll receive after purchase—fully formatted and ready to use. The layout, content, and structure visible are exactly what you’ll download immediately after buying, with no placeholders or surprises. This is the final, professionally structured file you’ll own upon checkout.











