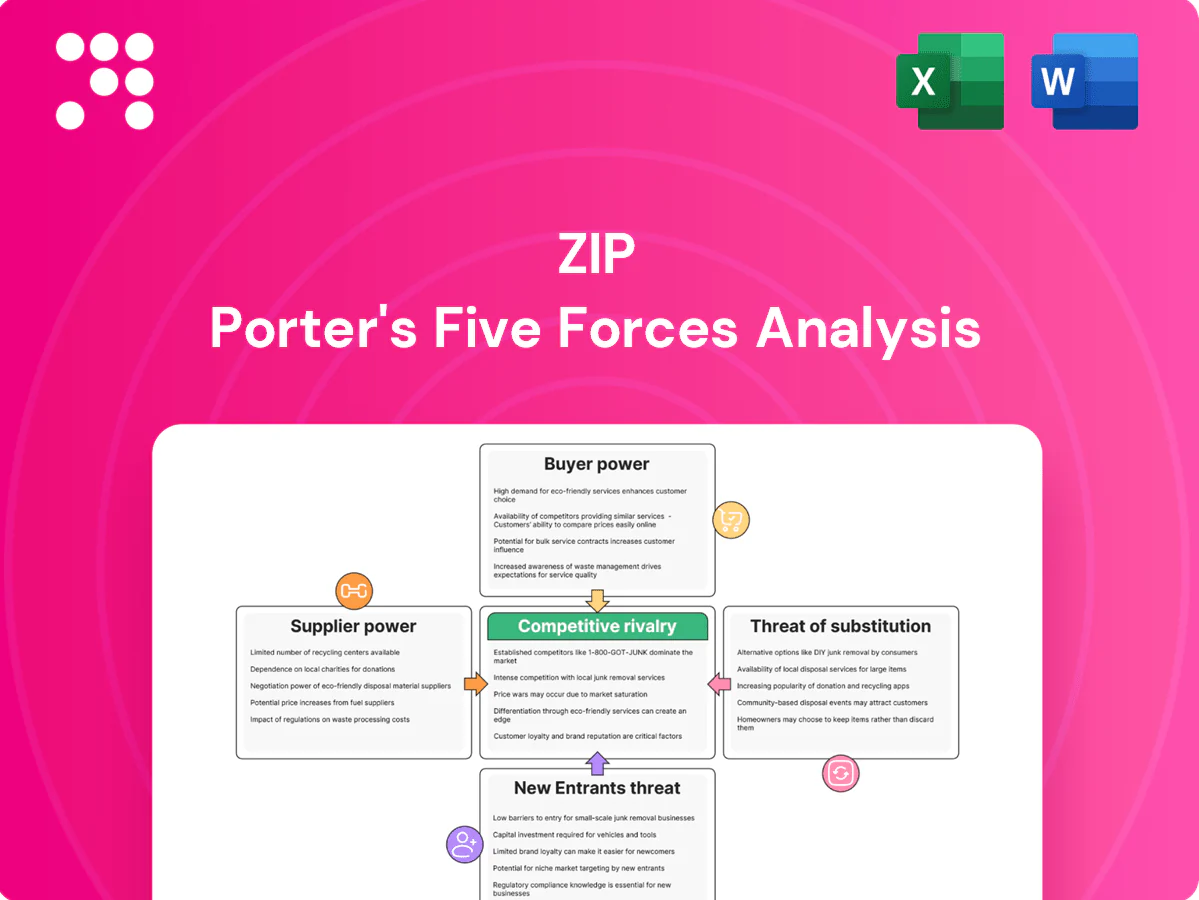
Zip Porter's Five Forces Analysis

Don't Miss the Bigger Picture
Zip's Porter's Five Forces snapshot highlights competitive intensity, buyer and supplier dynamics, threat of substitutes, and barriers to entry in concise terms. This brief snapshot only scratches the surface. Unlock the full Porter's Five Forces Analysis to explore Zip’s competitive dynamics, market pressures, and strategic advantages in detail.
Suppliers Bargaining Power

Diverse funding sources
Zip relies on warehouse lines, securitizations and bank partnerships for lending capacity; funding providers can reprice or tighten terms in risk-off periods—Federal Funds averaged about 5.3% in 2024, keeping funding costly. Diversification across vehicles reduces single-supplier leverage, but refinancing risk persists when markets seize up. Strong portfolio performance and vintage-level loss metrics materially improve negotiation of spreads and covenant terms.
Payment networks and processors
Processors, gateways and card networks are critical for authorization and settlement, creating high switching costs from integrations, PCI certifications and uptime SLAs. Visa and Mastercard together handled roughly 80% of global card volume in 2023, so large processors wield moderate power via tiered pricing, holds and service tiers. Redundancy and multi-homing by merchants reduce single-supplier leverage.

Data, fraud, and identity vendors
KYC/AML, device intelligence and credit-data providers are essential for underwriting and compliance, with the global digital identity market reaching about $26.6 billion in 2024, underpinning transaction screening and fraud prevention. Proprietary signals and unique data models give vendors pricing power and switching costs. Multi-vendor stacks reduce single-vendor dependence but raise integration costs and operational complexity. Volume commitments commonly unlock 10–25% discounts and stronger SLAs.

Cloud and infrastructure providers
Hosting, analytics and CDNs enable real-time decisioning and uptime with platform availability targets commonly at 99.99%; they are core to Zip’s product SLAs. Hyperscalers hold market share (AWS ~32%, Azure ~23%, GCP ~11% in 2024) and exert pricing power, with egress fees up to ~$0.09/GB that discourage switching. Reserved instances/Savings Plans cut costs up to ~72% and portability via containers/infra-as-code mitigates lock-in, but high reliability requirements constrain bargaining leverage.
- Market share 2024: AWS 32%, Azure 23%, GCP 11%
- Egress fees can reach ~$0.09/GB
- Reserved/Savings Plan savings up to ~72%
- 99.99% uptime targets limit supplier pressure
Merchant platform integrations
Merchant platforms and POS providers control merchant access and placement; preferred partner programs and app-store rules (Shopify App Store ~8,000 apps in 2024) let platforms influence fees and visibility, increasing supplier leverage. Deep integrations create high switching costs, but building direct APIs and multi-platform plugins reduces dependency and churn.
- Platform control: placement/fees
- Shopify App Store ~8,000 apps (2024)
- Deep integrations = sticky
- APIs/plugins = reduced dependency
BNPL lenders face higher supplier power from funding, processors, cloud, and identity vendors
Zip faces moderate-to-high supplier power: funding and securitization repricing (Fed Funds ~5.3% in 2024) and processor concentration (Visa+Mastercard ~80% of volume 2023) raise costs; identity/data vendors ($26.6B market 2024) and hyperscalers (AWS 32%, Azure 23%, GCP 11% 2024) exert pricing and switching pressure; multi-vendor strategies and volume discounts (10–25%) plus reserved cloud savings (up to 72%) mitigate risk.
| Supplier | Key 2024 metric |
|---|---|
| Funding | Fed Funds 5.3% |
| Processors | Visa+MC ~80% (2023) |
| Cloud | AWS32%/AZ23%/GCP11%, egress ~$0.09/GB |
| Identity | $26.6B market |
What is included in the product
 Detailed Word Document
Comprehensive Porter's Five Forces analysis tailored for Zip, revealing competitive intensity, buyer/supplier power, entry barriers, substitute threats and disruptive risks, with strategic implications you can edit into reports.

 Customizable Excel Spreadsheet
A single-sheet Five Forces tool that quantifies competitive pressure, auto-updates spider charts for rapid strategy pivots, and slots seamlessly into decks or dashboards—no macros or finance expertise required.
Customers Bargaining Power

Consumers’ low switching costs
About 60% of BNPL users held multiple apps in 2024, enabling easy switching based on approval, limits, or fees and increasing buyer power. Fast, often frictionless onboarding and instant approvals raise propensity to shop around. Loyalty features, cashback and embedded placement in merchant checkout can temper churn. Credit limits and soft-pull policies are key decision factors for users.
Merchants’ negotiation leverage
Larger retailers benchmark take rates across BNPL providers (typically 1–6% in 2024) and demand marketing support, threatening to route volume to rivals or native installments (eg Apple/Google pay-later growth in 2024). Demonstrated conversion uplift of ~20–30% and AOV gains of ~20–40% help Zip defend pricing. Co-marketing and exclusivity deals can trade margin for share, often via 50–200 bps take-rate concessions.

Price and terms sensitivity
Consumers increasingly demand zero interest and transparent fees, and 2024 regulatory scrutiny (CFPB actions) has sharply reduced tolerance for opaque late fees; merchants therefore face tighter pushback. Merchants balance an average U.S. merchant discount rate near 2.3% in 2024 with chargeback risk and settlement timing. Even 10–30 basis-point pricing deltas can reallocate volumes in competitive categories. Clear disclosures and predictable costs lower consumer resistance.

Multihoming across providers
Merchants frequently present multiple BNPL options at checkout, expanding buyer choice and increasing customer bargaining power; Zip must therefore compete on approval rates, UX, and fraud/loss performance to win placement. Differentiated cohorts or vertical expertise can secure preferred placement by improving conversion and lowering merchant CAC.
- Multihoming raises buyer leverage
- Compete on approvals, UX, loss metrics
- Vertical expertise = preferred placement
Data and performance expectations
60% of BNPL users multihome in 2024; small MDR shifts (10–30bps) reshape merchant economics
About 60% of BNPL users multihome in 2024, raising buyer leverage; approval rates, UX and credit limits drive merchant choice. Merchants benchmark take rates at 1–6% and can reallocate volume despite Zip’s ~20–30% conversion uplift and 20–40% AOV lift. Benchmark KPIs: conversion ~2.5%, e‑commerce returns ~16%, U.S. MDR ~2.3%, making small price deltas (10–30bps) material.
| Metric | 2024 |
|---|---|
| Multihoming | 60% |
| Take rates | 1–6% |
| Conversion | ~2.5% |
| Returns | ~16% |
Preview the Actual Deliverable
Zip Porter's Five Forces Analysis
This preview shows the exact Zip Porter Five Forces analysis you'll receive upon purchase—no placeholders or mockups. The document is fully formatted, professionally written, and ready for immediate download and use the moment you buy. You're previewing the final deliverable; what you see is exactly what you'll get.

Don't Miss the Bigger Picture
Zip's Porter's Five Forces snapshot highlights competitive intensity, buyer and supplier dynamics, threat of substitutes, and barriers to entry in concise terms. This brief snapshot only scratches the surface. Unlock the full Porter's Five Forces Analysis to explore Zip’s competitive dynamics, market pressures, and strategic advantages in detail.
Suppliers Bargaining Power
Diverse funding sources
Zip relies on warehouse lines, securitizations and bank partnerships for lending capacity; funding providers can reprice or tighten terms in risk-off periods—Federal Funds averaged about 5.3% in 2024, keeping funding costly. Diversification across vehicles reduces single-supplier leverage, but refinancing risk persists when markets seize up. Strong portfolio performance and vintage-level loss metrics materially improve negotiation of spreads and covenant terms.
Payment networks and processors
Processors, gateways and card networks are critical for authorization and settlement, creating high switching costs from integrations, PCI certifications and uptime SLAs. Visa and Mastercard together handled roughly 80% of global card volume in 2023, so large processors wield moderate power via tiered pricing, holds and service tiers. Redundancy and multi-homing by merchants reduce single-supplier leverage.
Data, fraud, and identity vendors
KYC/AML, device intelligence and credit-data providers are essential for underwriting and compliance, with the global digital identity market reaching about $26.6 billion in 2024, underpinning transaction screening and fraud prevention. Proprietary signals and unique data models give vendors pricing power and switching costs. Multi-vendor stacks reduce single-vendor dependence but raise integration costs and operational complexity. Volume commitments commonly unlock 10–25% discounts and stronger SLAs.
Cloud and infrastructure providers
Hosting, analytics and CDNs enable real-time decisioning and uptime with platform availability targets commonly at 99.99%; they are core to Zip’s product SLAs. Hyperscalers hold market share (AWS ~32%, Azure ~23%, GCP ~11% in 2024) and exert pricing power, with egress fees up to ~$0.09/GB that discourage switching. Reserved instances/Savings Plans cut costs up to ~72% and portability via containers/infra-as-code mitigates lock-in, but high reliability requirements constrain bargaining leverage.
- Market share 2024: AWS 32%, Azure 23%, GCP 11%
- Egress fees can reach ~$0.09/GB
- Reserved/Savings Plan savings up to ~72%
- 99.99% uptime targets limit supplier pressure
Merchant platform integrations
Merchant platforms and POS providers control merchant access and placement; preferred partner programs and app-store rules (Shopify App Store ~8,000 apps in 2024) let platforms influence fees and visibility, increasing supplier leverage. Deep integrations create high switching costs, but building direct APIs and multi-platform plugins reduces dependency and churn.
- Platform control: placement/fees
- Shopify App Store ~8,000 apps (2024)
- Deep integrations = sticky
- APIs/plugins = reduced dependency
BNPL lenders face higher supplier power from funding, processors, cloud, and identity vendors
Zip faces moderate-to-high supplier power: funding and securitization repricing (Fed Funds ~5.3% in 2024) and processor concentration (Visa+Mastercard ~80% of volume 2023) raise costs; identity/data vendors ($26.6B market 2024) and hyperscalers (AWS 32%, Azure 23%, GCP 11% 2024) exert pricing and switching pressure; multi-vendor strategies and volume discounts (10–25%) plus reserved cloud savings (up to 72%) mitigate risk.
| Supplier | Key 2024 metric |
|---|---|
| Funding | Fed Funds 5.3% |
| Processors | Visa+MC ~80% (2023) |
| Cloud | AWS32%/AZ23%/GCP11%, egress ~$0.09/GB |
| Identity | $26.6B market |
What is included in the product
Detailed Word Document
Comprehensive Porter's Five Forces analysis tailored for Zip, revealing competitive intensity, buyer/supplier power, entry barriers, substitute threats and disruptive risks, with strategic implications you can edit into reports.
Customizable Excel Spreadsheet
A single-sheet Five Forces tool that quantifies competitive pressure, auto-updates spider charts for rapid strategy pivots, and slots seamlessly into decks or dashboards—no macros or finance expertise required.
Customers Bargaining Power
Consumers’ low switching costs
About 60% of BNPL users held multiple apps in 2024, enabling easy switching based on approval, limits, or fees and increasing buyer power. Fast, often frictionless onboarding and instant approvals raise propensity to shop around. Loyalty features, cashback and embedded placement in merchant checkout can temper churn. Credit limits and soft-pull policies are key decision factors for users.
Merchants’ negotiation leverage
Larger retailers benchmark take rates across BNPL providers (typically 1–6% in 2024) and demand marketing support, threatening to route volume to rivals or native installments (eg Apple/Google pay-later growth in 2024). Demonstrated conversion uplift of ~20–30% and AOV gains of ~20–40% help Zip defend pricing. Co-marketing and exclusivity deals can trade margin for share, often via 50–200 bps take-rate concessions.
Price and terms sensitivity
Consumers increasingly demand zero interest and transparent fees, and 2024 regulatory scrutiny (CFPB actions) has sharply reduced tolerance for opaque late fees; merchants therefore face tighter pushback. Merchants balance an average U.S. merchant discount rate near 2.3% in 2024 with chargeback risk and settlement timing. Even 10–30 basis-point pricing deltas can reallocate volumes in competitive categories. Clear disclosures and predictable costs lower consumer resistance.
Multihoming across providers
Merchants frequently present multiple BNPL options at checkout, expanding buyer choice and increasing customer bargaining power; Zip must therefore compete on approval rates, UX, and fraud/loss performance to win placement. Differentiated cohorts or vertical expertise can secure preferred placement by improving conversion and lowering merchant CAC.
- Multihoming raises buyer leverage
- Compete on approvals, UX, loss metrics
- Vertical expertise = preferred placement
Data and performance expectations
60% of BNPL users multihome in 2024; small MDR shifts (10–30bps) reshape merchant economics
About 60% of BNPL users multihome in 2024, raising buyer leverage; approval rates, UX and credit limits drive merchant choice. Merchants benchmark take rates at 1–6% and can reallocate volume despite Zip’s ~20–30% conversion uplift and 20–40% AOV lift. Benchmark KPIs: conversion ~2.5%, e‑commerce returns ~16%, U.S. MDR ~2.3%, making small price deltas (10–30bps) material.
| Metric | 2024 |
|---|---|
| Multihoming | 60% |
| Take rates | 1–6% |
| Conversion | ~2.5% |
| Returns | ~16% |
Preview the Actual Deliverable
Zip Porter's Five Forces Analysis
This preview shows the exact Zip Porter Five Forces analysis you'll receive upon purchase—no placeholders or mockups. The document is fully formatted, professionally written, and ready for immediate download and use the moment you buy. You're previewing the final deliverable; what you see is exactly what you'll get.
Description
Don't Miss the Bigger Picture
Zip's Porter's Five Forces snapshot highlights competitive intensity, buyer and supplier dynamics, threat of substitutes, and barriers to entry in concise terms. This brief snapshot only scratches the surface. Unlock the full Porter's Five Forces Analysis to explore Zip’s competitive dynamics, market pressures, and strategic advantages in detail.
Suppliers Bargaining Power
Diverse funding sources
Zip relies on warehouse lines, securitizations and bank partnerships for lending capacity; funding providers can reprice or tighten terms in risk-off periods—Federal Funds averaged about 5.3% in 2024, keeping funding costly. Diversification across vehicles reduces single-supplier leverage, but refinancing risk persists when markets seize up. Strong portfolio performance and vintage-level loss metrics materially improve negotiation of spreads and covenant terms.
Payment networks and processors
Processors, gateways and card networks are critical for authorization and settlement, creating high switching costs from integrations, PCI certifications and uptime SLAs. Visa and Mastercard together handled roughly 80% of global card volume in 2023, so large processors wield moderate power via tiered pricing, holds and service tiers. Redundancy and multi-homing by merchants reduce single-supplier leverage.
Data, fraud, and identity vendors
KYC/AML, device intelligence and credit-data providers are essential for underwriting and compliance, with the global digital identity market reaching about $26.6 billion in 2024, underpinning transaction screening and fraud prevention. Proprietary signals and unique data models give vendors pricing power and switching costs. Multi-vendor stacks reduce single-vendor dependence but raise integration costs and operational complexity. Volume commitments commonly unlock 10–25% discounts and stronger SLAs.
Cloud and infrastructure providers
Hosting, analytics and CDNs enable real-time decisioning and uptime with platform availability targets commonly at 99.99%; they are core to Zip’s product SLAs. Hyperscalers hold market share (AWS ~32%, Azure ~23%, GCP ~11% in 2024) and exert pricing power, with egress fees up to ~$0.09/GB that discourage switching. Reserved instances/Savings Plans cut costs up to ~72% and portability via containers/infra-as-code mitigates lock-in, but high reliability requirements constrain bargaining leverage.
- Market share 2024: AWS 32%, Azure 23%, GCP 11%
- Egress fees can reach ~$0.09/GB
- Reserved/Savings Plan savings up to ~72%
- 99.99% uptime targets limit supplier pressure
Merchant platform integrations
Merchant platforms and POS providers control merchant access and placement; preferred partner programs and app-store rules (Shopify App Store ~8,000 apps in 2024) let platforms influence fees and visibility, increasing supplier leverage. Deep integrations create high switching costs, but building direct APIs and multi-platform plugins reduces dependency and churn.
- Platform control: placement/fees
- Shopify App Store ~8,000 apps (2024)
- Deep integrations = sticky
- APIs/plugins = reduced dependency
BNPL lenders face higher supplier power from funding, processors, cloud, and identity vendors
Zip faces moderate-to-high supplier power: funding and securitization repricing (Fed Funds ~5.3% in 2024) and processor concentration (Visa+Mastercard ~80% of volume 2023) raise costs; identity/data vendors ($26.6B market 2024) and hyperscalers (AWS 32%, Azure 23%, GCP 11% 2024) exert pricing and switching pressure; multi-vendor strategies and volume discounts (10–25%) plus reserved cloud savings (up to 72%) mitigate risk.
| Supplier | Key 2024 metric |
|---|---|
| Funding | Fed Funds 5.3% |
| Processors | Visa+MC ~80% (2023) |
| Cloud | AWS32%/AZ23%/GCP11%, egress ~$0.09/GB |
| Identity | $26.6B market |
What is included in the product
Detailed Word Document
Comprehensive Porter's Five Forces analysis tailored for Zip, revealing competitive intensity, buyer/supplier power, entry barriers, substitute threats and disruptive risks, with strategic implications you can edit into reports.
Customizable Excel Spreadsheet
A single-sheet Five Forces tool that quantifies competitive pressure, auto-updates spider charts for rapid strategy pivots, and slots seamlessly into decks or dashboards—no macros or finance expertise required.
Customers Bargaining Power
Consumers’ low switching costs
About 60% of BNPL users held multiple apps in 2024, enabling easy switching based on approval, limits, or fees and increasing buyer power. Fast, often frictionless onboarding and instant approvals raise propensity to shop around. Loyalty features, cashback and embedded placement in merchant checkout can temper churn. Credit limits and soft-pull policies are key decision factors for users.
Merchants’ negotiation leverage
Larger retailers benchmark take rates across BNPL providers (typically 1–6% in 2024) and demand marketing support, threatening to route volume to rivals or native installments (eg Apple/Google pay-later growth in 2024). Demonstrated conversion uplift of ~20–30% and AOV gains of ~20–40% help Zip defend pricing. Co-marketing and exclusivity deals can trade margin for share, often via 50–200 bps take-rate concessions.
Price and terms sensitivity
Consumers increasingly demand zero interest and transparent fees, and 2024 regulatory scrutiny (CFPB actions) has sharply reduced tolerance for opaque late fees; merchants therefore face tighter pushback. Merchants balance an average U.S. merchant discount rate near 2.3% in 2024 with chargeback risk and settlement timing. Even 10–30 basis-point pricing deltas can reallocate volumes in competitive categories. Clear disclosures and predictable costs lower consumer resistance.
Multihoming across providers
Merchants frequently present multiple BNPL options at checkout, expanding buyer choice and increasing customer bargaining power; Zip must therefore compete on approval rates, UX, and fraud/loss performance to win placement. Differentiated cohorts or vertical expertise can secure preferred placement by improving conversion and lowering merchant CAC.
- Multihoming raises buyer leverage
- Compete on approvals, UX, loss metrics
- Vertical expertise = preferred placement
Data and performance expectations
60% of BNPL users multihome in 2024; small MDR shifts (10–30bps) reshape merchant economics
About 60% of BNPL users multihome in 2024, raising buyer leverage; approval rates, UX and credit limits drive merchant choice. Merchants benchmark take rates at 1–6% and can reallocate volume despite Zip’s ~20–30% conversion uplift and 20–40% AOV lift. Benchmark KPIs: conversion ~2.5%, e‑commerce returns ~16%, U.S. MDR ~2.3%, making small price deltas (10–30bps) material.
| Metric | 2024 |
|---|---|
| Multihoming | 60% |
| Take rates | 1–6% |
| Conversion | ~2.5% |
| Returns | ~16% |
Preview the Actual Deliverable
Zip Porter's Five Forces Analysis
This preview shows the exact Zip Porter Five Forces analysis you'll receive upon purchase—no placeholders or mockups. The document is fully formatted, professionally written, and ready for immediate download and use the moment you buy. You're previewing the final deliverable; what you see is exactly what you'll get.











