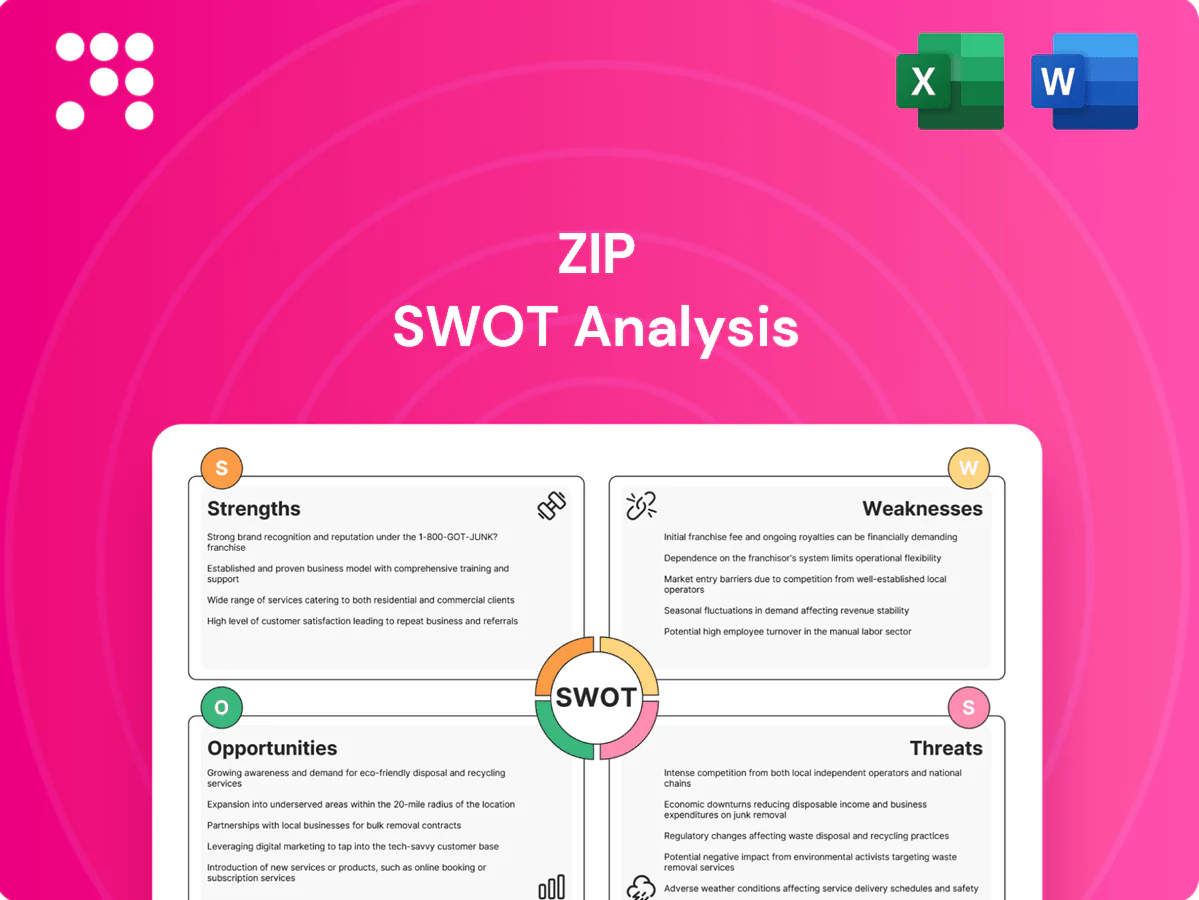
Zip SWOT Analysis

Dive Deeper Into the Company’s Strategic Blueprint
Zip's SWOT analysis highlights its strong BNPL brand, rapid user growth, and partnerships, while candidly addressing regulatory pressures and margin risks; the preview outlines key implications for investors and strategists. Purchase the full SWOT for a research-backed, editable report and Excel tools to plan, pitch, or invest with confidence.
Strengths

Recognized BNPL brand
Recognized BNPL brand Zip (serving over 7.5 million customers and 30,000 merchant partners) lowers customer acquisition costs and builds checkout trust, helping win merchant integrations and co-marketing slots; industry data shows BNPL can boost average order value by ~25% and conversion rates materially, providing Zip a defensible wedge versus newer entrants.
Large merchant network
Zip’s integrated online and in-store rails deliver ubiquitous acceptance across an expanding merchant base of over 70,000 locations, driving recurring merchant fees that boost revenue while improving conversion and AOV; scale provides negotiating leverage on interchange and processing costs, and its omnichannel footprint strengthens data feedback loops for personalization and fraud reduction.

Smooth user experience
Fast approvals and transparent installment options reduce checkout friction and lower abandonment rates, while clear repayment schedules support repeat usage and fewer service queries. Mobile-first flows align with consumer behavior—mobile commerce accounted for 72.9% of global e-commerce sales in 2024 (Statista). This UX strength drives higher activation and retention, improving lifetime value metrics and customer loyalty.

Data-driven underwriting
Data-driven underwriting leverages proprietary risk models built on behavioral and transaction data to sharpen loss forecasting and approval precision. Real-time decisioning balances approval rates with loss control while iterative model tuning improves unit economics and lifetime value. Enhanced segmentation enables targeted limits and personalized offers, increasing conversion and reducing credit losses.
- Proprietary models
- Real-time decisioning
- Iterative tuning
- Targeted segmentation
Flexible product suite
Zip’s flexible product suite—offering pay-in-4 alongside longer-term plans—broadens addressable spend into both low- and higher-ticket categories and adapts to merchant and ticket-size needs. Multiple repayment options increase frequency of use and deepen engagement, supporting higher lifetime value per user. Zip’s FY2024 go-to-market emphasis on plan variety reinforced cross-category acceptance and merchant partnerships.
- pay-in-4 + longer plans: expands addressable spend
- adaptive sizing: fits low and high ticket purchases
- multiple repayment paths: boosts engagement
- supports higher LTV per user: improves monetization
BNPL leader: 7.5M customers, 30K merchants, AOV +25%
Recognized BNPL brand Zip (7.5M customers, 30,000 merchant partners) boosts AOV ~25% and conversion, strengthening merchant integrations and co-marketing. Omnichannel acceptance across 70,000 locations plus mobile-first flows (mobile commerce 72.9% of e‑commerce in 2024) drives activation, retention and negotiating leverage. Proprietary, real-time underwriting improves approval precision, loss control and LTV.
| Metric | Value |
|---|---|
| Customers | 7.5M |
| Merchant partners | 30,000 |
| Locations | 70,000 |
| Mobile e‑commerce share (2024) | 72.9% |
| AOV lift (BNPL) | ~25% |
What is included in the product
 Detailed Word Document
Provides a concise SWOT analysis of Zip, detailing its internal strengths and weaknesses alongside external opportunities and threats to assess the company’s strategic position and growth prospects.

 Customizable Excel Spreadsheet
Provides a concise, Zip-focused SWOT matrix that highlights key pain points and actionable opportunities for rapid mitigation and clear executive decision-making.
Weaknesses

Credit loss exposure
Zip (ASX: Z1P) faces material credit loss exposure as BNPL bears repayment risk despite its interest-free positioning; Zip reported worsening impairment and provisioning trends in 2024, contributing to a materially higher loss profile. Rising delinquencies can rapidly erode contribution margins—industry charge-off rates climbed in 2023–24, pressuring unit economics. Loss variability complicates forecasting and capital planning, while increased collections and charge-offs add operational costs and reduce ROE.
Thin margins, funding needs
Zip’s unit economics hinge on merchant fees and low funding costs, but with benchmark policy rates around 5.25–5.50% in 2024–25 higher warehouse/securitization funding costs increase funding risk; competitive promotional pricing can compress thin margins, and scale gains are often offset by rising credit losses and servicing expenses.

Regulatory sensitivity
Rules such as the 2024 Australian Treasury consultation on BNPL affordability checks and enhanced disclosures can raise Zip’s compliance costs and operational overhead. Reclassification toward credit-like oversight would force changes to underwriting, funding and capital models. Regulators intensified scrutiny in 2024 on “interest-free” marketing language. Differing rules across Australia, UK and US drive legal and implementation complexity.

Merchant dependence
Concentration in a small set of retail partners heightens churn risk, as losing a major merchant can materially reduce transaction volume and revenue.
Merchants can switch or add rival BNPL providers at checkout, eroding Zip’s merchant exclusivity and bargaining power.
Rising merchant fee pressure and demands for demonstrable ROI threaten margins, while heavy seasonal retail exposure (holiday peaks) increases cash flow and revenue volatility.
- merchant-churn
- checkout-competition
- fee-pressure
- seasonal-volatility
Low switching costs for users
Low switching costs let consumers move to alternatives easily: global BNPL adoption exceeded 300 million users by 2024, and major players like Klarna reported over 150 million users in 2023, making checkout real estate fiercely competitive and algorithm-driven. Incentives and promos drive fickle loyalty, elevating ongoing acquisition and retention spend and pressuring Zip’s margins.
- High churn risk
- Promos inflate CAC
- Checkout algorithms favor incumbents
Impair 5.8% & funding 4.8% pressure ROE
Zip’s credit losses and rising impairments (impairment ratio 2024: 5.8%) materially weaken unit economics and ROE; charge-off volatility (2024 charge-off rate ~4.2%) complicates forecasting and capital planning. Higher funding costs (avg warehouse/securitization ~4.8% in 2024–25) and merchant fee pressure compress margins. Regulatory shifts in 2024 raise compliance costs and operational complexity.
| Metric | 2024 |
|---|---|
| Impairment ratio | 5.8% |
| Charge-off rate | 4.2% |
| Funding cost (avg) | 4.8% |
| Monthly active users | 6.5m |
Preview Before You Purchase
Zip SWOT Analysis
This is the actual Zip SWOT Analysis document you’ll receive upon purchase—no surprises, just professional quality. The preview below is taken directly from the full report; purchase unlocks the editable, complete version. Ready to download immediately after checkout.

Dive Deeper Into the Company’s Strategic Blueprint
Zip's SWOT analysis highlights its strong BNPL brand, rapid user growth, and partnerships, while candidly addressing regulatory pressures and margin risks; the preview outlines key implications for investors and strategists. Purchase the full SWOT for a research-backed, editable report and Excel tools to plan, pitch, or invest with confidence.
Strengths
Recognized BNPL brand
Recognized BNPL brand Zip (serving over 7.5 million customers and 30,000 merchant partners) lowers customer acquisition costs and builds checkout trust, helping win merchant integrations and co-marketing slots; industry data shows BNPL can boost average order value by ~25% and conversion rates materially, providing Zip a defensible wedge versus newer entrants.
Large merchant network
Zip’s integrated online and in-store rails deliver ubiquitous acceptance across an expanding merchant base of over 70,000 locations, driving recurring merchant fees that boost revenue while improving conversion and AOV; scale provides negotiating leverage on interchange and processing costs, and its omnichannel footprint strengthens data feedback loops for personalization and fraud reduction.
Smooth user experience
Fast approvals and transparent installment options reduce checkout friction and lower abandonment rates, while clear repayment schedules support repeat usage and fewer service queries. Mobile-first flows align with consumer behavior—mobile commerce accounted for 72.9% of global e-commerce sales in 2024 (Statista). This UX strength drives higher activation and retention, improving lifetime value metrics and customer loyalty.
Data-driven underwriting
Data-driven underwriting leverages proprietary risk models built on behavioral and transaction data to sharpen loss forecasting and approval precision. Real-time decisioning balances approval rates with loss control while iterative model tuning improves unit economics and lifetime value. Enhanced segmentation enables targeted limits and personalized offers, increasing conversion and reducing credit losses.
- Proprietary models
- Real-time decisioning
- Iterative tuning
- Targeted segmentation
Flexible product suite
Zip’s flexible product suite—offering pay-in-4 alongside longer-term plans—broadens addressable spend into both low- and higher-ticket categories and adapts to merchant and ticket-size needs. Multiple repayment options increase frequency of use and deepen engagement, supporting higher lifetime value per user. Zip’s FY2024 go-to-market emphasis on plan variety reinforced cross-category acceptance and merchant partnerships.
- pay-in-4 + longer plans: expands addressable spend
- adaptive sizing: fits low and high ticket purchases
- multiple repayment paths: boosts engagement
- supports higher LTV per user: improves monetization
BNPL leader: 7.5M customers, 30K merchants, AOV +25%
Recognized BNPL brand Zip (7.5M customers, 30,000 merchant partners) boosts AOV ~25% and conversion, strengthening merchant integrations and co-marketing. Omnichannel acceptance across 70,000 locations plus mobile-first flows (mobile commerce 72.9% of e‑commerce in 2024) drives activation, retention and negotiating leverage. Proprietary, real-time underwriting improves approval precision, loss control and LTV.
| Metric | Value |
|---|---|
| Customers | 7.5M |
| Merchant partners | 30,000 |
| Locations | 70,000 |
| Mobile e‑commerce share (2024) | 72.9% |
| AOV lift (BNPL) | ~25% |
What is included in the product
Detailed Word Document
Provides a concise SWOT analysis of Zip, detailing its internal strengths and weaknesses alongside external opportunities and threats to assess the company’s strategic position and growth prospects.
Customizable Excel Spreadsheet
Provides a concise, Zip-focused SWOT matrix that highlights key pain points and actionable opportunities for rapid mitigation and clear executive decision-making.
Weaknesses
Credit loss exposure
Zip (ASX: Z1P) faces material credit loss exposure as BNPL bears repayment risk despite its interest-free positioning; Zip reported worsening impairment and provisioning trends in 2024, contributing to a materially higher loss profile. Rising delinquencies can rapidly erode contribution margins—industry charge-off rates climbed in 2023–24, pressuring unit economics. Loss variability complicates forecasting and capital planning, while increased collections and charge-offs add operational costs and reduce ROE.
Thin margins, funding needs
Zip’s unit economics hinge on merchant fees and low funding costs, but with benchmark policy rates around 5.25–5.50% in 2024–25 higher warehouse/securitization funding costs increase funding risk; competitive promotional pricing can compress thin margins, and scale gains are often offset by rising credit losses and servicing expenses.
Regulatory sensitivity
Rules such as the 2024 Australian Treasury consultation on BNPL affordability checks and enhanced disclosures can raise Zip’s compliance costs and operational overhead. Reclassification toward credit-like oversight would force changes to underwriting, funding and capital models. Regulators intensified scrutiny in 2024 on “interest-free” marketing language. Differing rules across Australia, UK and US drive legal and implementation complexity.
Merchant dependence
Concentration in a small set of retail partners heightens churn risk, as losing a major merchant can materially reduce transaction volume and revenue.
Merchants can switch or add rival BNPL providers at checkout, eroding Zip’s merchant exclusivity and bargaining power.
Rising merchant fee pressure and demands for demonstrable ROI threaten margins, while heavy seasonal retail exposure (holiday peaks) increases cash flow and revenue volatility.
- merchant-churn
- checkout-competition
- fee-pressure
- seasonal-volatility
Low switching costs for users
Low switching costs let consumers move to alternatives easily: global BNPL adoption exceeded 300 million users by 2024, and major players like Klarna reported over 150 million users in 2023, making checkout real estate fiercely competitive and algorithm-driven. Incentives and promos drive fickle loyalty, elevating ongoing acquisition and retention spend and pressuring Zip’s margins.
- High churn risk
- Promos inflate CAC
- Checkout algorithms favor incumbents
Impair 5.8% & funding 4.8% pressure ROE
Zip’s credit losses and rising impairments (impairment ratio 2024: 5.8%) materially weaken unit economics and ROE; charge-off volatility (2024 charge-off rate ~4.2%) complicates forecasting and capital planning. Higher funding costs (avg warehouse/securitization ~4.8% in 2024–25) and merchant fee pressure compress margins. Regulatory shifts in 2024 raise compliance costs and operational complexity.
| Metric | 2024 |
|---|---|
| Impairment ratio | 5.8% |
| Charge-off rate | 4.2% |
| Funding cost (avg) | 4.8% |
| Monthly active users | 6.5m |
Preview Before You Purchase
Zip SWOT Analysis
This is the actual Zip SWOT Analysis document you’ll receive upon purchase—no surprises, just professional quality. The preview below is taken directly from the full report; purchase unlocks the editable, complete version. Ready to download immediately after checkout.
Description
Dive Deeper Into the Company’s Strategic Blueprint
Zip's SWOT analysis highlights its strong BNPL brand, rapid user growth, and partnerships, while candidly addressing regulatory pressures and margin risks; the preview outlines key implications for investors and strategists. Purchase the full SWOT for a research-backed, editable report and Excel tools to plan, pitch, or invest with confidence.
Strengths
Recognized BNPL brand
Recognized BNPL brand Zip (serving over 7.5 million customers and 30,000 merchant partners) lowers customer acquisition costs and builds checkout trust, helping win merchant integrations and co-marketing slots; industry data shows BNPL can boost average order value by ~25% and conversion rates materially, providing Zip a defensible wedge versus newer entrants.
Large merchant network
Zip’s integrated online and in-store rails deliver ubiquitous acceptance across an expanding merchant base of over 70,000 locations, driving recurring merchant fees that boost revenue while improving conversion and AOV; scale provides negotiating leverage on interchange and processing costs, and its omnichannel footprint strengthens data feedback loops for personalization and fraud reduction.
Smooth user experience
Fast approvals and transparent installment options reduce checkout friction and lower abandonment rates, while clear repayment schedules support repeat usage and fewer service queries. Mobile-first flows align with consumer behavior—mobile commerce accounted for 72.9% of global e-commerce sales in 2024 (Statista). This UX strength drives higher activation and retention, improving lifetime value metrics and customer loyalty.
Data-driven underwriting
Data-driven underwriting leverages proprietary risk models built on behavioral and transaction data to sharpen loss forecasting and approval precision. Real-time decisioning balances approval rates with loss control while iterative model tuning improves unit economics and lifetime value. Enhanced segmentation enables targeted limits and personalized offers, increasing conversion and reducing credit losses.
- Proprietary models
- Real-time decisioning
- Iterative tuning
- Targeted segmentation
Flexible product suite
Zip’s flexible product suite—offering pay-in-4 alongside longer-term plans—broadens addressable spend into both low- and higher-ticket categories and adapts to merchant and ticket-size needs. Multiple repayment options increase frequency of use and deepen engagement, supporting higher lifetime value per user. Zip’s FY2024 go-to-market emphasis on plan variety reinforced cross-category acceptance and merchant partnerships.
- pay-in-4 + longer plans: expands addressable spend
- adaptive sizing: fits low and high ticket purchases
- multiple repayment paths: boosts engagement
- supports higher LTV per user: improves monetization
BNPL leader: 7.5M customers, 30K merchants, AOV +25%
Recognized BNPL brand Zip (7.5M customers, 30,000 merchant partners) boosts AOV ~25% and conversion, strengthening merchant integrations and co-marketing. Omnichannel acceptance across 70,000 locations plus mobile-first flows (mobile commerce 72.9% of e‑commerce in 2024) drives activation, retention and negotiating leverage. Proprietary, real-time underwriting improves approval precision, loss control and LTV.
| Metric | Value |
|---|---|
| Customers | 7.5M |
| Merchant partners | 30,000 |
| Locations | 70,000 |
| Mobile e‑commerce share (2024) | 72.9% |
| AOV lift (BNPL) | ~25% |
What is included in the product
Detailed Word Document
Provides a concise SWOT analysis of Zip, detailing its internal strengths and weaknesses alongside external opportunities and threats to assess the company’s strategic position and growth prospects.
Customizable Excel Spreadsheet
Provides a concise, Zip-focused SWOT matrix that highlights key pain points and actionable opportunities for rapid mitigation and clear executive decision-making.
Weaknesses
Credit loss exposure
Zip (ASX: Z1P) faces material credit loss exposure as BNPL bears repayment risk despite its interest-free positioning; Zip reported worsening impairment and provisioning trends in 2024, contributing to a materially higher loss profile. Rising delinquencies can rapidly erode contribution margins—industry charge-off rates climbed in 2023–24, pressuring unit economics. Loss variability complicates forecasting and capital planning, while increased collections and charge-offs add operational costs and reduce ROE.
Thin margins, funding needs
Zip’s unit economics hinge on merchant fees and low funding costs, but with benchmark policy rates around 5.25–5.50% in 2024–25 higher warehouse/securitization funding costs increase funding risk; competitive promotional pricing can compress thin margins, and scale gains are often offset by rising credit losses and servicing expenses.
Regulatory sensitivity
Rules such as the 2024 Australian Treasury consultation on BNPL affordability checks and enhanced disclosures can raise Zip’s compliance costs and operational overhead. Reclassification toward credit-like oversight would force changes to underwriting, funding and capital models. Regulators intensified scrutiny in 2024 on “interest-free” marketing language. Differing rules across Australia, UK and US drive legal and implementation complexity.
Merchant dependence
Concentration in a small set of retail partners heightens churn risk, as losing a major merchant can materially reduce transaction volume and revenue.
Merchants can switch or add rival BNPL providers at checkout, eroding Zip’s merchant exclusivity and bargaining power.
Rising merchant fee pressure and demands for demonstrable ROI threaten margins, while heavy seasonal retail exposure (holiday peaks) increases cash flow and revenue volatility.
- merchant-churn
- checkout-competition
- fee-pressure
- seasonal-volatility
Low switching costs for users
Low switching costs let consumers move to alternatives easily: global BNPL adoption exceeded 300 million users by 2024, and major players like Klarna reported over 150 million users in 2023, making checkout real estate fiercely competitive and algorithm-driven. Incentives and promos drive fickle loyalty, elevating ongoing acquisition and retention spend and pressuring Zip’s margins.
- High churn risk
- Promos inflate CAC
- Checkout algorithms favor incumbents
Impair 5.8% & funding 4.8% pressure ROE
Zip’s credit losses and rising impairments (impairment ratio 2024: 5.8%) materially weaken unit economics and ROE; charge-off volatility (2024 charge-off rate ~4.2%) complicates forecasting and capital planning. Higher funding costs (avg warehouse/securitization ~4.8% in 2024–25) and merchant fee pressure compress margins. Regulatory shifts in 2024 raise compliance costs and operational complexity.
| Metric | 2024 |
|---|---|
| Impairment ratio | 5.8% |
| Charge-off rate | 4.2% |
| Funding cost (avg) | 4.8% |
| Monthly active users | 6.5m |
Preview Before You Purchase
Zip SWOT Analysis
This is the actual Zip SWOT Analysis document you’ll receive upon purchase—no surprises, just professional quality. The preview below is taken directly from the full report; purchase unlocks the editable, complete version. Ready to download immediately after checkout.











