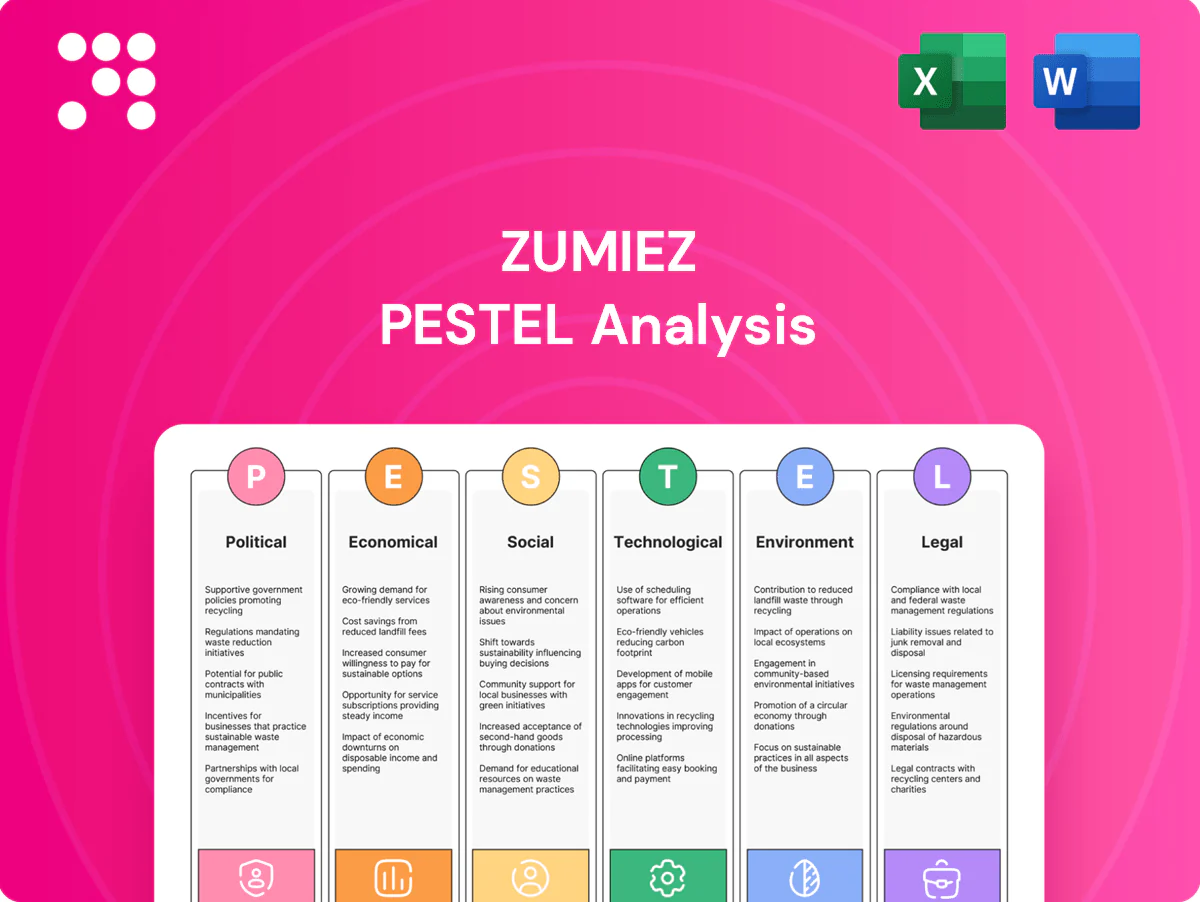
Zumiez PESTLE Analysis

Plan Smarter. Present Sharper. Compete Stronger.
Discover how political, economic, social, technological, legal and environmental forces are reshaping Zumiez’s competitive landscape in our concise PESTLE overview. Use these actionable insights to anticipate risks, pinpoint growth opportunities, and refine strategy. Purchase the full PESTLE report for the complete, downloadable analysis and ready-to-use recommendations.
Political factors

Trade policy and tariffs
Zumiez sources apparel and hardgoods globally, so import tariffs and quotas — notably U.S. Section 301 measures that impose duties up to 25% on affected Chinese goods — can materially raise landed costs and consumer prices.
EU customs tariff adjustments and Australia’s generally low MFN tariffs (often 0–5% on textiles) can shift relative landed cost advantages and sourcing timelines.
Preferential trade agreements or sanctions can reroute supply chains; management should hedge exposure via supplier diversification and flexible vendor contracts to limit tariff-driven margin volatility.
Labor and wage regulations
Minimum wage hikes and collective bargaining across Zumiez markets raise store payroll and distribution costs—US federal minimum remains $7.25/hr while state levels reach $15–$16 (New York, California), and Australia’s national minimum was set at AUD 23.23/hr by the Fair Work Commission; EU member minima vary widely. New scheduling laws and benefits mandates increase fixed staffing overhead and payroll volatility; political momentum toward living wages can compress margins unless offset by productivity. Store-level labor optimization, tighter scheduling, and tech (POS analytics, labor management systems) can mitigate cost pressure.

Geopolitical stability and supply chain
Ports disruptions, regional conflicts, and political protests can delay shipments and drove freight costs up as much as 20% during 2023‑24, squeezing margins for retailers like Zumiez that source heavily from Asia. Sanctions and export controls since 2022 have restricted access to some inputs and markets, forcing route and vendor changes. Political stability in sourcing hubs such as Southeast Asia and Eastern Europe underpins delivery reliability; dual‑source strategies and targeted safety stock (3–6 weeks) reduce disruption risk.

Local incentives and zoning
Local store openings for Zumiez (ticker ZUMZ) hinge on municipal permitting, zoning rules and retail revitalization incentives; political priorities and council support can speed mall redevelopments or block suburban projects, shifting foot traffic between downtowns and malls.
- Permitting: engage early with city planning
- Zoning: align format to local land-use plans
- Incentives: pursue retail revitalization grants
Tax policy and cross-border rules
Corporate tax shifts—US federal rate 21% and the OECD Pillar Two 15% minimum (implemented 2023)—along with EU standard VAT ~20–25% (avg ~21%) and Australia GST 10% directly pressure Zumiez net margins across regions; digital services taxes and evolving online marketplace levies raise e-commerce operating costs.
- Corporate tax: US 21%, Pillar Two 15%
- VAT/GST: EU ~20–25% (avg 21%), Australia 10%
- Digital/marketplace taxes increase platform fees
- Customs valuation scrutiny heightens transfer pricing compliance
- Need: proactive tax planning and robust documentation
Margins squeezed by tariffs 25% and freight +20%
Zumiez faces tariff risk (US Section 301 duties up to 25%) and regionally divergent VAT/GST that raise landed costs and prices. Labor cost inflation and minimums (US federal 7.25/hr; state highs ~15–16/hr; Australia AUD 23.23/hr) compress store margins. Supply‑chain disruption raised freight ~20% in 2023–24, prompting dual sourcing and 3–6 week safety stock. Corporate tax pressures: US 21% and Pillar Two 15%.
| Factor | Key metric |
|---|---|
| Tariffs | Section 301 up to 25% |
| Labor | US avg state top 15–16/hr; AUS AUD 23.23 |
| Freight | +20% (2023–24) |
| Tax | US 21%; Pillar Two 15% |
What is included in the product
 Detailed Word Document
Explores how Political, Economic, Social, Technological, Environmental and Legal forces uniquely impact Zumiez, with data-driven trends and industry-specific examples; designed to help executives, consultants and investors identify risks, opportunities and actionable strategies for retail growth and resilience.

 Customizable Excel Spreadsheet
Zumiez PESTLE Analysis delivers a clean, visually segmented summary that speeds stakeholder alignment and supports quick decision-making, while allowing easy edits and notes for local context or specific business lines.
Economic factors

Consumer discretionary spending
Zumiez’s youth-focused categories are highly cyclical and sensitive to youth unemployment and real wages; U.S. youth unemployment remained elevated through 2024–25 relative to adults, pressuring discretionary spend. Inflation (U.S. CPI ~3.4% in 2024) and a federal funds rate near 5.25–5.50% in mid‑2025 reduce disposable income and drive apparel trade‑down. Recessionary phases force tighter inventories and steeper promotions, while economic upswings support full‑price sell‑through and category expansion.
FX volatility (USD, EUR, AUD)
Zumiez faces FX volatility as revenue and costs in EUR and AUD expose margins to exchange-rate swings; the US dollar trade-weighted index hovered near 105 in mid-2025, pressuring translated earnings from European Blue Tomato and Fast Times while lowering USD-denominated COGS. Hedging programs and increased local sourcing in Europe and Australia can damp volatility. Clear FX disclosure in filings helps align investor expectations.

Freight, logistics, and input costs
Container spot rates slid from 2021 peaks above 10,000 USD per FEU to roughly 2,000–3,000 USD per FEU in 2024, while U.S. diesel averaged about 3–4 USD/gal in 2024, so container, fuel and last‑mile (≈40% of delivery cost) pressures materially compress Zumiez gross margins. Seasonal supply‑demand imbalances spike costs and squeeze margins during peaks. Vendor negotiations and routing optimization are primary levers to protect margin. Nearshoring and port diversification—U.S. imports from Mexico rose about 20% 2019–2023—add resilience.

Seasonality and demand cadence
Competitive intensity and pricing power
Specialty retailers like Zumiez compete with DTC brands, mass retailers and marketplaces, and fiscal 2023 net sales of about $1.02B highlight scale but not immunity; weak differentiation invites promotional pressure that erodes margins. Exclusive collaborations and community-driven assortments preserve pricing power, while data-led pricing and localized assortments sharpen competitiveness and reduce markdown risk.
- Competition: DTC, mass, marketplaces
- Risk: promo pressure → margin erosion
- Defensive: exclusive collabs, community assortments
- Levers: data pricing, localized assortments
Margins squeezed by tariffs 25% and freight +20%
Zumiez faces cyclical youth demand, with FY2024 net sales ~$1.46B; US youth unemployment stayed above adult rates in 2024–25, pressuring discretionary spend. Inflation (~3.4% CPI in 2024) and a federal funds rate ~5.25–5.50% mid‑2025 reduce real incomes, driving trade‑down. FX (USD TWI ~105 mid‑2025), container rates ~$2–3k/FEU in 2024 and diesel $3–4/gal compress margins; hedging and local sourcing mitigate.
| Metric | Value |
|---|---|
| FY2024 sales | $1.46B |
| US CPI 2024 | ~3.4% |
| Fed funds mid‑2025 | 5.25–5.50% |
| USD TWI mid‑2025 | ~105 |
| Container rate 2024 | $2–3k/FEU |
Full Version Awaits
Zumiez PESTLE Analysis
This Zumiez PESTLE Analysis preview is the exact document you’ll receive after purchase—fully formatted and ready to use. The layout, content, and structure shown here are identical to the downloadable file. No placeholders or teasers—this is the real, finished file you’ll own after checkout.

Plan Smarter. Present Sharper. Compete Stronger.
Discover how political, economic, social, technological, legal and environmental forces are reshaping Zumiez’s competitive landscape in our concise PESTLE overview. Use these actionable insights to anticipate risks, pinpoint growth opportunities, and refine strategy. Purchase the full PESTLE report for the complete, downloadable analysis and ready-to-use recommendations.
Political factors
Trade policy and tariffs
Zumiez sources apparel and hardgoods globally, so import tariffs and quotas — notably U.S. Section 301 measures that impose duties up to 25% on affected Chinese goods — can materially raise landed costs and consumer prices.
EU customs tariff adjustments and Australia’s generally low MFN tariffs (often 0–5% on textiles) can shift relative landed cost advantages and sourcing timelines.
Preferential trade agreements or sanctions can reroute supply chains; management should hedge exposure via supplier diversification and flexible vendor contracts to limit tariff-driven margin volatility.
Labor and wage regulations
Minimum wage hikes and collective bargaining across Zumiez markets raise store payroll and distribution costs—US federal minimum remains $7.25/hr while state levels reach $15–$16 (New York, California), and Australia’s national minimum was set at AUD 23.23/hr by the Fair Work Commission; EU member minima vary widely. New scheduling laws and benefits mandates increase fixed staffing overhead and payroll volatility; political momentum toward living wages can compress margins unless offset by productivity. Store-level labor optimization, tighter scheduling, and tech (POS analytics, labor management systems) can mitigate cost pressure.
Geopolitical stability and supply chain
Ports disruptions, regional conflicts, and political protests can delay shipments and drove freight costs up as much as 20% during 2023‑24, squeezing margins for retailers like Zumiez that source heavily from Asia. Sanctions and export controls since 2022 have restricted access to some inputs and markets, forcing route and vendor changes. Political stability in sourcing hubs such as Southeast Asia and Eastern Europe underpins delivery reliability; dual‑source strategies and targeted safety stock (3–6 weeks) reduce disruption risk.
Local incentives and zoning
Local store openings for Zumiez (ticker ZUMZ) hinge on municipal permitting, zoning rules and retail revitalization incentives; political priorities and council support can speed mall redevelopments or block suburban projects, shifting foot traffic between downtowns and malls.
- Permitting: engage early with city planning
- Zoning: align format to local land-use plans
- Incentives: pursue retail revitalization grants
Tax policy and cross-border rules
Corporate tax shifts—US federal rate 21% and the OECD Pillar Two 15% minimum (implemented 2023)—along with EU standard VAT ~20–25% (avg ~21%) and Australia GST 10% directly pressure Zumiez net margins across regions; digital services taxes and evolving online marketplace levies raise e-commerce operating costs.
- Corporate tax: US 21%, Pillar Two 15%
- VAT/GST: EU ~20–25% (avg 21%), Australia 10%
- Digital/marketplace taxes increase platform fees
- Customs valuation scrutiny heightens transfer pricing compliance
- Need: proactive tax planning and robust documentation
Margins squeezed by tariffs 25% and freight +20%
Zumiez faces tariff risk (US Section 301 duties up to 25%) and regionally divergent VAT/GST that raise landed costs and prices. Labor cost inflation and minimums (US federal 7.25/hr; state highs ~15–16/hr; Australia AUD 23.23/hr) compress store margins. Supply‑chain disruption raised freight ~20% in 2023–24, prompting dual sourcing and 3–6 week safety stock. Corporate tax pressures: US 21% and Pillar Two 15%.
| Factor | Key metric |
|---|---|
| Tariffs | Section 301 up to 25% |
| Labor | US avg state top 15–16/hr; AUS AUD 23.23 |
| Freight | +20% (2023–24) |
| Tax | US 21%; Pillar Two 15% |
What is included in the product
Detailed Word Document
Explores how Political, Economic, Social, Technological, Environmental and Legal forces uniquely impact Zumiez, with data-driven trends and industry-specific examples; designed to help executives, consultants and investors identify risks, opportunities and actionable strategies for retail growth and resilience.
Customizable Excel Spreadsheet
Zumiez PESTLE Analysis delivers a clean, visually segmented summary that speeds stakeholder alignment and supports quick decision-making, while allowing easy edits and notes for local context or specific business lines.
Economic factors
Consumer discretionary spending
Zumiez’s youth-focused categories are highly cyclical and sensitive to youth unemployment and real wages; U.S. youth unemployment remained elevated through 2024–25 relative to adults, pressuring discretionary spend. Inflation (U.S. CPI ~3.4% in 2024) and a federal funds rate near 5.25–5.50% in mid‑2025 reduce disposable income and drive apparel trade‑down. Recessionary phases force tighter inventories and steeper promotions, while economic upswings support full‑price sell‑through and category expansion.
FX volatility (USD, EUR, AUD)
Zumiez faces FX volatility as revenue and costs in EUR and AUD expose margins to exchange-rate swings; the US dollar trade-weighted index hovered near 105 in mid-2025, pressuring translated earnings from European Blue Tomato and Fast Times while lowering USD-denominated COGS. Hedging programs and increased local sourcing in Europe and Australia can damp volatility. Clear FX disclosure in filings helps align investor expectations.
Freight, logistics, and input costs
Container spot rates slid from 2021 peaks above 10,000 USD per FEU to roughly 2,000–3,000 USD per FEU in 2024, while U.S. diesel averaged about 3–4 USD/gal in 2024, so container, fuel and last‑mile (≈40% of delivery cost) pressures materially compress Zumiez gross margins. Seasonal supply‑demand imbalances spike costs and squeeze margins during peaks. Vendor negotiations and routing optimization are primary levers to protect margin. Nearshoring and port diversification—U.S. imports from Mexico rose about 20% 2019–2023—add resilience.
Seasonality and demand cadence
Competitive intensity and pricing power
Specialty retailers like Zumiez compete with DTC brands, mass retailers and marketplaces, and fiscal 2023 net sales of about $1.02B highlight scale but not immunity; weak differentiation invites promotional pressure that erodes margins. Exclusive collaborations and community-driven assortments preserve pricing power, while data-led pricing and localized assortments sharpen competitiveness and reduce markdown risk.
- Competition: DTC, mass, marketplaces
- Risk: promo pressure → margin erosion
- Defensive: exclusive collabs, community assortments
- Levers: data pricing, localized assortments
Margins squeezed by tariffs 25% and freight +20%
Zumiez faces cyclical youth demand, with FY2024 net sales ~$1.46B; US youth unemployment stayed above adult rates in 2024–25, pressuring discretionary spend. Inflation (~3.4% CPI in 2024) and a federal funds rate ~5.25–5.50% mid‑2025 reduce real incomes, driving trade‑down. FX (USD TWI ~105 mid‑2025), container rates ~$2–3k/FEU in 2024 and diesel $3–4/gal compress margins; hedging and local sourcing mitigate.
| Metric | Value |
|---|---|
| FY2024 sales | $1.46B |
| US CPI 2024 | ~3.4% |
| Fed funds mid‑2025 | 5.25–5.50% |
| USD TWI mid‑2025 | ~105 |
| Container rate 2024 | $2–3k/FEU |
Full Version Awaits
Zumiez PESTLE Analysis
This Zumiez PESTLE Analysis preview is the exact document you’ll receive after purchase—fully formatted and ready to use. The layout, content, and structure shown here are identical to the downloadable file. No placeholders or teasers—this is the real, finished file you’ll own after checkout.
Description
Plan Smarter. Present Sharper. Compete Stronger.
Discover how political, economic, social, technological, legal and environmental forces are reshaping Zumiez’s competitive landscape in our concise PESTLE overview. Use these actionable insights to anticipate risks, pinpoint growth opportunities, and refine strategy. Purchase the full PESTLE report for the complete, downloadable analysis and ready-to-use recommendations.
Political factors
Trade policy and tariffs
Zumiez sources apparel and hardgoods globally, so import tariffs and quotas — notably U.S. Section 301 measures that impose duties up to 25% on affected Chinese goods — can materially raise landed costs and consumer prices.
EU customs tariff adjustments and Australia’s generally low MFN tariffs (often 0–5% on textiles) can shift relative landed cost advantages and sourcing timelines.
Preferential trade agreements or sanctions can reroute supply chains; management should hedge exposure via supplier diversification and flexible vendor contracts to limit tariff-driven margin volatility.
Labor and wage regulations
Minimum wage hikes and collective bargaining across Zumiez markets raise store payroll and distribution costs—US federal minimum remains $7.25/hr while state levels reach $15–$16 (New York, California), and Australia’s national minimum was set at AUD 23.23/hr by the Fair Work Commission; EU member minima vary widely. New scheduling laws and benefits mandates increase fixed staffing overhead and payroll volatility; political momentum toward living wages can compress margins unless offset by productivity. Store-level labor optimization, tighter scheduling, and tech (POS analytics, labor management systems) can mitigate cost pressure.
Geopolitical stability and supply chain
Ports disruptions, regional conflicts, and political protests can delay shipments and drove freight costs up as much as 20% during 2023‑24, squeezing margins for retailers like Zumiez that source heavily from Asia. Sanctions and export controls since 2022 have restricted access to some inputs and markets, forcing route and vendor changes. Political stability in sourcing hubs such as Southeast Asia and Eastern Europe underpins delivery reliability; dual‑source strategies and targeted safety stock (3–6 weeks) reduce disruption risk.
Local incentives and zoning
Local store openings for Zumiez (ticker ZUMZ) hinge on municipal permitting, zoning rules and retail revitalization incentives; political priorities and council support can speed mall redevelopments or block suburban projects, shifting foot traffic between downtowns and malls.
- Permitting: engage early with city planning
- Zoning: align format to local land-use plans
- Incentives: pursue retail revitalization grants
Tax policy and cross-border rules
Corporate tax shifts—US federal rate 21% and the OECD Pillar Two 15% minimum (implemented 2023)—along with EU standard VAT ~20–25% (avg ~21%) and Australia GST 10% directly pressure Zumiez net margins across regions; digital services taxes and evolving online marketplace levies raise e-commerce operating costs.
- Corporate tax: US 21%, Pillar Two 15%
- VAT/GST: EU ~20–25% (avg 21%), Australia 10%
- Digital/marketplace taxes increase platform fees
- Customs valuation scrutiny heightens transfer pricing compliance
- Need: proactive tax planning and robust documentation
Margins squeezed by tariffs 25% and freight +20%
Zumiez faces tariff risk (US Section 301 duties up to 25%) and regionally divergent VAT/GST that raise landed costs and prices. Labor cost inflation and minimums (US federal 7.25/hr; state highs ~15–16/hr; Australia AUD 23.23/hr) compress store margins. Supply‑chain disruption raised freight ~20% in 2023–24, prompting dual sourcing and 3–6 week safety stock. Corporate tax pressures: US 21% and Pillar Two 15%.
| Factor | Key metric |
|---|---|
| Tariffs | Section 301 up to 25% |
| Labor | US avg state top 15–16/hr; AUS AUD 23.23 |
| Freight | +20% (2023–24) |
| Tax | US 21%; Pillar Two 15% |
What is included in the product
Detailed Word Document
Explores how Political, Economic, Social, Technological, Environmental and Legal forces uniquely impact Zumiez, with data-driven trends and industry-specific examples; designed to help executives, consultants and investors identify risks, opportunities and actionable strategies for retail growth and resilience.
Customizable Excel Spreadsheet
Zumiez PESTLE Analysis delivers a clean, visually segmented summary that speeds stakeholder alignment and supports quick decision-making, while allowing easy edits and notes for local context or specific business lines.
Economic factors
Consumer discretionary spending
Zumiez’s youth-focused categories are highly cyclical and sensitive to youth unemployment and real wages; U.S. youth unemployment remained elevated through 2024–25 relative to adults, pressuring discretionary spend. Inflation (U.S. CPI ~3.4% in 2024) and a federal funds rate near 5.25–5.50% in mid‑2025 reduce disposable income and drive apparel trade‑down. Recessionary phases force tighter inventories and steeper promotions, while economic upswings support full‑price sell‑through and category expansion.
FX volatility (USD, EUR, AUD)
Zumiez faces FX volatility as revenue and costs in EUR and AUD expose margins to exchange-rate swings; the US dollar trade-weighted index hovered near 105 in mid-2025, pressuring translated earnings from European Blue Tomato and Fast Times while lowering USD-denominated COGS. Hedging programs and increased local sourcing in Europe and Australia can damp volatility. Clear FX disclosure in filings helps align investor expectations.
Freight, logistics, and input costs
Container spot rates slid from 2021 peaks above 10,000 USD per FEU to roughly 2,000–3,000 USD per FEU in 2024, while U.S. diesel averaged about 3–4 USD/gal in 2024, so container, fuel and last‑mile (≈40% of delivery cost) pressures materially compress Zumiez gross margins. Seasonal supply‑demand imbalances spike costs and squeeze margins during peaks. Vendor negotiations and routing optimization are primary levers to protect margin. Nearshoring and port diversification—U.S. imports from Mexico rose about 20% 2019–2023—add resilience.
Seasonality and demand cadence
Competitive intensity and pricing power
Specialty retailers like Zumiez compete with DTC brands, mass retailers and marketplaces, and fiscal 2023 net sales of about $1.02B highlight scale but not immunity; weak differentiation invites promotional pressure that erodes margins. Exclusive collaborations and community-driven assortments preserve pricing power, while data-led pricing and localized assortments sharpen competitiveness and reduce markdown risk.
- Competition: DTC, mass, marketplaces
- Risk: promo pressure → margin erosion
- Defensive: exclusive collabs, community assortments
- Levers: data pricing, localized assortments
Margins squeezed by tariffs 25% and freight +20%
Zumiez faces cyclical youth demand, with FY2024 net sales ~$1.46B; US youth unemployment stayed above adult rates in 2024–25, pressuring discretionary spend. Inflation (~3.4% CPI in 2024) and a federal funds rate ~5.25–5.50% mid‑2025 reduce real incomes, driving trade‑down. FX (USD TWI ~105 mid‑2025), container rates ~$2–3k/FEU in 2024 and diesel $3–4/gal compress margins; hedging and local sourcing mitigate.
| Metric | Value |
|---|---|
| FY2024 sales | $1.46B |
| US CPI 2024 | ~3.4% |
| Fed funds mid‑2025 | 5.25–5.50% |
| USD TWI mid‑2025 | ~105 |
| Container rate 2024 | $2–3k/FEU |
Full Version Awaits
Zumiez PESTLE Analysis
This Zumiez PESTLE Analysis preview is the exact document you’ll receive after purchase—fully formatted and ready to use. The layout, content, and structure shown here are identical to the downloadable file. No placeholders or teasers—this is the real, finished file you’ll own after checkout.











