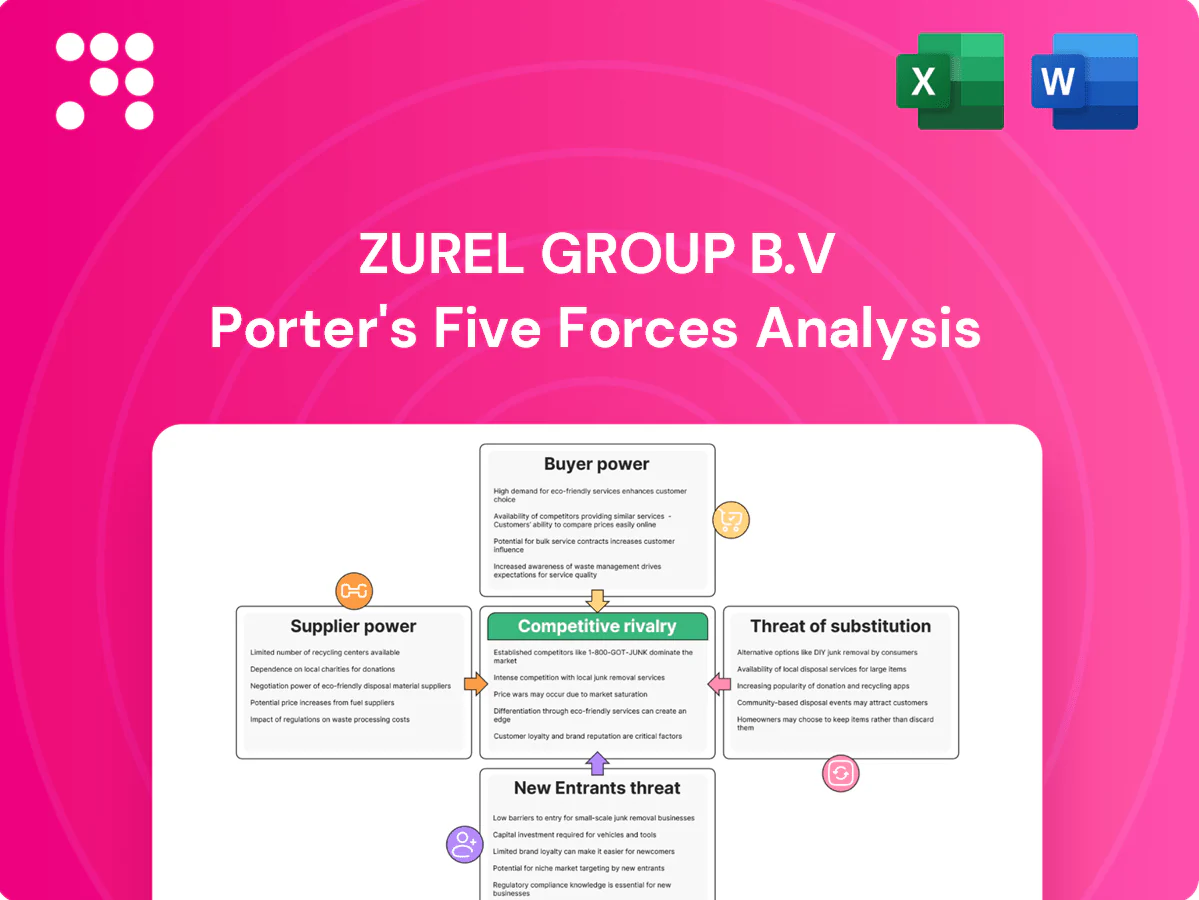
Zurel Group B.V Porter's Five Forces Analysis

From Overview to Strategy Blueprint
Zurel Group B.V. operates in a niche market with moderate buyer power and concentrated supplier relationships that can squeeze margins, while differentiated offerings lower substitute threats and raise industry rivalry. Barriers to entry are mixed—scale benefits protect incumbents but digital channels lower some frictions. This brief snapshot only scratches the surface. Unlock the full Porter's Five Forces Analysis to explore Zurel Group B.V’s competitive dynamics, market pressures, and strategic advantages in detail.
Suppliers Bargaining Power

Fragmented local vendors
Zurel sources housekeeping, maintenance, landscaping and linens from many fragmented local vendors, keeping any single supplier’s bargaining power modest. Switching among providers is operationally feasible but coordination and logistics costs rise as services span multiple parks. Regional seasonality can temporarily tighten local capacity and push spot pricing higher. Multi-park contracts and SLAs standardize quality and contain rate volatility.
Capital & construction inputs
For Zurel Group B.V., capital and construction inputs create moderate supplier power: development/refurbishment depend on contractors, architects and materials with 2024 input volatility and lead times commonly exceeding 20 weeks, allowing contractors to command 10–15% premiums in tight markets and stretch timelines; long lead times raise leverage on large projects, while framework agreements and phased build programs materially mitigate exposure.

Utilities & energy dependence
Holiday parks are energy- and water-intensive, making margins vulnerable to utility cost spikes; European wholesale gas and power volatility peaked in 2022–23 before easing by 2024. Energy suppliers retain moderate bargaining power during volatility, but on-site renewables and hedging (solar/PPAs) materially reduce supplier leverage. Efficiency retrofits cut long-run dependency and lower OPEX.

Technology stack providers
Technology stack providers—PMS, channel managers, locks/IoT vendors—create switching frictions through integration complexity, granting moderate supplier power; GDPR data portability (right established 2018) and API-first adoption in 2024 mitigate lock-in. Modular contracts and explicit data portability clauses protect continuity and reduce migration costs and downtime. Integration complexity drives negotiation leverage but can be constrained by open APIs and contract terms.
- Integration complexity raises supplier leverage
- API-first systems reduce lock-in
- Modular contracts enable exit options
- Data portability clauses (GDPR 2018) protect continuity
Amenities and F&B partners
Pool/spa equipment, playground gear and F&B operators directly shape guest satisfaction and can drive 10–15% of onsite spend; specialty items and branded concessions have been shown to increase per‑capita F&B revenue by ~15–20% in comparable parks (2024 industry reports).
Competitive tendering and revenue‑share agreements reduce upfront capex and align incentives, while standardized specs across multiple parks boost procurement leverage and can cut supplier costs by double digits.
- Supplier share of guest spend: 10–15%
- Branded uplift: ~15–20% per‑capita F&B revenue (2024)
- Standardization: double‑digit cost reductions
- Tendering: revenue‑share aligns incentives
Moderate supplier power: long lead times, 10-15% cost; standards save >10%
Supplier power for Zurel is moderate: fragmented local vendors limit single-supplier leverage but logistics raise switching costs; contractors/materials show >20‑week lead times and 10–15% premiums in tight 2024 markets. Energy/provider volatility peaked 2022–23 but eased by 2024; on-site renewables and hedging reduce long‑run exposure. Standardized specs, tendering and revenue‑share reduce supplier leverage and cut costs double digits.
| Metric | 2024 value | Impact |
|---|---|---|
| Contractor lead time | >20 weeks | Higher project leverage |
| Contractor premiums | 10–15% | Cost pressure |
| Supplier share guest spend | 10–15% | Revenue exposure |
| Branded F&B uplift | 15–20% | Higher margins |
| Standardization saving | ≈10%+ | Lower OPEX |
What is included in the product
 Detailed Word Document
Tailored Porter's Five Forces assessment for Zurel Group B.V. revealing competitive intensity, buyer and supplier bargaining power, threat of substitutes and new entrants, plus strategic levers and vulnerabilities that affect pricing, margins and market positioning.

 Customizable Excel Spreadsheet
A one-sheet Porter's Five Forces for Zurel Group B.V.—clear radar visualization and editable pressure levels to instantly reveal strategic choke points; clean, copy-ready layout integrates into decks or Excel without macros for swift boardroom decisions.
Customers Bargaining Power

Price-transparency via OTAs
Price-transparency on OTAs lets guests compare rates instantly across Booking.com, Airbnb and meta-search, and with Airbnb reporting over 6 million listings in 2024 this intensifies price sensitivity. Low switching costs and OTA commissions averaging 15–20% boost buyer power. Direct-booking perks and loyalty programs shift share back to owners, while parity management and differentiated packaging defend rates.
Seasonality-driven bargaining
Off-peak demand forces Zurel Group to offer discounts and flexible terms—industry data (STR 2024) shows peak-week occupancy often exceeds 85%, while off-peak occupancy can fall below 60%, pressuring rates. During peak weeks scarcity flips bargaining power to the operator, enabling rate hikes. Advanced yield management aligns pricing to demand curves and distribution channels, and minimum-stay rules plus package deals protect ADR in high season.

Group and corporate blocks
Groups and tour operators negotiate volume rates and consolidated demand amplifies their bargaining power; industry reports in 2024 show large blocks can secure discounts typically around 10–15% while representing significant seat/room share. Allotment controls and tiered pricing protect margins, and value-added inclusions (transfers, F&B) commonly offset headline discounts.

Experience expectations
Buyers weigh space, amenities and on-site activities against alternatives; strong reviews and consistent standards cut bargaining power—90% of guests consult reviews before booking, reducing price negotiation leverage.
Personalization and curated add-ons drive willingness to pay, often commanding a 10–20% premium, while clear service recovery policies protect reputation and reduce churn.
- reviews-driven booking: 90%
- premium for personalization: 10–20%
- service recovery → lower churn
Investment-oriented owners
Investment-oriented owners co-managing with Zurel act as buyers of management services, pushing for higher net yields and fee compression; in 2024 benchmark management fees hovered around 1.0–1.5% while investors targeted gross yields near 6–8% in value-add strategies.
- Owners demand fee cuts and yield uplift
- Transparent reporting + performance fees align incentives
- Asset enhancement plans justify premium margins
OTAs: price transparency and reviews shift power; 6M listings, 15–20% fees
OTA price-transparency (Airbnb 6M listings in 2024) and low switching costs raise buyer power; OTAs charge ~15–20% commissions. Reviews drive bookings (90% consult), personalization can add 10–20% willingness-to-pay. Owners push for fee cuts (management fees ~1.0–1.5%) while targeting gross yields of 6–8%.
| Metric | 2024 Value |
|---|---|
| Airbnb listings | 6,000,000 |
| OTA commissions | 15–20% |
| Review influence | 90% |
| Personalization premium | 10–20% |
| Mgmt fees | 1.0–1.5% |
| Target gross yield | 6–8% |
Full Version Awaits
Zurel Group B.V Porter's Five Forces Analysis
This preview displays the exact Zurel Group B.V. Porter's Five Forces Analysis you'll receive immediately after purchase—no surprises or placeholders. The document shown is the same professionally written, fully formatted analysis ready for download and use the moment you buy. You're looking at the final deliverable and will have instant access to this precise file after payment.

From Overview to Strategy Blueprint
Zurel Group B.V. operates in a niche market with moderate buyer power and concentrated supplier relationships that can squeeze margins, while differentiated offerings lower substitute threats and raise industry rivalry. Barriers to entry are mixed—scale benefits protect incumbents but digital channels lower some frictions. This brief snapshot only scratches the surface. Unlock the full Porter's Five Forces Analysis to explore Zurel Group B.V’s competitive dynamics, market pressures, and strategic advantages in detail.
Suppliers Bargaining Power
Fragmented local vendors
Zurel sources housekeeping, maintenance, landscaping and linens from many fragmented local vendors, keeping any single supplier’s bargaining power modest. Switching among providers is operationally feasible but coordination and logistics costs rise as services span multiple parks. Regional seasonality can temporarily tighten local capacity and push spot pricing higher. Multi-park contracts and SLAs standardize quality and contain rate volatility.
Capital & construction inputs
For Zurel Group B.V., capital and construction inputs create moderate supplier power: development/refurbishment depend on contractors, architects and materials with 2024 input volatility and lead times commonly exceeding 20 weeks, allowing contractors to command 10–15% premiums in tight markets and stretch timelines; long lead times raise leverage on large projects, while framework agreements and phased build programs materially mitigate exposure.
Utilities & energy dependence
Holiday parks are energy- and water-intensive, making margins vulnerable to utility cost spikes; European wholesale gas and power volatility peaked in 2022–23 before easing by 2024. Energy suppliers retain moderate bargaining power during volatility, but on-site renewables and hedging (solar/PPAs) materially reduce supplier leverage. Efficiency retrofits cut long-run dependency and lower OPEX.
Technology stack providers
Technology stack providers—PMS, channel managers, locks/IoT vendors—create switching frictions through integration complexity, granting moderate supplier power; GDPR data portability (right established 2018) and API-first adoption in 2024 mitigate lock-in. Modular contracts and explicit data portability clauses protect continuity and reduce migration costs and downtime. Integration complexity drives negotiation leverage but can be constrained by open APIs and contract terms.
- Integration complexity raises supplier leverage
- API-first systems reduce lock-in
- Modular contracts enable exit options
- Data portability clauses (GDPR 2018) protect continuity
Amenities and F&B partners
Pool/spa equipment, playground gear and F&B operators directly shape guest satisfaction and can drive 10–15% of onsite spend; specialty items and branded concessions have been shown to increase per‑capita F&B revenue by ~15–20% in comparable parks (2024 industry reports).
Competitive tendering and revenue‑share agreements reduce upfront capex and align incentives, while standardized specs across multiple parks boost procurement leverage and can cut supplier costs by double digits.
- Supplier share of guest spend: 10–15%
- Branded uplift: ~15–20% per‑capita F&B revenue (2024)
- Standardization: double‑digit cost reductions
- Tendering: revenue‑share aligns incentives
Moderate supplier power: long lead times, 10-15% cost; standards save >10%
Supplier power for Zurel is moderate: fragmented local vendors limit single-supplier leverage but logistics raise switching costs; contractors/materials show >20‑week lead times and 10–15% premiums in tight 2024 markets. Energy/provider volatility peaked 2022–23 but eased by 2024; on-site renewables and hedging reduce long‑run exposure. Standardized specs, tendering and revenue‑share reduce supplier leverage and cut costs double digits.
| Metric | 2024 value | Impact |
|---|---|---|
| Contractor lead time | >20 weeks | Higher project leverage |
| Contractor premiums | 10–15% | Cost pressure |
| Supplier share guest spend | 10–15% | Revenue exposure |
| Branded F&B uplift | 15–20% | Higher margins |
| Standardization saving | ≈10%+ | Lower OPEX |
What is included in the product
Detailed Word Document
Tailored Porter's Five Forces assessment for Zurel Group B.V. revealing competitive intensity, buyer and supplier bargaining power, threat of substitutes and new entrants, plus strategic levers and vulnerabilities that affect pricing, margins and market positioning.
Customizable Excel Spreadsheet
A one-sheet Porter's Five Forces for Zurel Group B.V.—clear radar visualization and editable pressure levels to instantly reveal strategic choke points; clean, copy-ready layout integrates into decks or Excel without macros for swift boardroom decisions.
Customers Bargaining Power
Price-transparency via OTAs
Price-transparency on OTAs lets guests compare rates instantly across Booking.com, Airbnb and meta-search, and with Airbnb reporting over 6 million listings in 2024 this intensifies price sensitivity. Low switching costs and OTA commissions averaging 15–20% boost buyer power. Direct-booking perks and loyalty programs shift share back to owners, while parity management and differentiated packaging defend rates.
Seasonality-driven bargaining
Off-peak demand forces Zurel Group to offer discounts and flexible terms—industry data (STR 2024) shows peak-week occupancy often exceeds 85%, while off-peak occupancy can fall below 60%, pressuring rates. During peak weeks scarcity flips bargaining power to the operator, enabling rate hikes. Advanced yield management aligns pricing to demand curves and distribution channels, and minimum-stay rules plus package deals protect ADR in high season.
Group and corporate blocks
Groups and tour operators negotiate volume rates and consolidated demand amplifies their bargaining power; industry reports in 2024 show large blocks can secure discounts typically around 10–15% while representing significant seat/room share. Allotment controls and tiered pricing protect margins, and value-added inclusions (transfers, F&B) commonly offset headline discounts.
Experience expectations
Buyers weigh space, amenities and on-site activities against alternatives; strong reviews and consistent standards cut bargaining power—90% of guests consult reviews before booking, reducing price negotiation leverage.
Personalization and curated add-ons drive willingness to pay, often commanding a 10–20% premium, while clear service recovery policies protect reputation and reduce churn.
- reviews-driven booking: 90%
- premium for personalization: 10–20%
- service recovery → lower churn
Investment-oriented owners
Investment-oriented owners co-managing with Zurel act as buyers of management services, pushing for higher net yields and fee compression; in 2024 benchmark management fees hovered around 1.0–1.5% while investors targeted gross yields near 6–8% in value-add strategies.
- Owners demand fee cuts and yield uplift
- Transparent reporting + performance fees align incentives
- Asset enhancement plans justify premium margins
OTAs: price transparency and reviews shift power; 6M listings, 15–20% fees
OTA price-transparency (Airbnb 6M listings in 2024) and low switching costs raise buyer power; OTAs charge ~15–20% commissions. Reviews drive bookings (90% consult), personalization can add 10–20% willingness-to-pay. Owners push for fee cuts (management fees ~1.0–1.5%) while targeting gross yields of 6–8%.
| Metric | 2024 Value |
|---|---|
| Airbnb listings | 6,000,000 |
| OTA commissions | 15–20% |
| Review influence | 90% |
| Personalization premium | 10–20% |
| Mgmt fees | 1.0–1.5% |
| Target gross yield | 6–8% |
Full Version Awaits
Zurel Group B.V Porter's Five Forces Analysis
This preview displays the exact Zurel Group B.V. Porter's Five Forces Analysis you'll receive immediately after purchase—no surprises or placeholders. The document shown is the same professionally written, fully formatted analysis ready for download and use the moment you buy. You're looking at the final deliverable and will have instant access to this precise file after payment.
Original: $10.00
-65%$10.00
$3.50Description
From Overview to Strategy Blueprint
Zurel Group B.V. operates in a niche market with moderate buyer power and concentrated supplier relationships that can squeeze margins, while differentiated offerings lower substitute threats and raise industry rivalry. Barriers to entry are mixed—scale benefits protect incumbents but digital channels lower some frictions. This brief snapshot only scratches the surface. Unlock the full Porter's Five Forces Analysis to explore Zurel Group B.V’s competitive dynamics, market pressures, and strategic advantages in detail.
Suppliers Bargaining Power
Fragmented local vendors
Zurel sources housekeeping, maintenance, landscaping and linens from many fragmented local vendors, keeping any single supplier’s bargaining power modest. Switching among providers is operationally feasible but coordination and logistics costs rise as services span multiple parks. Regional seasonality can temporarily tighten local capacity and push spot pricing higher. Multi-park contracts and SLAs standardize quality and contain rate volatility.
Capital & construction inputs
For Zurel Group B.V., capital and construction inputs create moderate supplier power: development/refurbishment depend on contractors, architects and materials with 2024 input volatility and lead times commonly exceeding 20 weeks, allowing contractors to command 10–15% premiums in tight markets and stretch timelines; long lead times raise leverage on large projects, while framework agreements and phased build programs materially mitigate exposure.
Utilities & energy dependence
Holiday parks are energy- and water-intensive, making margins vulnerable to utility cost spikes; European wholesale gas and power volatility peaked in 2022–23 before easing by 2024. Energy suppliers retain moderate bargaining power during volatility, but on-site renewables and hedging (solar/PPAs) materially reduce supplier leverage. Efficiency retrofits cut long-run dependency and lower OPEX.
Technology stack providers
Technology stack providers—PMS, channel managers, locks/IoT vendors—create switching frictions through integration complexity, granting moderate supplier power; GDPR data portability (right established 2018) and API-first adoption in 2024 mitigate lock-in. Modular contracts and explicit data portability clauses protect continuity and reduce migration costs and downtime. Integration complexity drives negotiation leverage but can be constrained by open APIs and contract terms.
- Integration complexity raises supplier leverage
- API-first systems reduce lock-in
- Modular contracts enable exit options
- Data portability clauses (GDPR 2018) protect continuity
Amenities and F&B partners
Pool/spa equipment, playground gear and F&B operators directly shape guest satisfaction and can drive 10–15% of onsite spend; specialty items and branded concessions have been shown to increase per‑capita F&B revenue by ~15–20% in comparable parks (2024 industry reports).
Competitive tendering and revenue‑share agreements reduce upfront capex and align incentives, while standardized specs across multiple parks boost procurement leverage and can cut supplier costs by double digits.
- Supplier share of guest spend: 10–15%
- Branded uplift: ~15–20% per‑capita F&B revenue (2024)
- Standardization: double‑digit cost reductions
- Tendering: revenue‑share aligns incentives
Moderate supplier power: long lead times, 10-15% cost; standards save >10%
Supplier power for Zurel is moderate: fragmented local vendors limit single-supplier leverage but logistics raise switching costs; contractors/materials show >20‑week lead times and 10–15% premiums in tight 2024 markets. Energy/provider volatility peaked 2022–23 but eased by 2024; on-site renewables and hedging reduce long‑run exposure. Standardized specs, tendering and revenue‑share reduce supplier leverage and cut costs double digits.
| Metric | 2024 value | Impact |
|---|---|---|
| Contractor lead time | >20 weeks | Higher project leverage |
| Contractor premiums | 10–15% | Cost pressure |
| Supplier share guest spend | 10–15% | Revenue exposure |
| Branded F&B uplift | 15–20% | Higher margins |
| Standardization saving | ≈10%+ | Lower OPEX |
What is included in the product
Detailed Word Document
Tailored Porter's Five Forces assessment for Zurel Group B.V. revealing competitive intensity, buyer and supplier bargaining power, threat of substitutes and new entrants, plus strategic levers and vulnerabilities that affect pricing, margins and market positioning.
Customizable Excel Spreadsheet
A one-sheet Porter's Five Forces for Zurel Group B.V.—clear radar visualization and editable pressure levels to instantly reveal strategic choke points; clean, copy-ready layout integrates into decks or Excel without macros for swift boardroom decisions.
Customers Bargaining Power
Price-transparency via OTAs
Price-transparency on OTAs lets guests compare rates instantly across Booking.com, Airbnb and meta-search, and with Airbnb reporting over 6 million listings in 2024 this intensifies price sensitivity. Low switching costs and OTA commissions averaging 15–20% boost buyer power. Direct-booking perks and loyalty programs shift share back to owners, while parity management and differentiated packaging defend rates.
Seasonality-driven bargaining
Off-peak demand forces Zurel Group to offer discounts and flexible terms—industry data (STR 2024) shows peak-week occupancy often exceeds 85%, while off-peak occupancy can fall below 60%, pressuring rates. During peak weeks scarcity flips bargaining power to the operator, enabling rate hikes. Advanced yield management aligns pricing to demand curves and distribution channels, and minimum-stay rules plus package deals protect ADR in high season.
Group and corporate blocks
Groups and tour operators negotiate volume rates and consolidated demand amplifies their bargaining power; industry reports in 2024 show large blocks can secure discounts typically around 10–15% while representing significant seat/room share. Allotment controls and tiered pricing protect margins, and value-added inclusions (transfers, F&B) commonly offset headline discounts.
Experience expectations
Buyers weigh space, amenities and on-site activities against alternatives; strong reviews and consistent standards cut bargaining power—90% of guests consult reviews before booking, reducing price negotiation leverage.
Personalization and curated add-ons drive willingness to pay, often commanding a 10–20% premium, while clear service recovery policies protect reputation and reduce churn.
- reviews-driven booking: 90%
- premium for personalization: 10–20%
- service recovery → lower churn
Investment-oriented owners
Investment-oriented owners co-managing with Zurel act as buyers of management services, pushing for higher net yields and fee compression; in 2024 benchmark management fees hovered around 1.0–1.5% while investors targeted gross yields near 6–8% in value-add strategies.
- Owners demand fee cuts and yield uplift
- Transparent reporting + performance fees align incentives
- Asset enhancement plans justify premium margins
OTAs: price transparency and reviews shift power; 6M listings, 15–20% fees
OTA price-transparency (Airbnb 6M listings in 2024) and low switching costs raise buyer power; OTAs charge ~15–20% commissions. Reviews drive bookings (90% consult), personalization can add 10–20% willingness-to-pay. Owners push for fee cuts (management fees ~1.0–1.5%) while targeting gross yields of 6–8%.
| Metric | 2024 Value |
|---|---|
| Airbnb listings | 6,000,000 |
| OTA commissions | 15–20% |
| Review influence | 90% |
| Personalization premium | 10–20% |
| Mgmt fees | 1.0–1.5% |
| Target gross yield | 6–8% |
Full Version Awaits
Zurel Group B.V Porter's Five Forces Analysis
This preview displays the exact Zurel Group B.V. Porter's Five Forces Analysis you'll receive immediately after purchase—no surprises or placeholders. The document shown is the same professionally written, fully formatted analysis ready for download and use the moment you buy. You're looking at the final deliverable and will have instant access to this precise file after payment.











