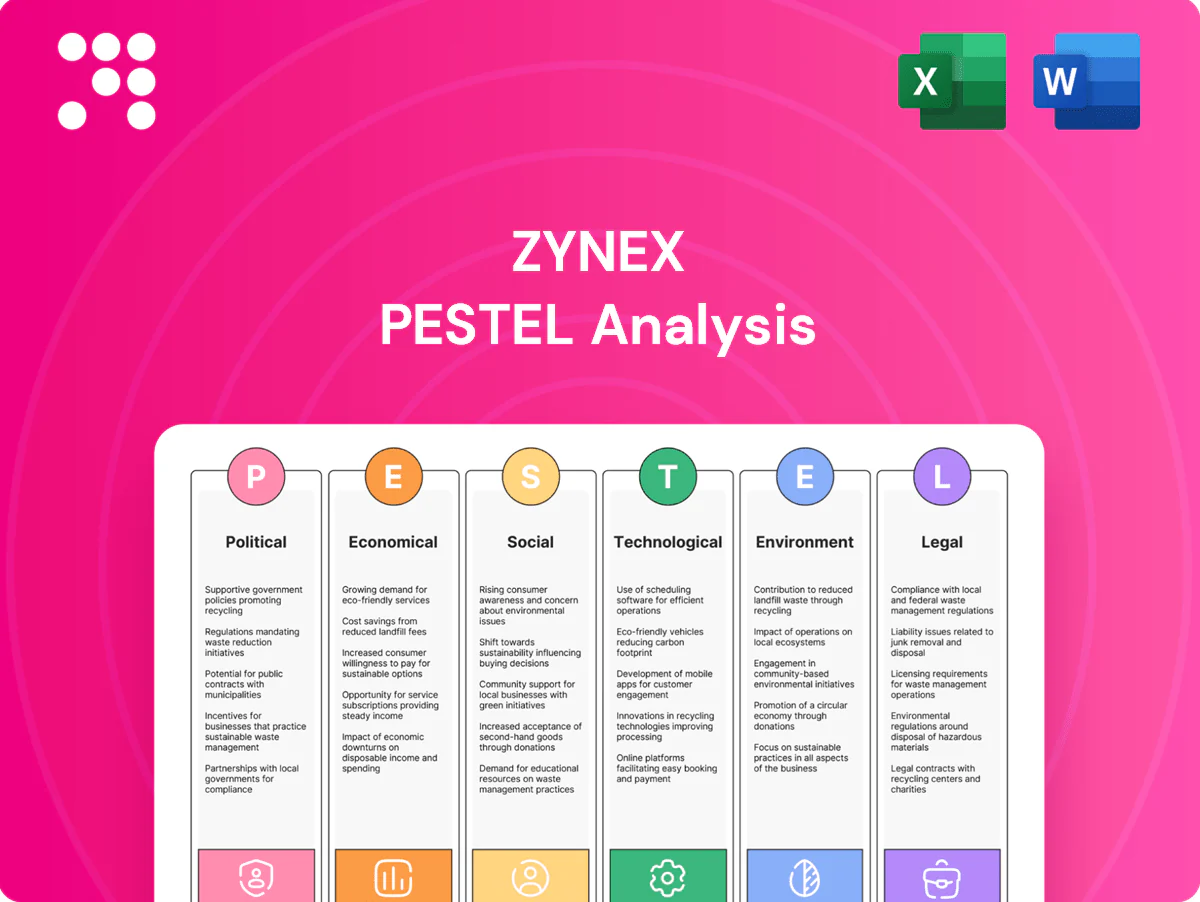
Zynex PESTLE Analysis

Your Competitive Advantage Starts with This Report
Discover how political, economic, social, technological, legal, and environmental forces are shaping Zynex’s outlook in our concise PESTLE snapshot. This analysis highlights key risks and opportunities to inform investment and strategy decisions. Purchase the full PESTLE for a detailed, ready-to-use report and actionable insights you can deploy immediately.
Political factors

Healthcare reimbursement policy
Medicare (≈66 million) and Medicaid (≈80 million) coverage decisions, plus private insurer policies, directly shape demand for electrotherapy devices; favorable coverage for non‑invasive pain management accelerates adoption while restrictive policies constrain growth. With ~50 million US adults reporting chronic pain, policy shifts to value‑based care that reward cost‑effective drug alternatives increase market opportunity, so Zynex must align robust clinical evidence with payer requirements to secure reimbursement.
Opioid crisis policy tailwinds
Federal and state initiatives favoring non-pharmacologic pain care create tailwinds for Zynex, supported by the NIH HEAL Initiative which received roughly 1.1 billion USD in 2018 to advance alternatives. Recent CDC data show opioid prescribing has fallen sharply since the 2012 peak, boosting payer interest in devices and therapies. Grants and pilot programs can open formulary access, but wide funding variability across states requires tailored market-access strategies.

Trade and tariff exposure
Tariffs under US Section 301 on many electronics imports can reach 25%, raising Zynex bill-of-materials costs; chips, sensors and cables are at particular risk given TSMC’s ~53% foundry share in 2023. Geopolitical tensions around Taiwan/China can disrupt supply; the US CHIPS Act allocates $52 billion to onshore capacity. Diversifying suppliers and nearshoring reduce disruption and lead-time risk, while Zynex’s ability to pass costs depends on pricing power in its markets.

Public procurement and VA systems
Contracts with the VA and other government healthcare systems can be sizable yet fiercely competitive; the VA serves about 6.6 million enrolled veterans and awards multi-million-dollar procurements. Compliance and evidence thresholds for VA device procurement are stringent, requiring robust clinical/outcomes data. Political budget cycles and appropriations timing materially affect award timing and volume; maintaining GPO contracts, used by over 80% of US hospitals, can stabilize demand.
- VA enrollment ~6.6M
- Multi-million-dollar procurements
- High clinical evidence/compliance bar
- Budget cycles drive timing/volume
- GPOs (>80% hospital use) stabilize demand
Health policy variability by market
International expansion for Zynex encounters heterogeneous device regulations and reimbursement regimes, with over 50 national HTA bodies active as of 2024 causing variable market access pathways. National health technology assessments can delay entry timelines and increase launch costs, while local lobbying and inclusion in clinical guidelines materially affect uptake. Country risk and regulatory complexity determine sequencing of market launches.
- HTA bodies: 50+ (2024)
- Regulatory heterogeneity: EU, US, APAC differences
- Guideline inclusion critical for adoption
- Country risk shapes launch order
~146M public enrollees, ~50M chronic pain: reimbursement, HTA & VA access drive adoption
Medicare (~66M) and Medicaid (~80M) coverage plus private payer policies drive adoption; ~50M US adults with chronic pain and falling opioid prescribing favor nonpharmacologic devices if reimbursement criteria are met. Tariffs (up to 25%) and Taiwan/China geopolitical risk raise component costs; CHIPS Act $52B aims to onshore semiconductors. VA procurement (~6.6M enrollees) and 50+ HTA bodies shape market access and launch sequencing.
| Metric | Value |
|---|---|
| Medicare | ~66M |
| Medicaid | ~80M |
| Chronic pain | ~50M adults |
| Tariff risk | Up to 25% |
| VA enrollment | ~6.6M |
| HTA bodies | 50+ (2024) |
What is included in the product
 Detailed Word Document
Explores how macro-environmental factors uniquely affect Zynex across Political, Economic, Social, Technological, Environmental and Legal dimensions, with data-backed trends and region-specific regulatory context; designed to help executives and investors identify risks, opportunities and inform forward-looking strategy.

 Customizable Excel Spreadsheet
Zynex PESTLE Analysis is a concise, visually segmented summary that eases stakeholder alignment, supports external risk discussions, and can be dropped into presentations for quick decision-making.
Economic factors

Macroeconomic cycles
Recessions squeeze elective rehab budgets and patient out-of-pocket affordability, with elective volumes shown to fall as much as 48% in severe downturns (COVID peak); however chronic pain prevalence remains ~20.4% (~50 million US adults) through 2024, supporting baseline demand. Hospital capital constraints forced many facilities to defer projects in 2023, while Zynex-style lean sales and recurring consumables revenue cushion cycles.
Reimbursement rate pressure
Payer cost-containment is squeezing Zynex as shrinking fee schedules and margin pressure follow broader US health spending of about $4.5 trillion in 2023; Medicare Advantage enrollment exceeding 50% (2023) also strengthens payer leverage. Prior authorization and utilization management lengthen sales cycles and can delay revenue recognition. Demonstrating clear economic outcomes (reduced total cost of care) is essential to defend payment levels. Contracting strategy dictates rebate and discount exposure and thus net realized prices.

Input cost inflation
Electronics, plastics, and logistics inflation continue to compress Zynex gross margins, raising unit costs and squeeze on profitability. Long-term supplier contracts and design-for-cost initiatives can lock prices and reduce BOM spend over time. Active inventory management must balance device availability against cash tied up in stock. FX volatility affects component sourcing costs and international revenue translation.

Labor market dynamics
Clinician shortages—AAMC projects a shortfall of 37,800 to 124,000 physicians by 2034—limit provider time for training and slow adoption of Zynex modalities, making field sales and clinical support critical to scaling revenue. Rising labor costs (average hourly earnings up ~4% y/y in 2024) lift SG&A, while simplified workflows and remote onboarding can materially reduce adoption friction and training time.
- Clinician shortages: AAMC 37,800–124,000 by 2034
- Salesforce & clinical support drive revenue scale
- Wage inflation ~4% y/y (2024) raises SG&A
- Remote onboarding/simplified workflows cut adoption time
Revenue mix and recurring supplies
Consumables such as electrodes, batteries and leads drive predictable recurring revenue for Zynex, supporting gross-margin stability and customer retention. Shifts in payer mix (Medicare, private insurers, self-pay) lengthen collection cycles and raise bad-debt risk, making DSO management critical to cash-flow resilience. Cross-selling diagnostics into existing accounts helps smooth seasonality and diversify receipts.
- Recurring consumables revenue
- Payer-mix affects collections and bad debt
- DSO directly impacts cash flow
- Diagnostics cross-sell reduces seasonality
~146M public enrollees, ~50M chronic pain: reimbursement, HTA & VA access drive adoption
Recessions cut elective rehab volumes (up to 48% at COVID peak) but chronic pain prevalence ~20.4% (~50M US adults in 2024) sustains baseline demand. 2023 US health spending ~$4.5T and Medicare Advantage >50% (2023) increase payer leverage and authorization delays. Electronics/plastics inflation and wage inflation ~4% (2024) compress margins; recurring consumables stabilize revenue.
| Metric | Value |
|---|---|
| US health spending (2023) | $4.5T |
| Chronic pain (2024) | ~50M (20.4%) |
| Medicare Advantage (2023) | >50% |
| Wage inflation (2024) | ~4% y/y |
| Elective drop (COVID peak) | ~48% |
| Physician shortfall (2034) | 37,800–124,000 |
Preview the Actual Deliverable
Zynex PESTLE Analysis
The preview shown here is the exact Zynex PESTLE Analysis you’ll receive after purchase—fully formatted, professionally structured, and ready to use. No placeholders or surprises; the content, layout, and data visible in the screenshot are the final deliverable. You’ll be able to download this identical file immediately after payment.

Your Competitive Advantage Starts with This Report
Discover how political, economic, social, technological, legal, and environmental forces are shaping Zynex’s outlook in our concise PESTLE snapshot. This analysis highlights key risks and opportunities to inform investment and strategy decisions. Purchase the full PESTLE for a detailed, ready-to-use report and actionable insights you can deploy immediately.
Political factors
Healthcare reimbursement policy
Medicare (≈66 million) and Medicaid (≈80 million) coverage decisions, plus private insurer policies, directly shape demand for electrotherapy devices; favorable coverage for non‑invasive pain management accelerates adoption while restrictive policies constrain growth. With ~50 million US adults reporting chronic pain, policy shifts to value‑based care that reward cost‑effective drug alternatives increase market opportunity, so Zynex must align robust clinical evidence with payer requirements to secure reimbursement.
Opioid crisis policy tailwinds
Federal and state initiatives favoring non-pharmacologic pain care create tailwinds for Zynex, supported by the NIH HEAL Initiative which received roughly 1.1 billion USD in 2018 to advance alternatives. Recent CDC data show opioid prescribing has fallen sharply since the 2012 peak, boosting payer interest in devices and therapies. Grants and pilot programs can open formulary access, but wide funding variability across states requires tailored market-access strategies.
Trade and tariff exposure
Tariffs under US Section 301 on many electronics imports can reach 25%, raising Zynex bill-of-materials costs; chips, sensors and cables are at particular risk given TSMC’s ~53% foundry share in 2023. Geopolitical tensions around Taiwan/China can disrupt supply; the US CHIPS Act allocates $52 billion to onshore capacity. Diversifying suppliers and nearshoring reduce disruption and lead-time risk, while Zynex’s ability to pass costs depends on pricing power in its markets.
Public procurement and VA systems
Contracts with the VA and other government healthcare systems can be sizable yet fiercely competitive; the VA serves about 6.6 million enrolled veterans and awards multi-million-dollar procurements. Compliance and evidence thresholds for VA device procurement are stringent, requiring robust clinical/outcomes data. Political budget cycles and appropriations timing materially affect award timing and volume; maintaining GPO contracts, used by over 80% of US hospitals, can stabilize demand.
- VA enrollment ~6.6M
- Multi-million-dollar procurements
- High clinical evidence/compliance bar
- Budget cycles drive timing/volume
- GPOs (>80% hospital use) stabilize demand
Health policy variability by market
International expansion for Zynex encounters heterogeneous device regulations and reimbursement regimes, with over 50 national HTA bodies active as of 2024 causing variable market access pathways. National health technology assessments can delay entry timelines and increase launch costs, while local lobbying and inclusion in clinical guidelines materially affect uptake. Country risk and regulatory complexity determine sequencing of market launches.
- HTA bodies: 50+ (2024)
- Regulatory heterogeneity: EU, US, APAC differences
- Guideline inclusion critical for adoption
- Country risk shapes launch order
~146M public enrollees, ~50M chronic pain: reimbursement, HTA & VA access drive adoption
Medicare (~66M) and Medicaid (~80M) coverage plus private payer policies drive adoption; ~50M US adults with chronic pain and falling opioid prescribing favor nonpharmacologic devices if reimbursement criteria are met. Tariffs (up to 25%) and Taiwan/China geopolitical risk raise component costs; CHIPS Act $52B aims to onshore semiconductors. VA procurement (~6.6M enrollees) and 50+ HTA bodies shape market access and launch sequencing.
| Metric | Value |
|---|---|
| Medicare | ~66M |
| Medicaid | ~80M |
| Chronic pain | ~50M adults |
| Tariff risk | Up to 25% |
| VA enrollment | ~6.6M |
| HTA bodies | 50+ (2024) |
What is included in the product
Detailed Word Document
Explores how macro-environmental factors uniquely affect Zynex across Political, Economic, Social, Technological, Environmental and Legal dimensions, with data-backed trends and region-specific regulatory context; designed to help executives and investors identify risks, opportunities and inform forward-looking strategy.
Customizable Excel Spreadsheet
Zynex PESTLE Analysis is a concise, visually segmented summary that eases stakeholder alignment, supports external risk discussions, and can be dropped into presentations for quick decision-making.
Economic factors
Macroeconomic cycles
Recessions squeeze elective rehab budgets and patient out-of-pocket affordability, with elective volumes shown to fall as much as 48% in severe downturns (COVID peak); however chronic pain prevalence remains ~20.4% (~50 million US adults) through 2024, supporting baseline demand. Hospital capital constraints forced many facilities to defer projects in 2023, while Zynex-style lean sales and recurring consumables revenue cushion cycles.
Reimbursement rate pressure
Payer cost-containment is squeezing Zynex as shrinking fee schedules and margin pressure follow broader US health spending of about $4.5 trillion in 2023; Medicare Advantage enrollment exceeding 50% (2023) also strengthens payer leverage. Prior authorization and utilization management lengthen sales cycles and can delay revenue recognition. Demonstrating clear economic outcomes (reduced total cost of care) is essential to defend payment levels. Contracting strategy dictates rebate and discount exposure and thus net realized prices.
Input cost inflation
Electronics, plastics, and logistics inflation continue to compress Zynex gross margins, raising unit costs and squeeze on profitability. Long-term supplier contracts and design-for-cost initiatives can lock prices and reduce BOM spend over time. Active inventory management must balance device availability against cash tied up in stock. FX volatility affects component sourcing costs and international revenue translation.
Labor market dynamics
Clinician shortages—AAMC projects a shortfall of 37,800 to 124,000 physicians by 2034—limit provider time for training and slow adoption of Zynex modalities, making field sales and clinical support critical to scaling revenue. Rising labor costs (average hourly earnings up ~4% y/y in 2024) lift SG&A, while simplified workflows and remote onboarding can materially reduce adoption friction and training time.
- Clinician shortages: AAMC 37,800–124,000 by 2034
- Salesforce & clinical support drive revenue scale
- Wage inflation ~4% y/y (2024) raises SG&A
- Remote onboarding/simplified workflows cut adoption time
Revenue mix and recurring supplies
Consumables such as electrodes, batteries and leads drive predictable recurring revenue for Zynex, supporting gross-margin stability and customer retention. Shifts in payer mix (Medicare, private insurers, self-pay) lengthen collection cycles and raise bad-debt risk, making DSO management critical to cash-flow resilience. Cross-selling diagnostics into existing accounts helps smooth seasonality and diversify receipts.
- Recurring consumables revenue
- Payer-mix affects collections and bad debt
- DSO directly impacts cash flow
- Diagnostics cross-sell reduces seasonality
~146M public enrollees, ~50M chronic pain: reimbursement, HTA & VA access drive adoption
Recessions cut elective rehab volumes (up to 48% at COVID peak) but chronic pain prevalence ~20.4% (~50M US adults in 2024) sustains baseline demand. 2023 US health spending ~$4.5T and Medicare Advantage >50% (2023) increase payer leverage and authorization delays. Electronics/plastics inflation and wage inflation ~4% (2024) compress margins; recurring consumables stabilize revenue.
| Metric | Value |
|---|---|
| US health spending (2023) | $4.5T |
| Chronic pain (2024) | ~50M (20.4%) |
| Medicare Advantage (2023) | >50% |
| Wage inflation (2024) | ~4% y/y |
| Elective drop (COVID peak) | ~48% |
| Physician shortfall (2034) | 37,800–124,000 |
Preview the Actual Deliverable
Zynex PESTLE Analysis
The preview shown here is the exact Zynex PESTLE Analysis you’ll receive after purchase—fully formatted, professionally structured, and ready to use. No placeholders or surprises; the content, layout, and data visible in the screenshot are the final deliverable. You’ll be able to download this identical file immediately after payment.
Description
Your Competitive Advantage Starts with This Report
Discover how political, economic, social, technological, legal, and environmental forces are shaping Zynex’s outlook in our concise PESTLE snapshot. This analysis highlights key risks and opportunities to inform investment and strategy decisions. Purchase the full PESTLE for a detailed, ready-to-use report and actionable insights you can deploy immediately.
Political factors
Healthcare reimbursement policy
Medicare (≈66 million) and Medicaid (≈80 million) coverage decisions, plus private insurer policies, directly shape demand for electrotherapy devices; favorable coverage for non‑invasive pain management accelerates adoption while restrictive policies constrain growth. With ~50 million US adults reporting chronic pain, policy shifts to value‑based care that reward cost‑effective drug alternatives increase market opportunity, so Zynex must align robust clinical evidence with payer requirements to secure reimbursement.
Opioid crisis policy tailwinds
Federal and state initiatives favoring non-pharmacologic pain care create tailwinds for Zynex, supported by the NIH HEAL Initiative which received roughly 1.1 billion USD in 2018 to advance alternatives. Recent CDC data show opioid prescribing has fallen sharply since the 2012 peak, boosting payer interest in devices and therapies. Grants and pilot programs can open formulary access, but wide funding variability across states requires tailored market-access strategies.
Trade and tariff exposure
Tariffs under US Section 301 on many electronics imports can reach 25%, raising Zynex bill-of-materials costs; chips, sensors and cables are at particular risk given TSMC’s ~53% foundry share in 2023. Geopolitical tensions around Taiwan/China can disrupt supply; the US CHIPS Act allocates $52 billion to onshore capacity. Diversifying suppliers and nearshoring reduce disruption and lead-time risk, while Zynex’s ability to pass costs depends on pricing power in its markets.
Public procurement and VA systems
Contracts with the VA and other government healthcare systems can be sizable yet fiercely competitive; the VA serves about 6.6 million enrolled veterans and awards multi-million-dollar procurements. Compliance and evidence thresholds for VA device procurement are stringent, requiring robust clinical/outcomes data. Political budget cycles and appropriations timing materially affect award timing and volume; maintaining GPO contracts, used by over 80% of US hospitals, can stabilize demand.
- VA enrollment ~6.6M
- Multi-million-dollar procurements
- High clinical evidence/compliance bar
- Budget cycles drive timing/volume
- GPOs (>80% hospital use) stabilize demand
Health policy variability by market
International expansion for Zynex encounters heterogeneous device regulations and reimbursement regimes, with over 50 national HTA bodies active as of 2024 causing variable market access pathways. National health technology assessments can delay entry timelines and increase launch costs, while local lobbying and inclusion in clinical guidelines materially affect uptake. Country risk and regulatory complexity determine sequencing of market launches.
- HTA bodies: 50+ (2024)
- Regulatory heterogeneity: EU, US, APAC differences
- Guideline inclusion critical for adoption
- Country risk shapes launch order
~146M public enrollees, ~50M chronic pain: reimbursement, HTA & VA access drive adoption
Medicare (~66M) and Medicaid (~80M) coverage plus private payer policies drive adoption; ~50M US adults with chronic pain and falling opioid prescribing favor nonpharmacologic devices if reimbursement criteria are met. Tariffs (up to 25%) and Taiwan/China geopolitical risk raise component costs; CHIPS Act $52B aims to onshore semiconductors. VA procurement (~6.6M enrollees) and 50+ HTA bodies shape market access and launch sequencing.
| Metric | Value |
|---|---|
| Medicare | ~66M |
| Medicaid | ~80M |
| Chronic pain | ~50M adults |
| Tariff risk | Up to 25% |
| VA enrollment | ~6.6M |
| HTA bodies | 50+ (2024) |
What is included in the product
Detailed Word Document
Explores how macro-environmental factors uniquely affect Zynex across Political, Economic, Social, Technological, Environmental and Legal dimensions, with data-backed trends and region-specific regulatory context; designed to help executives and investors identify risks, opportunities and inform forward-looking strategy.
Customizable Excel Spreadsheet
Zynex PESTLE Analysis is a concise, visually segmented summary that eases stakeholder alignment, supports external risk discussions, and can be dropped into presentations for quick decision-making.
Economic factors
Macroeconomic cycles
Recessions squeeze elective rehab budgets and patient out-of-pocket affordability, with elective volumes shown to fall as much as 48% in severe downturns (COVID peak); however chronic pain prevalence remains ~20.4% (~50 million US adults) through 2024, supporting baseline demand. Hospital capital constraints forced many facilities to defer projects in 2023, while Zynex-style lean sales and recurring consumables revenue cushion cycles.
Reimbursement rate pressure
Payer cost-containment is squeezing Zynex as shrinking fee schedules and margin pressure follow broader US health spending of about $4.5 trillion in 2023; Medicare Advantage enrollment exceeding 50% (2023) also strengthens payer leverage. Prior authorization and utilization management lengthen sales cycles and can delay revenue recognition. Demonstrating clear economic outcomes (reduced total cost of care) is essential to defend payment levels. Contracting strategy dictates rebate and discount exposure and thus net realized prices.
Input cost inflation
Electronics, plastics, and logistics inflation continue to compress Zynex gross margins, raising unit costs and squeeze on profitability. Long-term supplier contracts and design-for-cost initiatives can lock prices and reduce BOM spend over time. Active inventory management must balance device availability against cash tied up in stock. FX volatility affects component sourcing costs and international revenue translation.
Labor market dynamics
Clinician shortages—AAMC projects a shortfall of 37,800 to 124,000 physicians by 2034—limit provider time for training and slow adoption of Zynex modalities, making field sales and clinical support critical to scaling revenue. Rising labor costs (average hourly earnings up ~4% y/y in 2024) lift SG&A, while simplified workflows and remote onboarding can materially reduce adoption friction and training time.
- Clinician shortages: AAMC 37,800–124,000 by 2034
- Salesforce & clinical support drive revenue scale
- Wage inflation ~4% y/y (2024) raises SG&A
- Remote onboarding/simplified workflows cut adoption time
Revenue mix and recurring supplies
Consumables such as electrodes, batteries and leads drive predictable recurring revenue for Zynex, supporting gross-margin stability and customer retention. Shifts in payer mix (Medicare, private insurers, self-pay) lengthen collection cycles and raise bad-debt risk, making DSO management critical to cash-flow resilience. Cross-selling diagnostics into existing accounts helps smooth seasonality and diversify receipts.
- Recurring consumables revenue
- Payer-mix affects collections and bad debt
- DSO directly impacts cash flow
- Diagnostics cross-sell reduces seasonality
~146M public enrollees, ~50M chronic pain: reimbursement, HTA & VA access drive adoption
Recessions cut elective rehab volumes (up to 48% at COVID peak) but chronic pain prevalence ~20.4% (~50M US adults in 2024) sustains baseline demand. 2023 US health spending ~$4.5T and Medicare Advantage >50% (2023) increase payer leverage and authorization delays. Electronics/plastics inflation and wage inflation ~4% (2024) compress margins; recurring consumables stabilize revenue.
| Metric | Value |
|---|---|
| US health spending (2023) | $4.5T |
| Chronic pain (2024) | ~50M (20.4%) |
| Medicare Advantage (2023) | >50% |
| Wage inflation (2024) | ~4% y/y |
| Elective drop (COVID peak) | ~48% |
| Physician shortfall (2034) | 37,800–124,000 |
Preview the Actual Deliverable
Zynex PESTLE Analysis
The preview shown here is the exact Zynex PESTLE Analysis you’ll receive after purchase—fully formatted, professionally structured, and ready to use. No placeholders or surprises; the content, layout, and data visible in the screenshot are the final deliverable. You’ll be able to download this identical file immediately after payment.











